To create a report in the Power BI Service, go through the following steps.
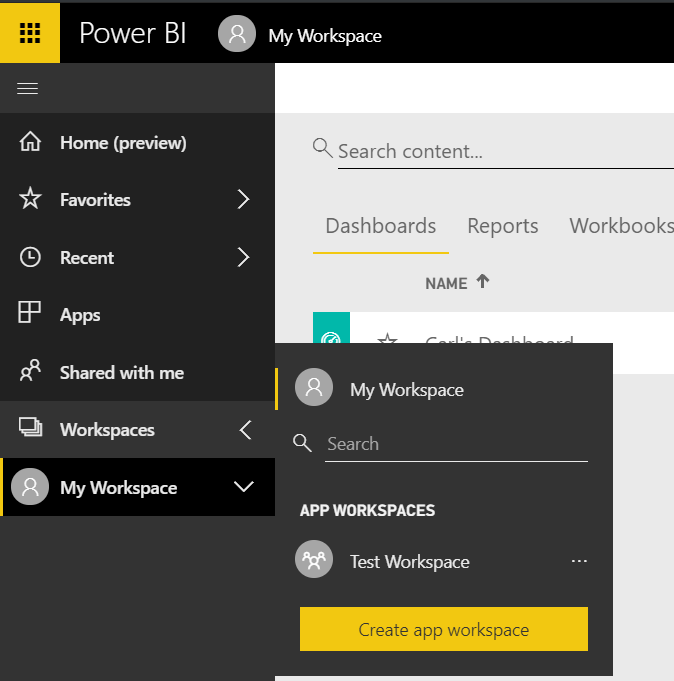
Log into https://powerbi.com and select your app workspace:
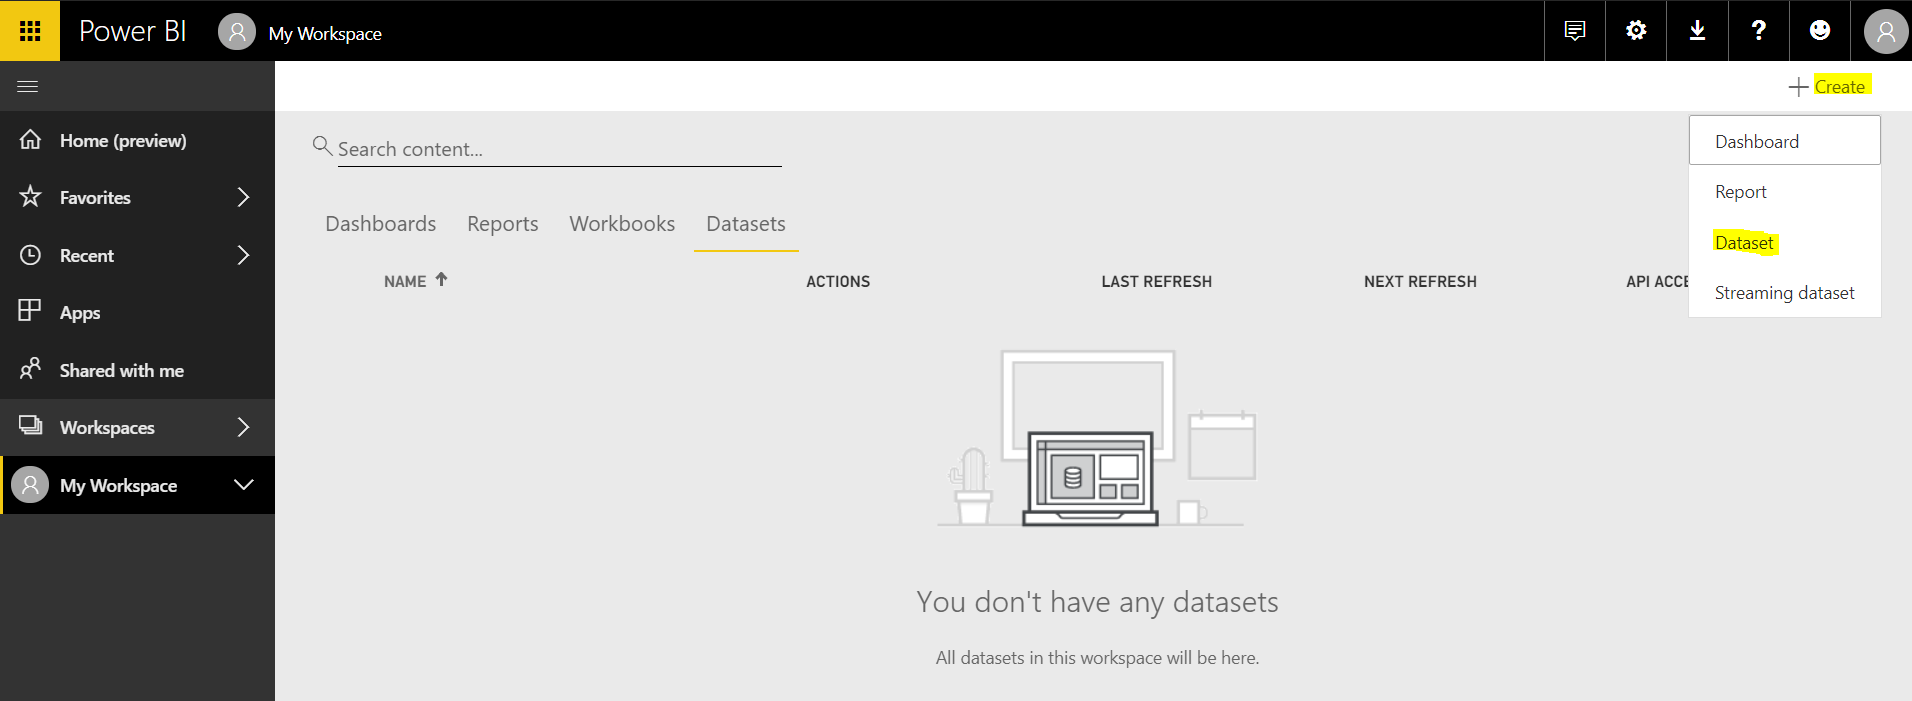
Click on Dataset and select a dataset. If you do not have one, create one. For example, to create a dataset from an Excel file, select + Create ->Dataset:
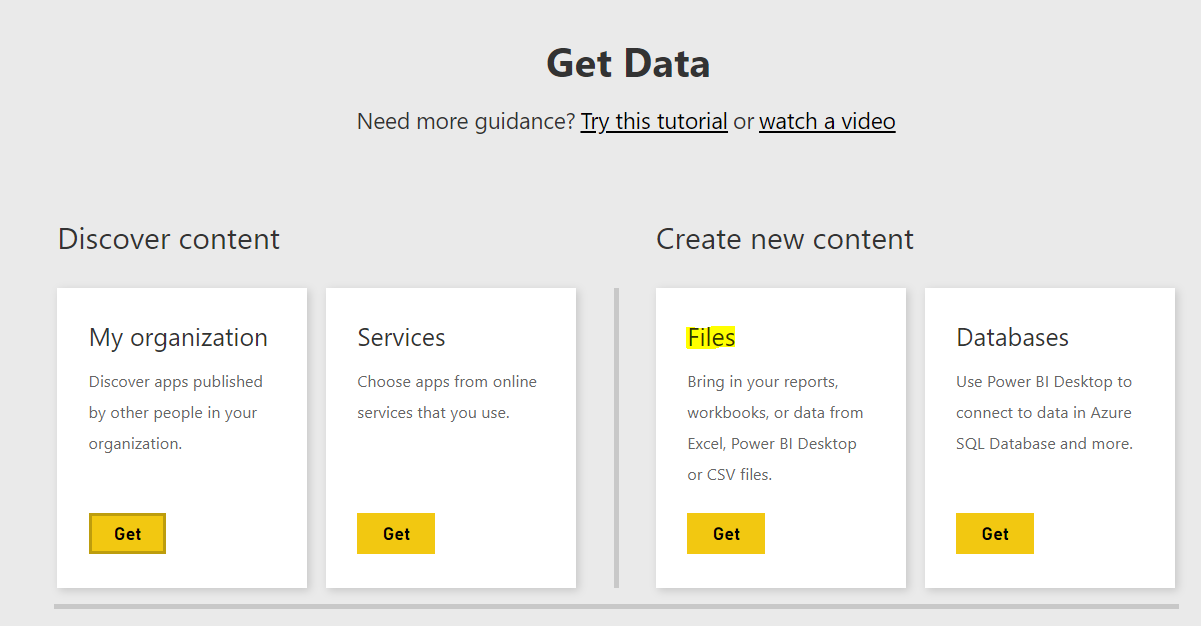
Under Files, select Get:
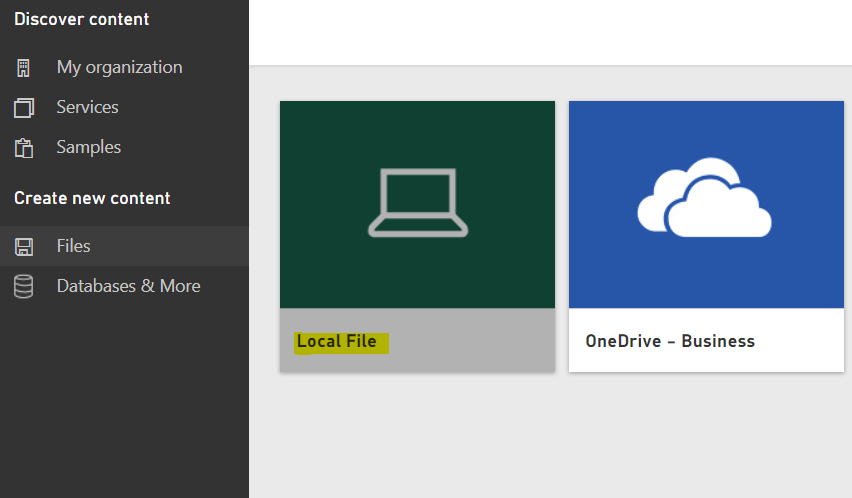
Select Local File.
I have a customers.csv file I will upload:
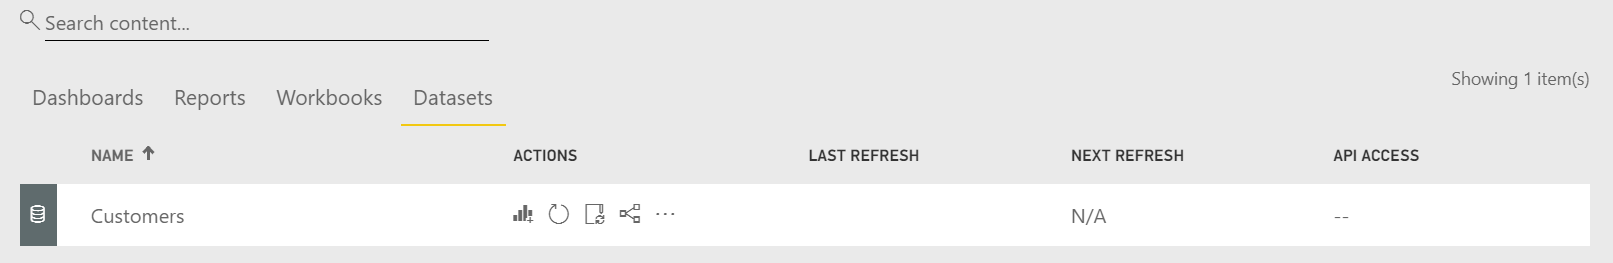
The dataset will be uploaded:
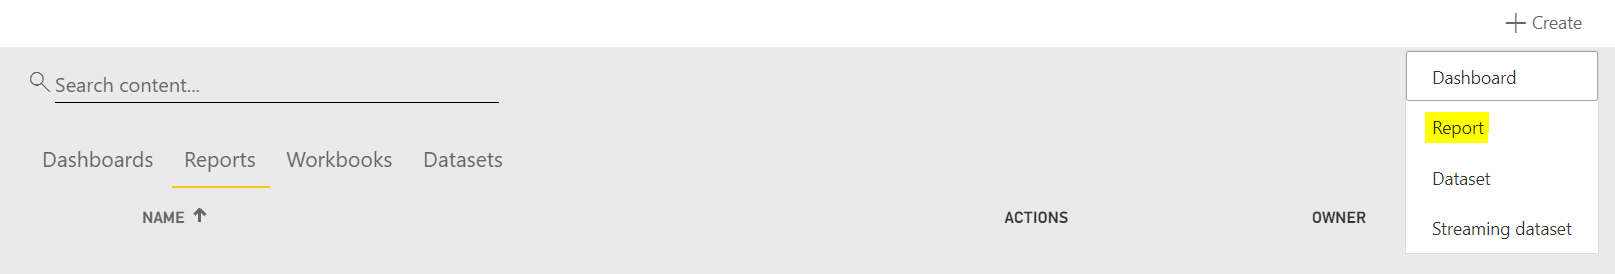
Now, select Reports, and in the top right select + Create -> Report:
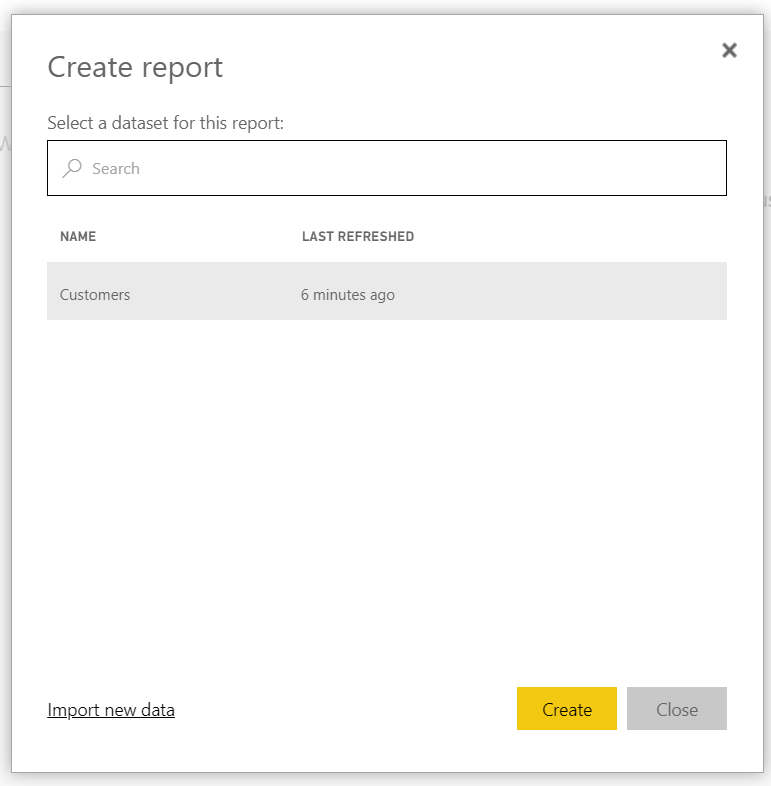
Select the dataset and click Create:
This will then take you to the designer, with the dataset showing on the right:
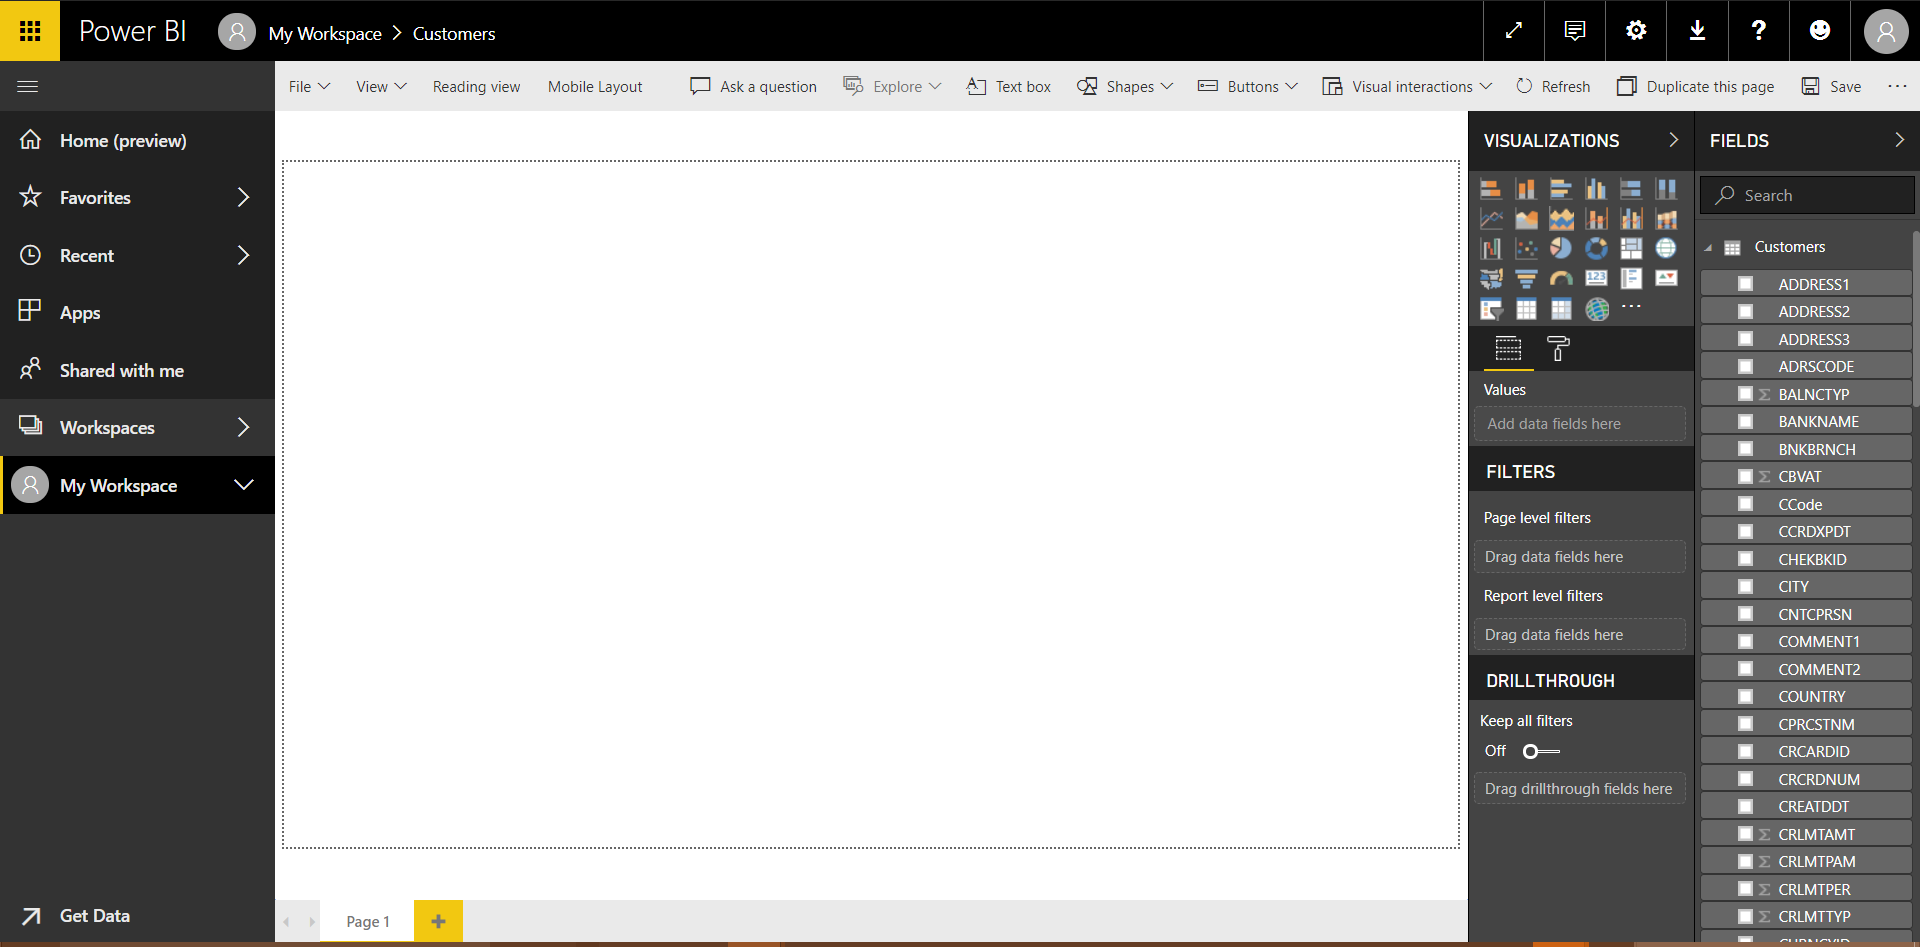
Create a visual:
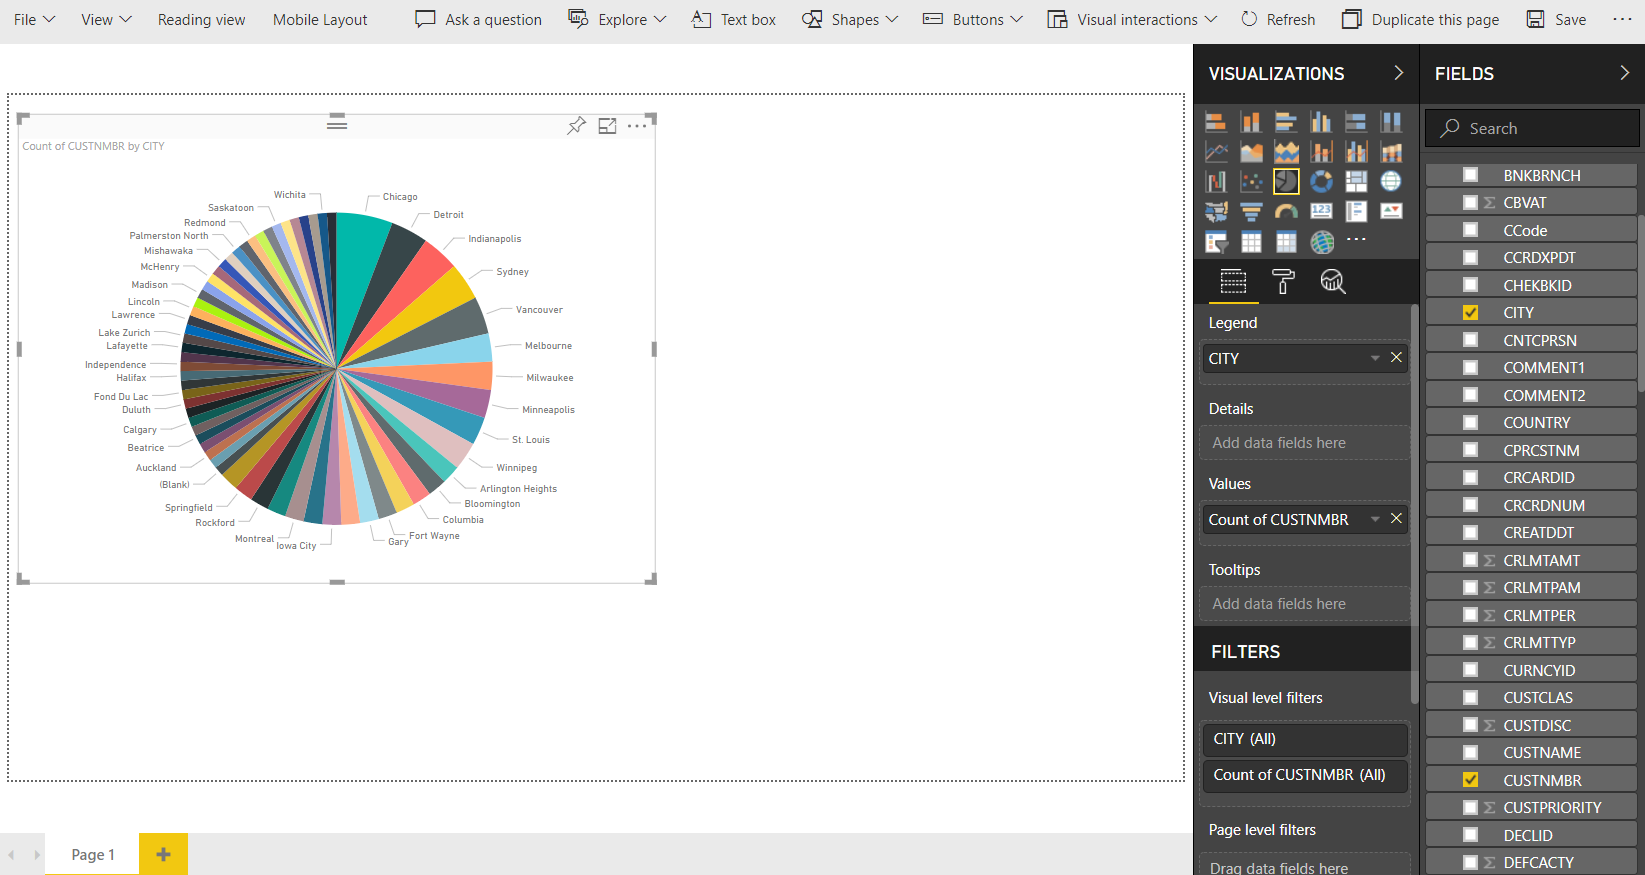
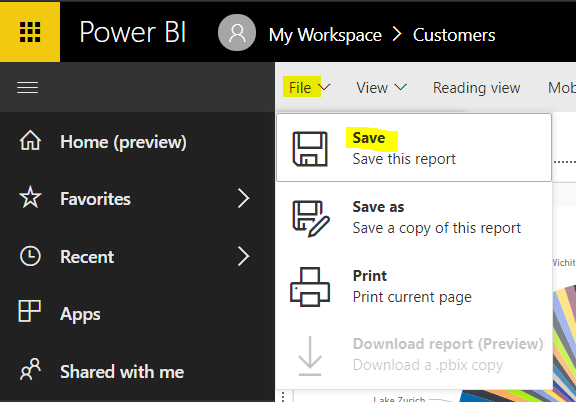
Save the report:
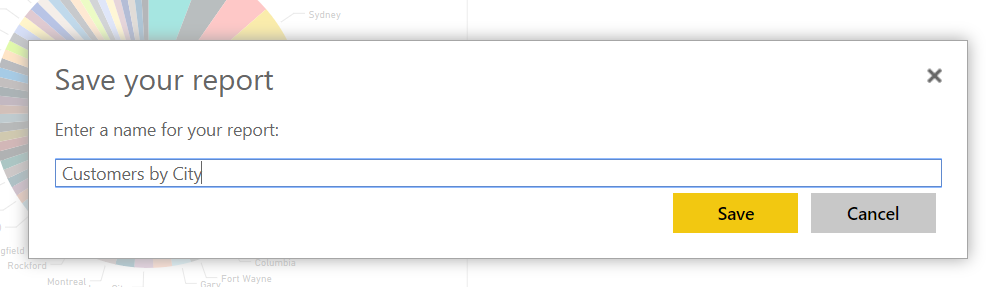
Provide a name:
Now, clicking back on your app workspace and selecting Reports, you will see the reports have multiple options:

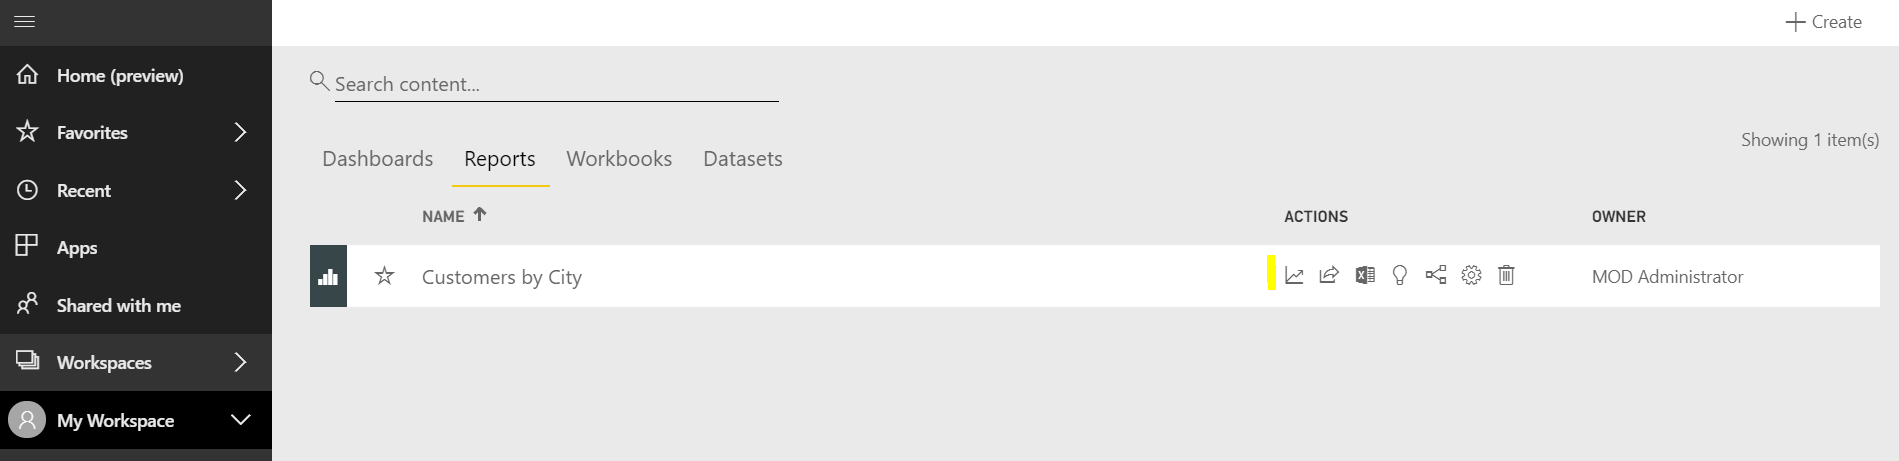
These include:
- View Usage Metrics
- Share
- Analyze in Excel
- Quick Insights
- View Related
- Settings
- Delete
I will go into these options in more detail in other posts.
I AM SPENDING MORE TIME THESE DAYS CREATING YOUTUBE VIDEOS TO HELP PEOPLE LEARN THE MICROSOFT POWER PLATFORM.
IF YOU WOULD LIKE TO SEE HOW I BUILD APPS, OR FIND SOMETHING USEFUL READING MY BLOG, I WOULD REALLY APPRECIATE YOU SUBSCRIBING TO MY YOUTUBE CHANNEL.
THANK YOU, AND LET'S KEEP LEARNING TOGETHER.
CARL
