Quick Insights are a feature of Power BI that analyses data sets and finds patterns, trends and outliers. Once your data is uploaded to the Power BI cloud, you can use the Quick Insights feature.
Using it is simple. First log into https://powerbi.com.
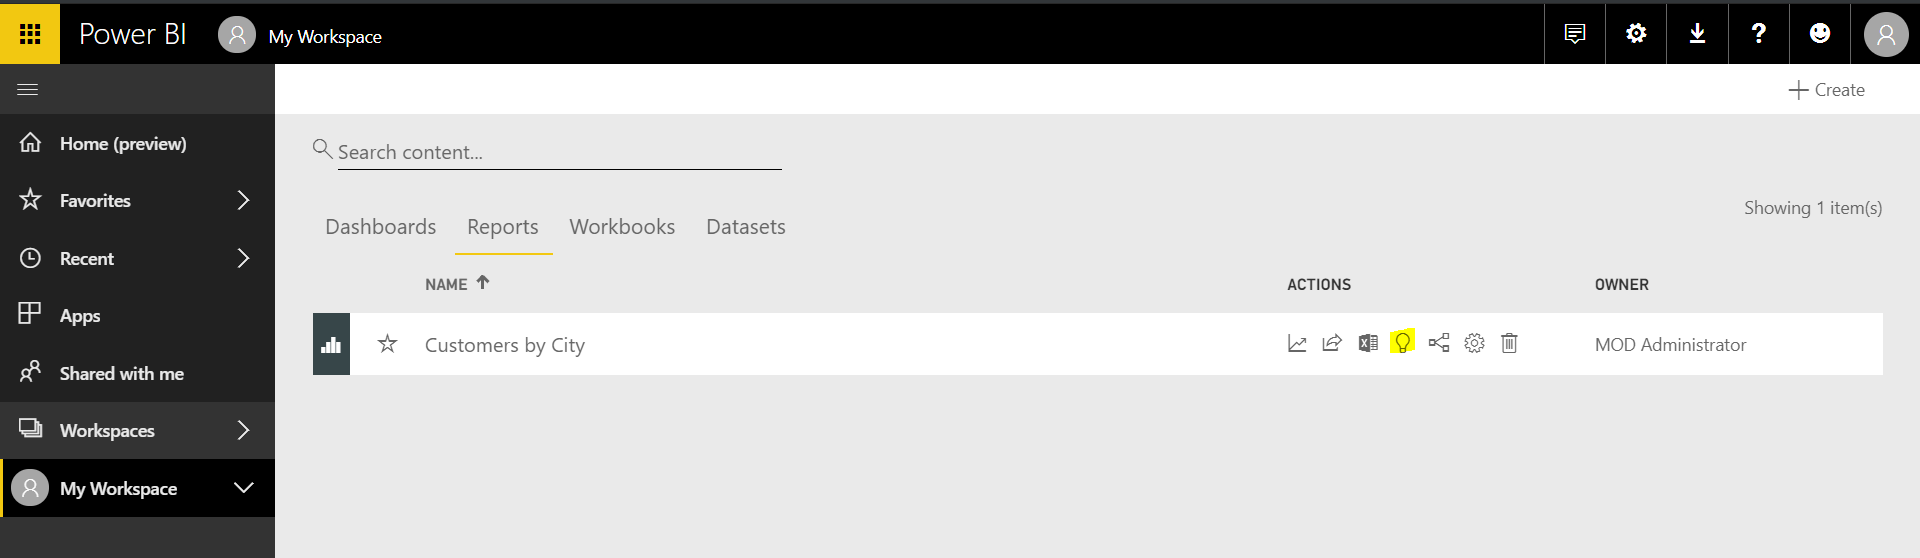
Go to a report you have created in your app workspace and select the Quick Insights icon:
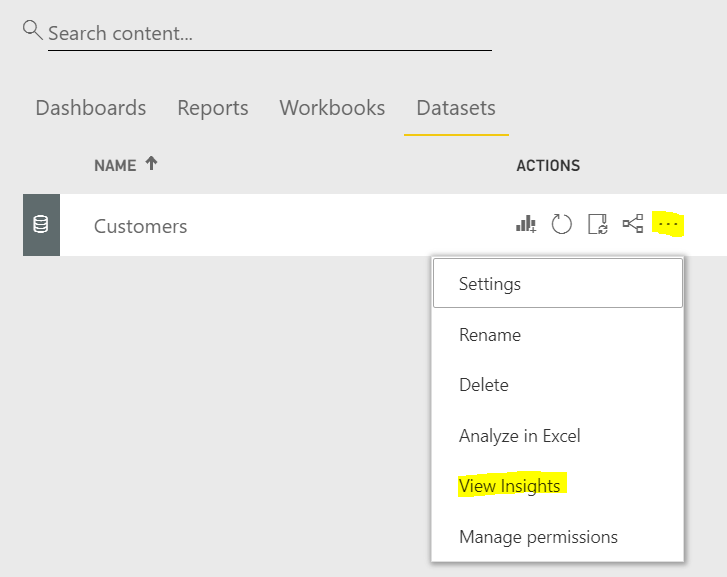
Alternatively, select the Dataset and View Insights. The insights actually run against the data (as opposed to the report):
The first time you select this, the system will process and analyze the data. The following page will then open:
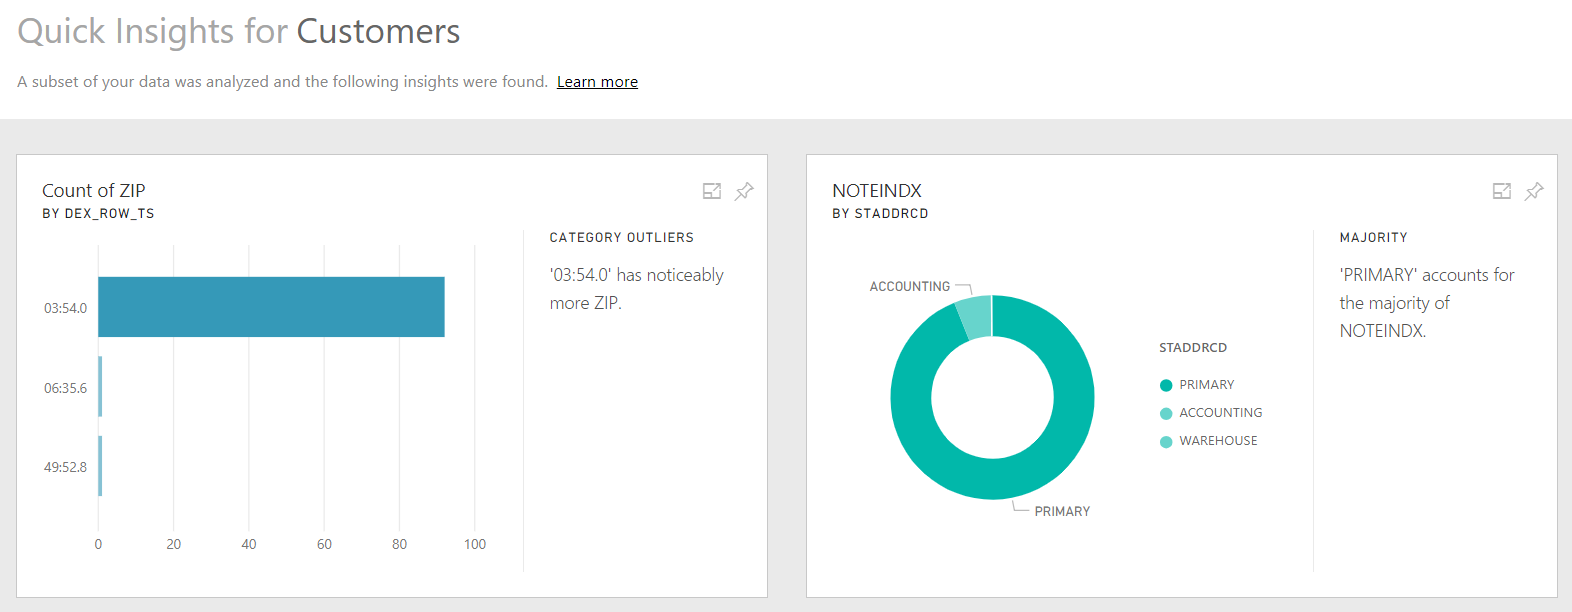
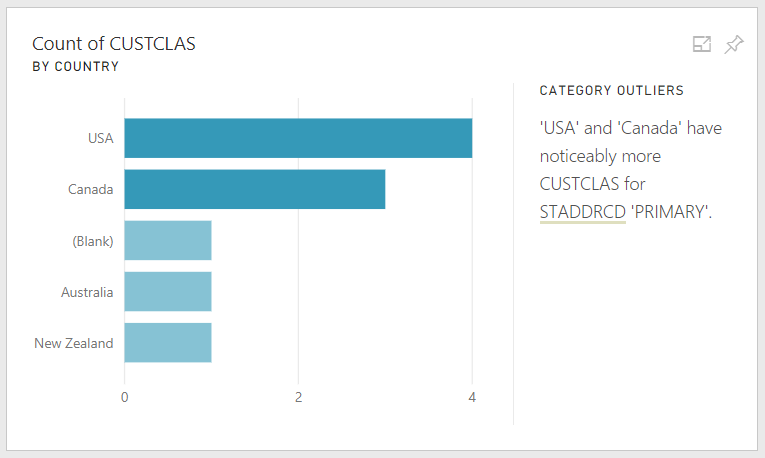
You should see multiple insights the system has found. Some insights may not make sense, and others will. For example, the insights have found that most customers in this dataset come from the USA or Canada, which is useful information:
I AM SPENDING MORE TIME THESE DAYS CREATING YOUTUBE VIDEOS TO HELP PEOPLE LEARN THE MICROSOFT POWER PLATFORM.
IF YOU WOULD LIKE TO SEE HOW I BUILD APPS, OR FIND SOMETHING USEFUL READING MY BLOG, I WOULD REALLY APPRECIATE YOU SUBSCRIBING TO MY YOUTUBE CHANNEL.
THANK YOU, AND LET'S KEEP LEARNING TOGETHER.
CARL
