Power BI has a visualization that allows us to embed Power Apps Canvas Apps inside of Power BI reports, which can be useful if you want to liven up your Power BI reports! In this post we will create a Power BI report that displays related contact information from a selected account from the Dataverse. This follows on from a similar concept where we embedded a Canvas App inside a Model-Driven App.
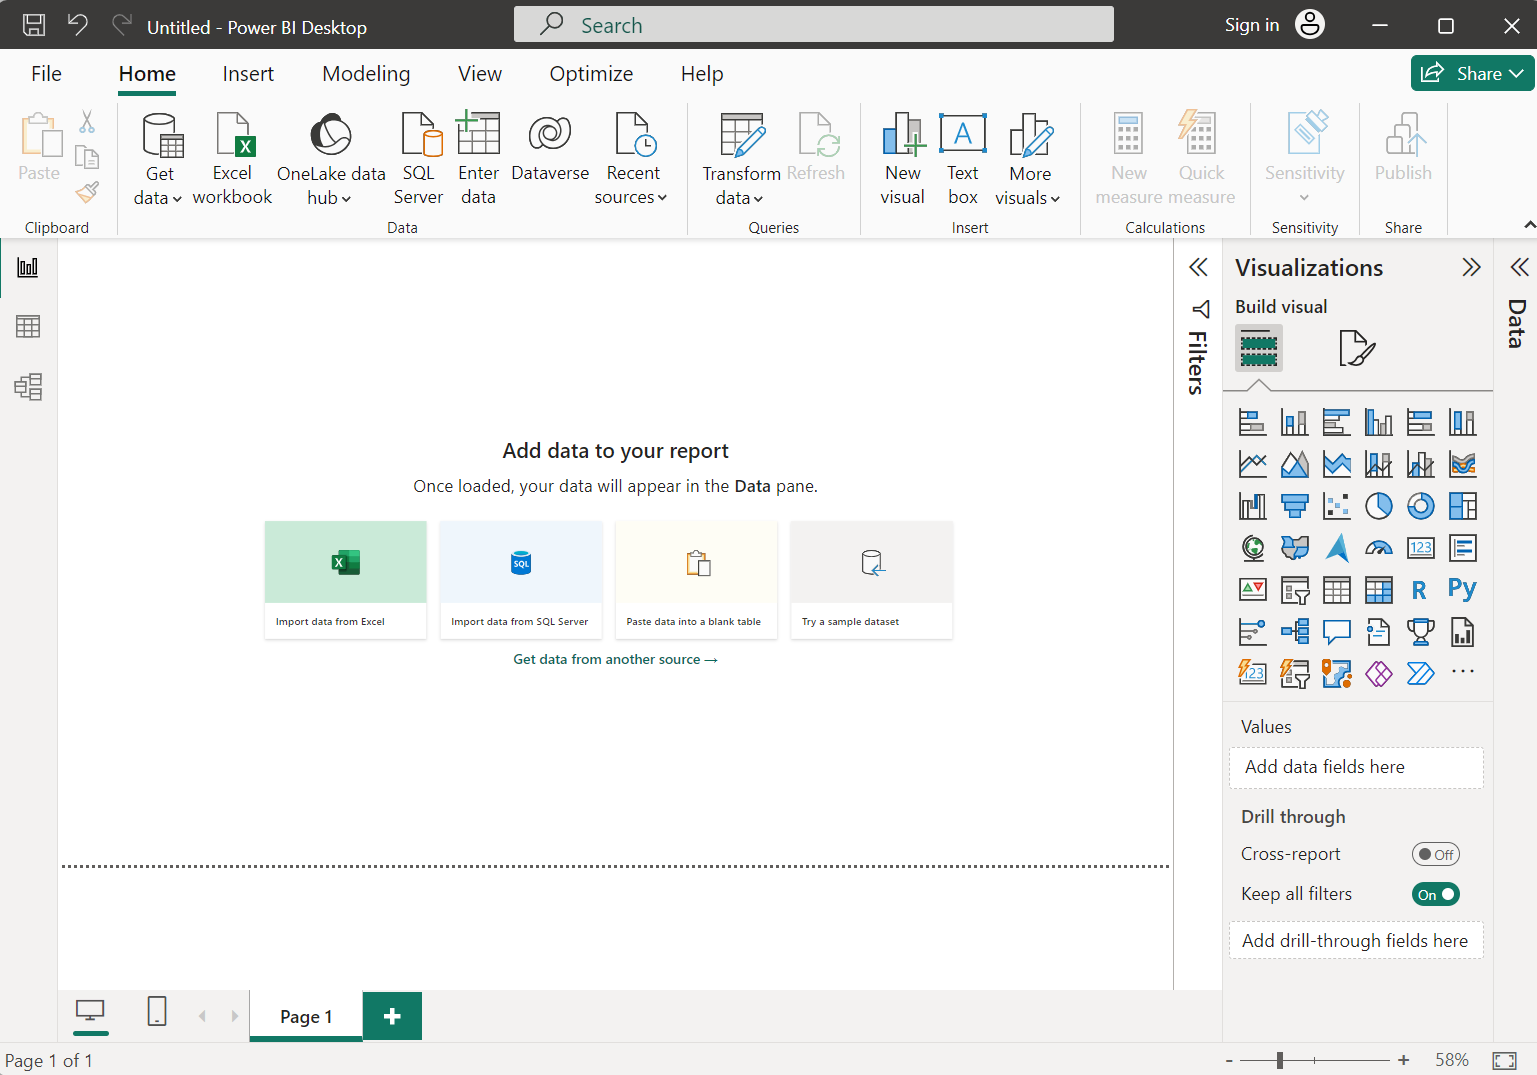
First, you will need Power BI Desktop, so go ahead and download it if you don’t already have it. Then open it and create a new report:
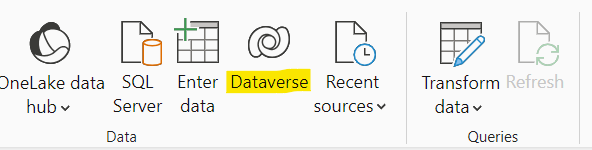
Next, select Dataverse and let’s connect to a Dataverse endpoint. Go ahead and sign in when prompted:
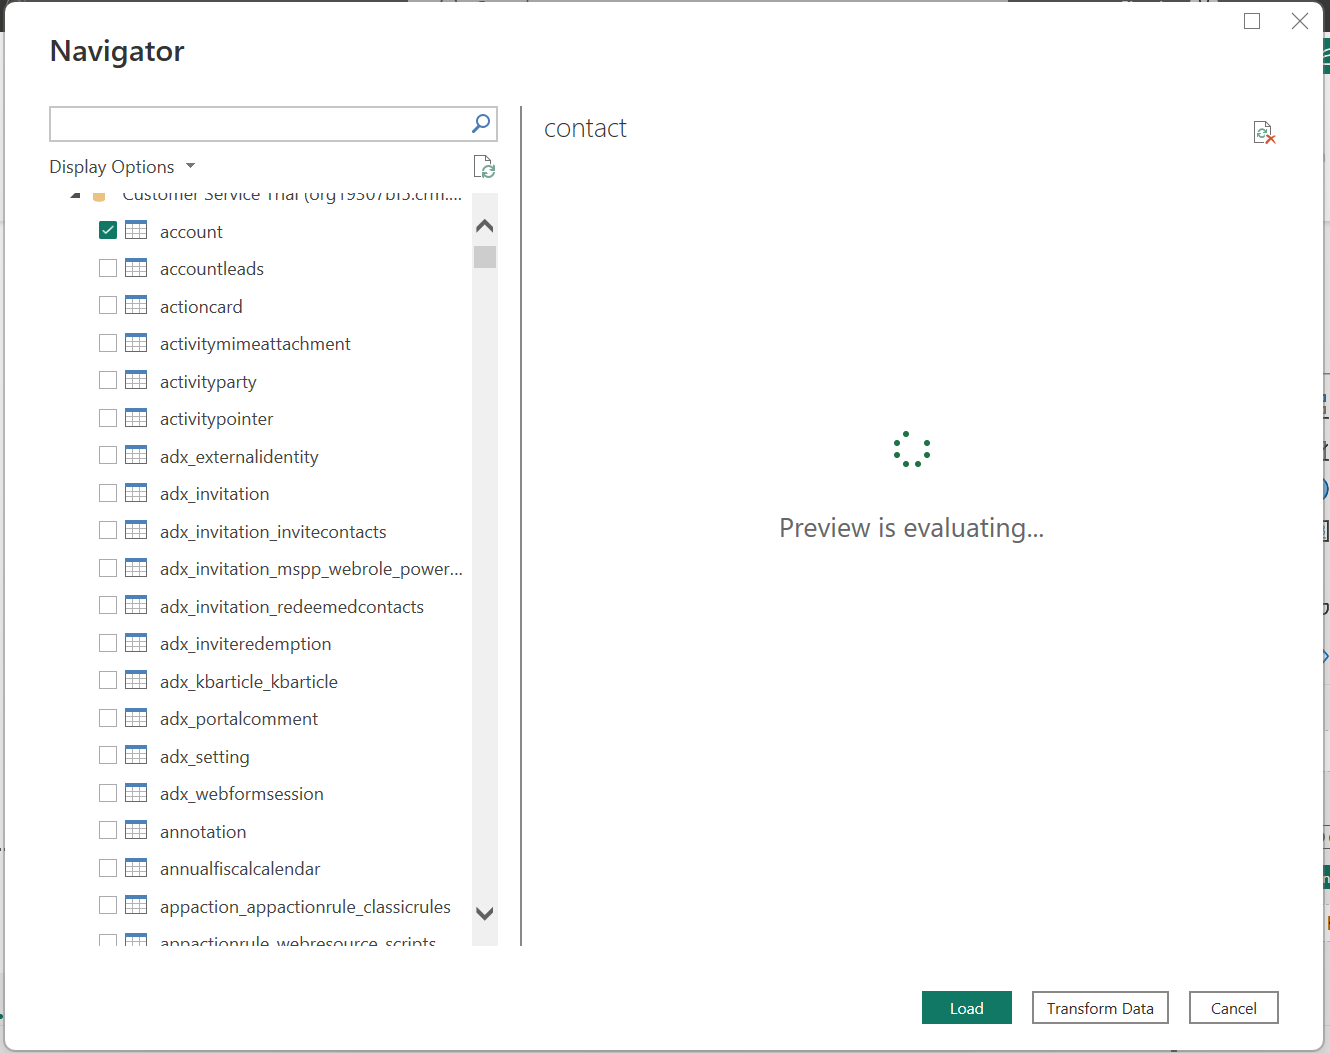
We will select Account and Contact data, then click Load:
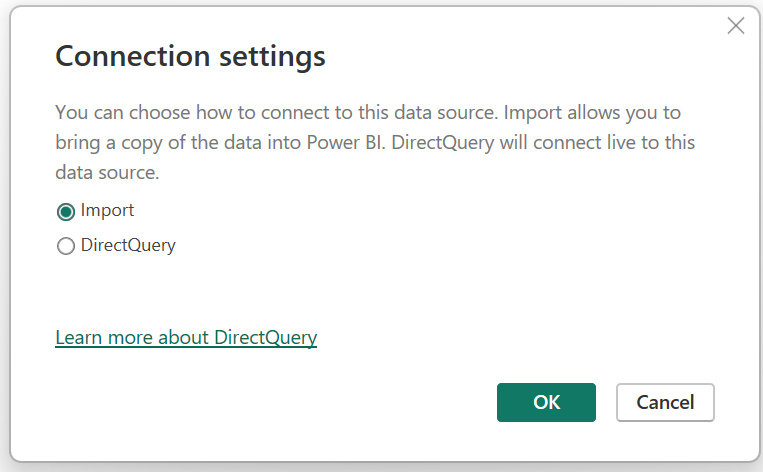
For this exercise, we will use Import:
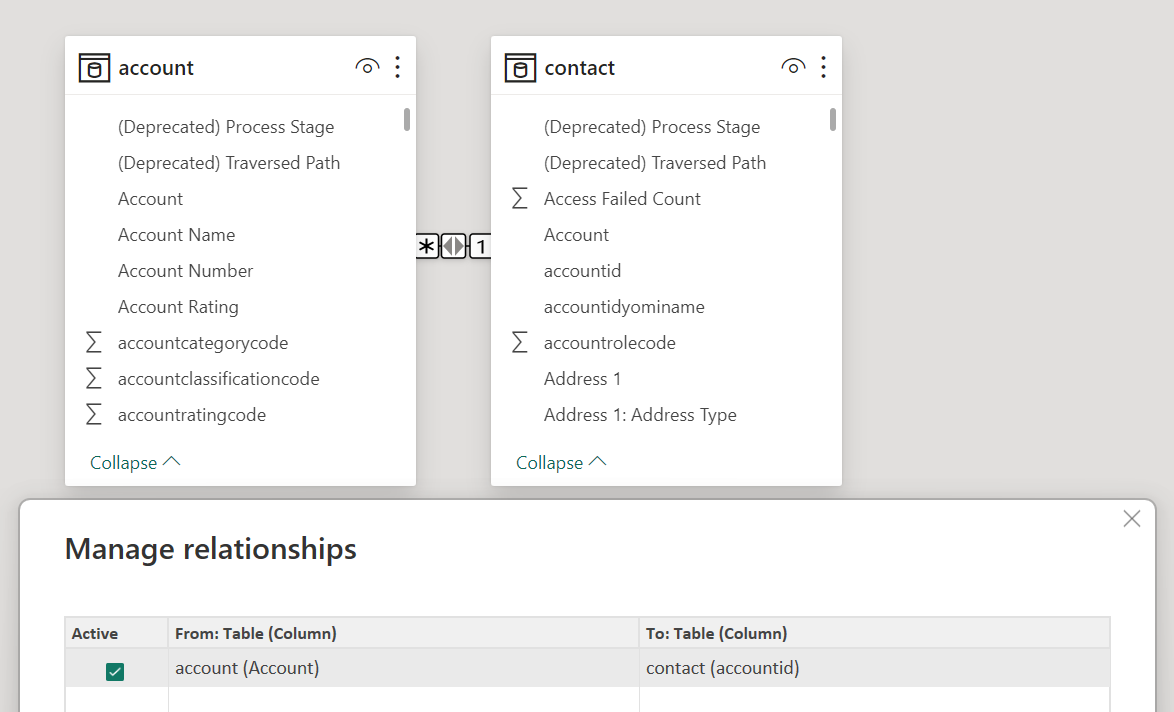
In our relationships tab, we can see relationships between the two tables has already been created, but sometimes there are inaccurate. For simplicity, we will have one relationship like below:
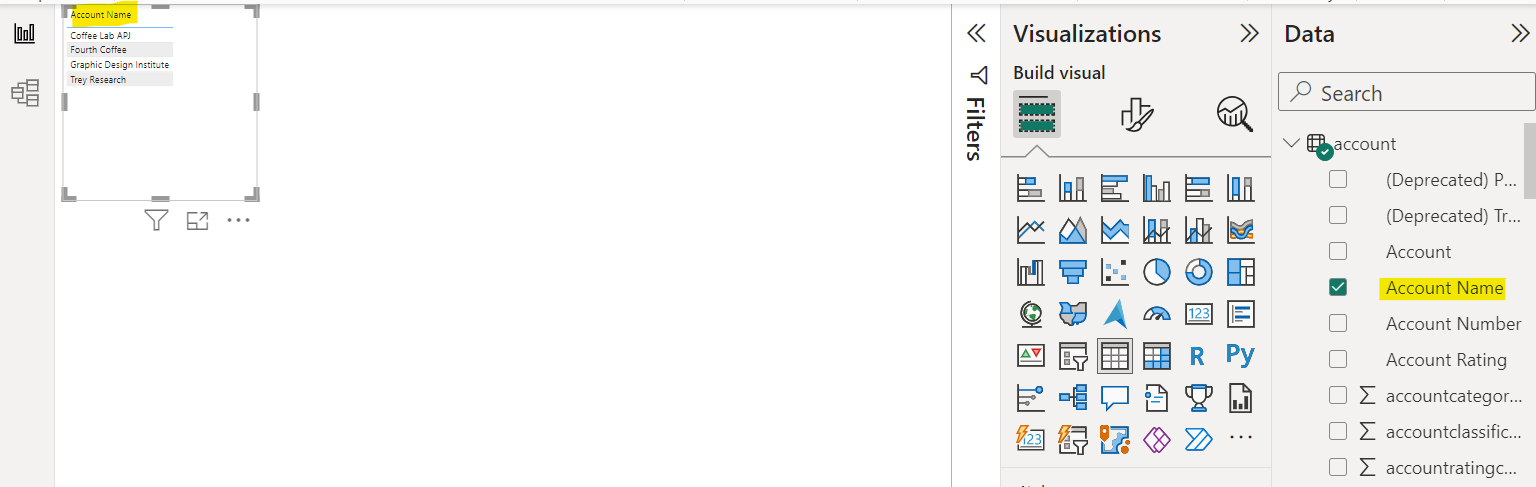
Let’s create one visual of Accounts with Account Name:
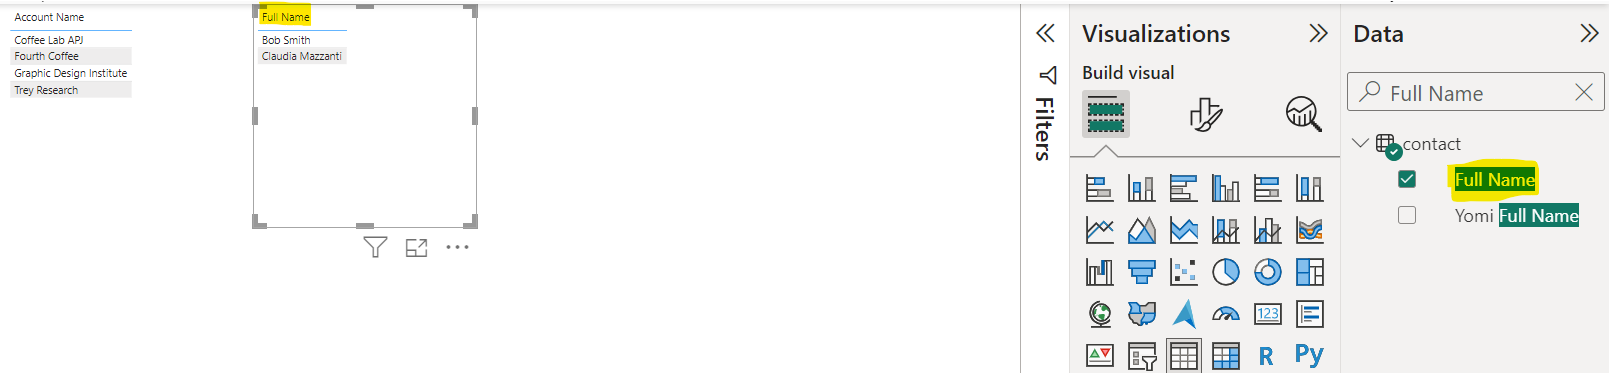
And another one of Contacts with the Full Name:
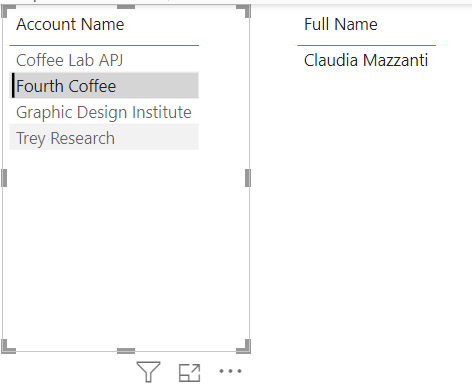
Now if we select an account, it filters the related contacts:
Now let’s add a Power App. Click on the following visualization:
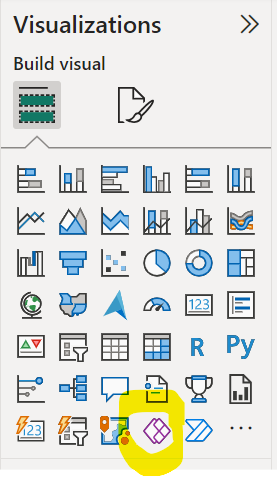
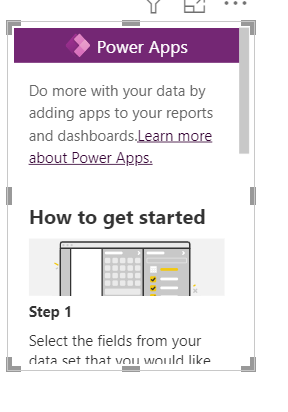
This adds the following to the report:
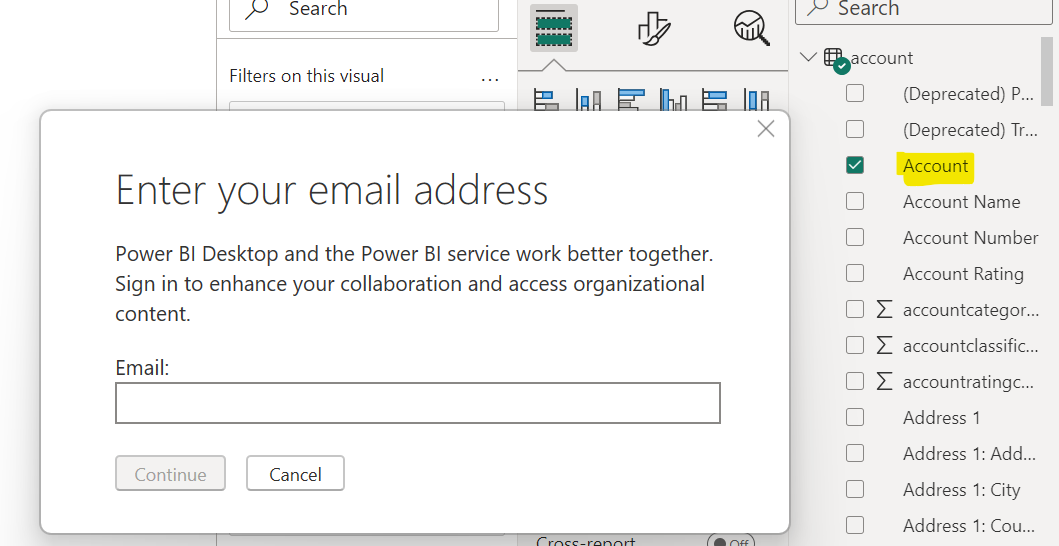
To get this connected, the first thing is to add the fields from the dataset to use in the app. Selecting Full Name from Contacts, we are prompted to sign in:
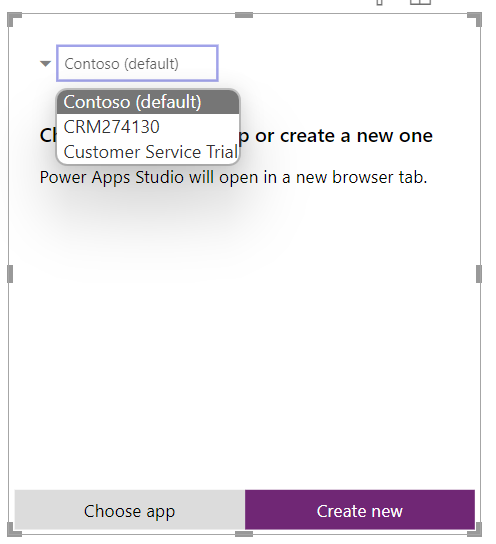
Once signed in, you can select an org, and then choose an existing app or to create a new app. We will create a new app:
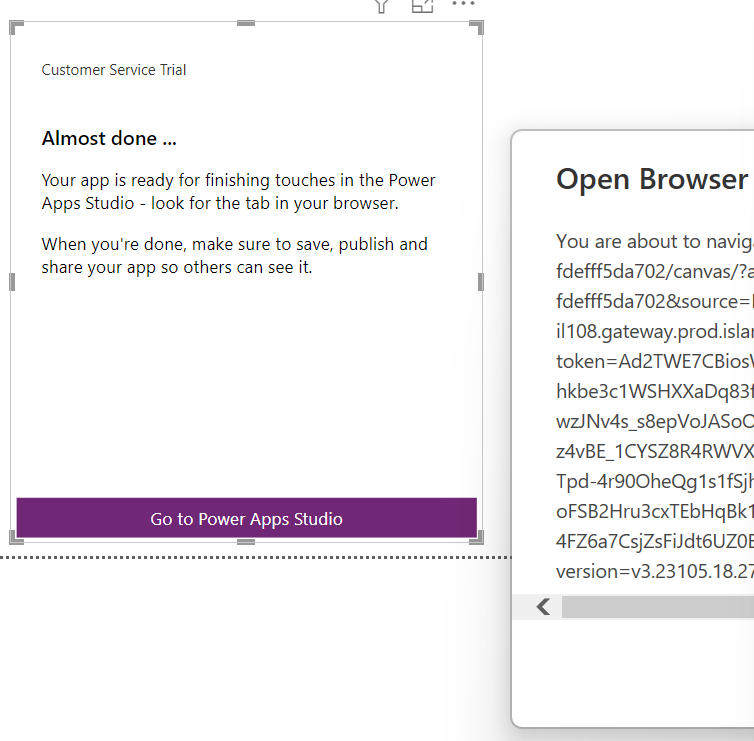
Power Apps studio opens and we see an app that has been created for us:
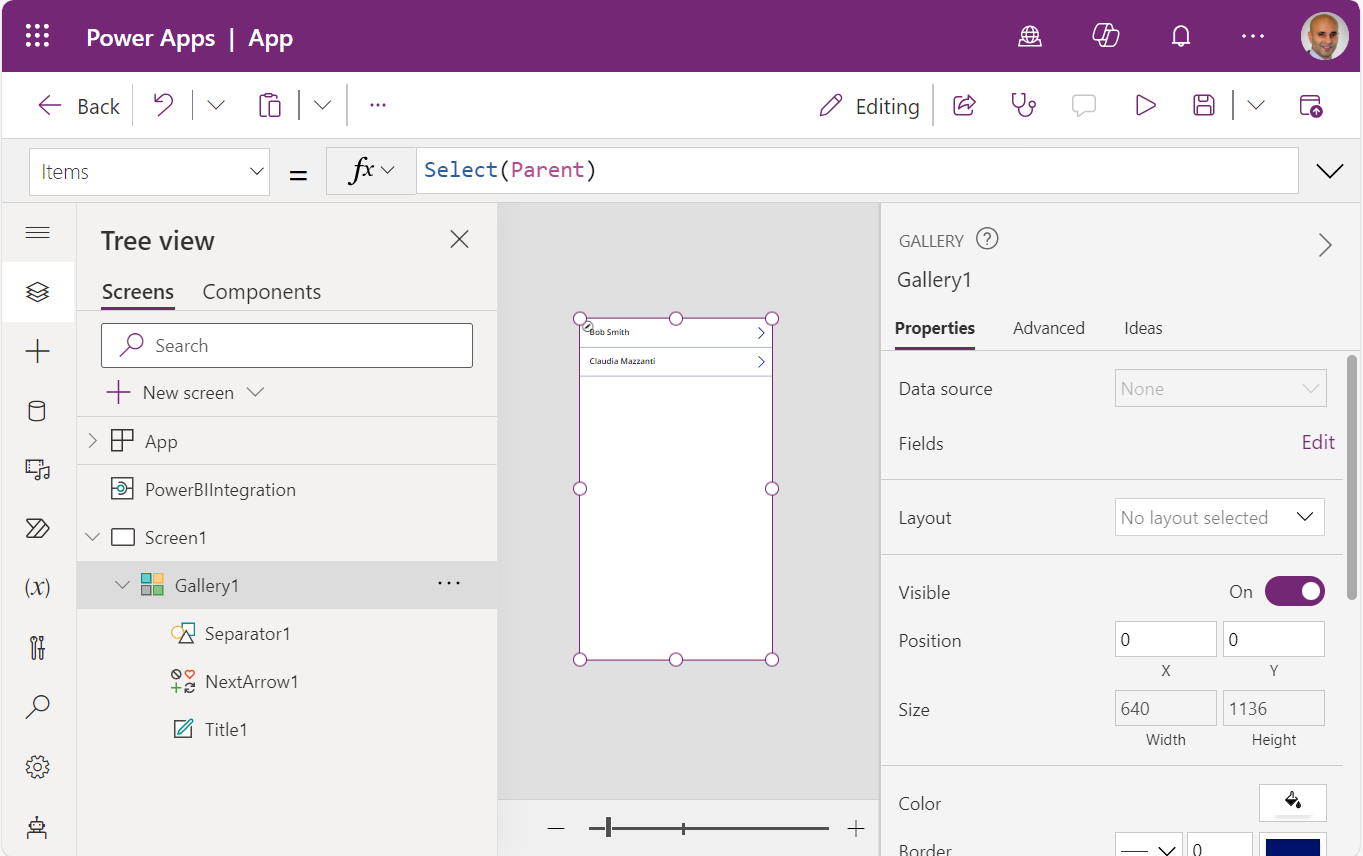
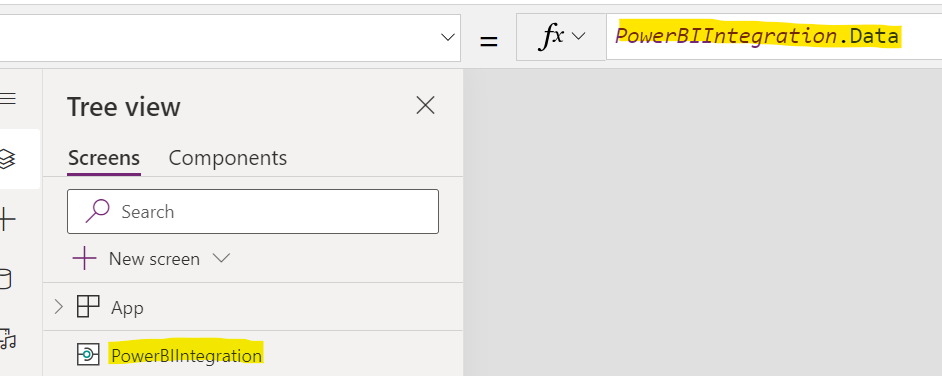
Note the PowerBIIntegration which provides contextual data to the report (similar to the ModelDrivenFormIntegration when embedding Canvas Apps in Model-Driven Apps):
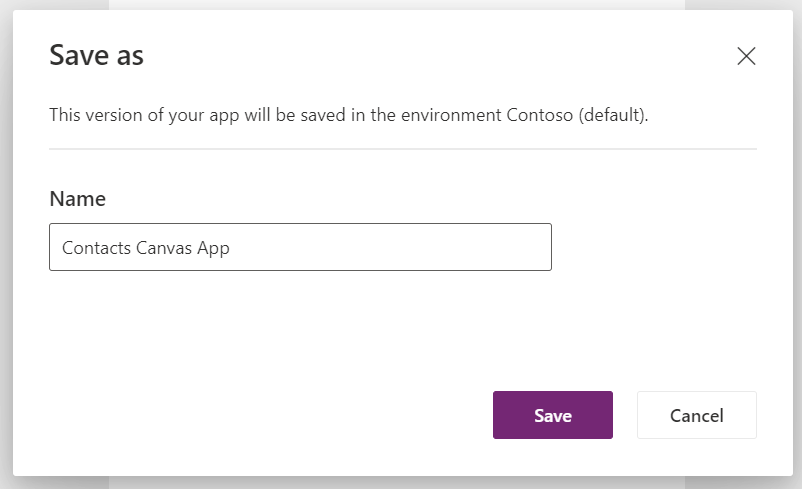
Let’s go ahead and save this app and publish it:
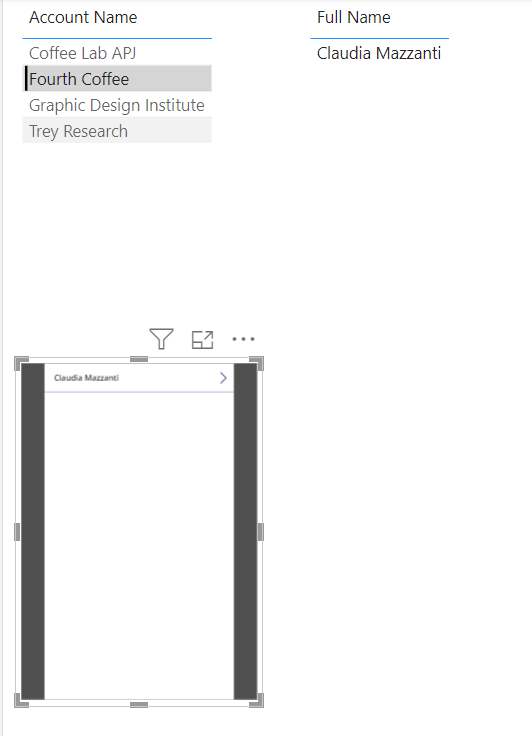
Tabbing back over to Power BI, we see the app is appearing in our report and is contextually filtered:
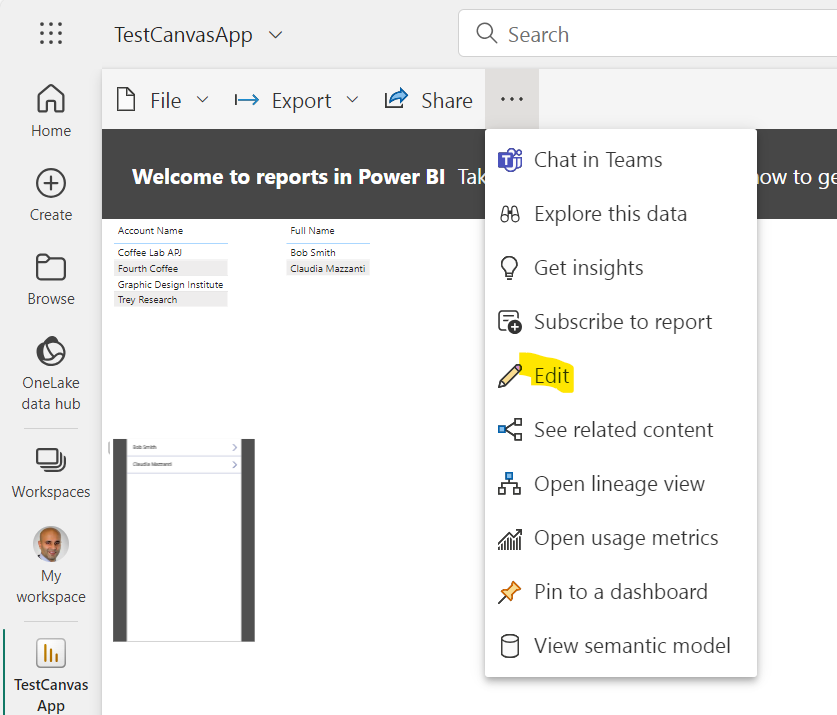
Now let’s say we want to make a change to add a new field to the report, there is a workaround way without starting from scratch. Publish the report to the Power BI service, and Edit the report:
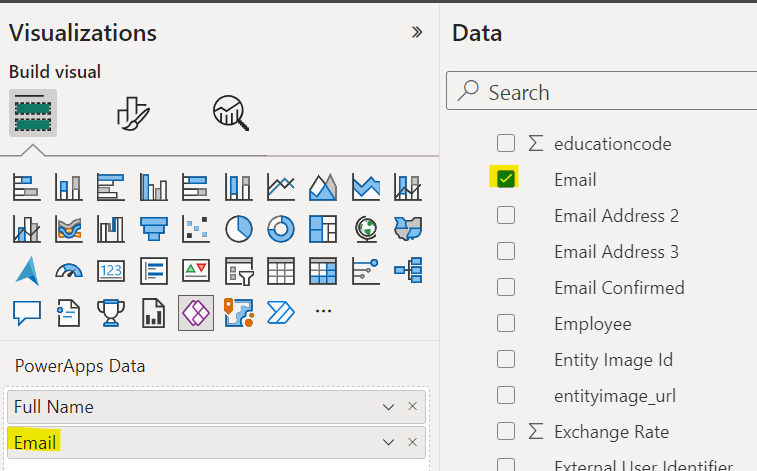
Add the fields to the visual you would like. I will add email address:
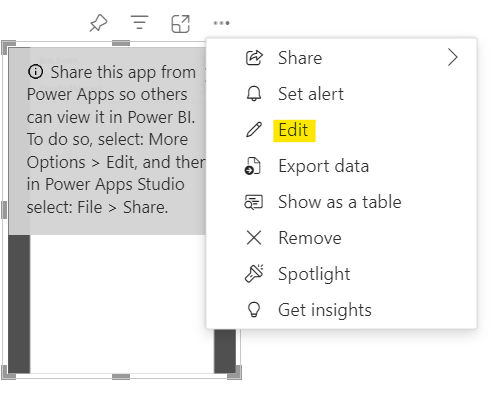
Save the report, then Edit the visual:
Drag across a text label field and populate it with the new field – ThisItem.Email:
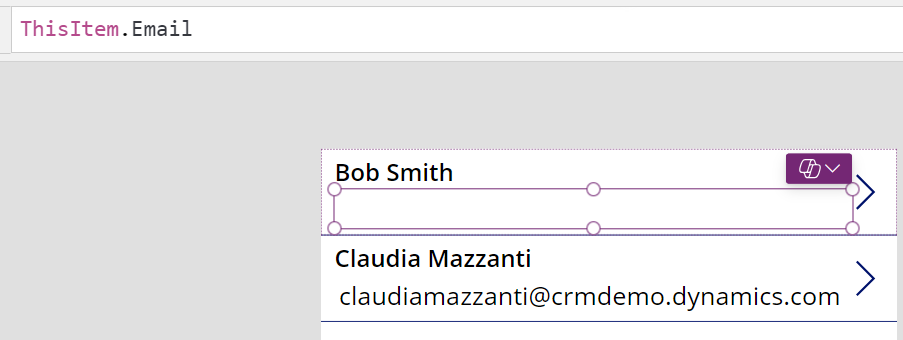
Save and Publish.
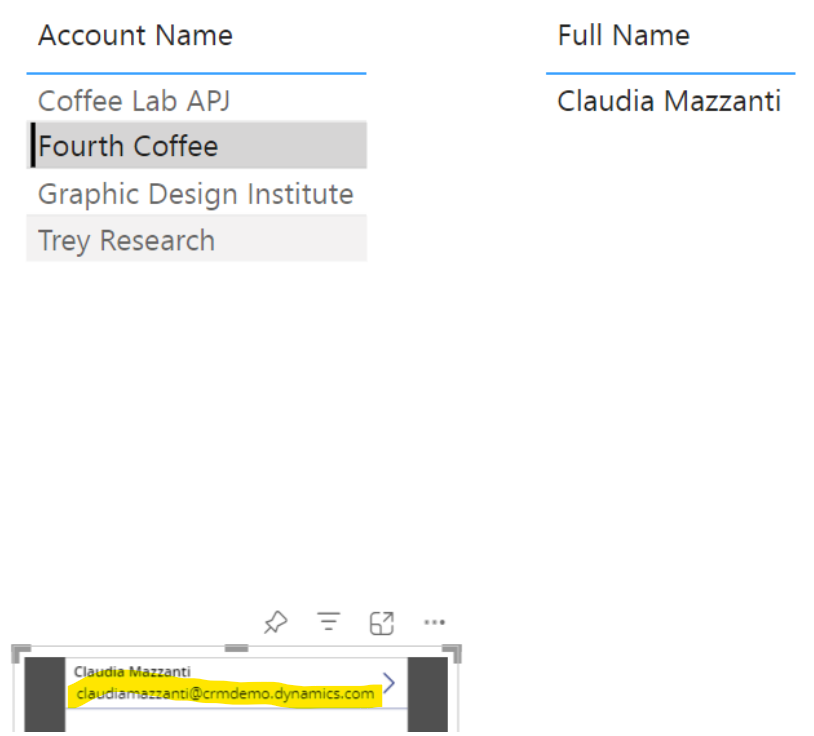
You can then readd the visual on the Power BI report to refresh it.
I AM SPENDING MORE TIME THESE DAYS CREATING YOUTUBE VIDEOS TO HELP PEOPLE LEARN THE MICROSOFT POWER PLATFORM.
IF YOU WOULD LIKE TO SEE HOW I BUILD APPS, OR FIND SOMETHING USEFUL READING MY BLOG, I WOULD REALLY APPRECIATE YOU SUBSCRIBING TO MY YOUTUBE CHANNEL.
THANK YOU, AND LET'S KEEP LEARNING TOGETHER.
CARL
