Power BI can connect to Dynamics 365, so we can build reports connecting the two systems. In this post, we will go through building your first Power BI report connecting to Dynamics 365. The steps we will go through to build a report are:
- Connect Power BI Desktop to the Dynamics 365 Web API
- Remove Columns and Add Columns through Power Query (M)
- Create Relationships and Build the Report
- Publish the Report
- View and Share the Report in powerbi.com
- Schedule Refresh to Update Data Automatically
The report will display account, contact and opportunity data.
1. Connect Power BI to Dynamics 365
First, we will connect to the Dynamics 365 data, directly from Power BI. There are other ways to connect, such as by exporting the data from Dynamics 365 to an Azure SQL database or data warehouse. In this example we will connect directly to the Dynamics 365 cloud.
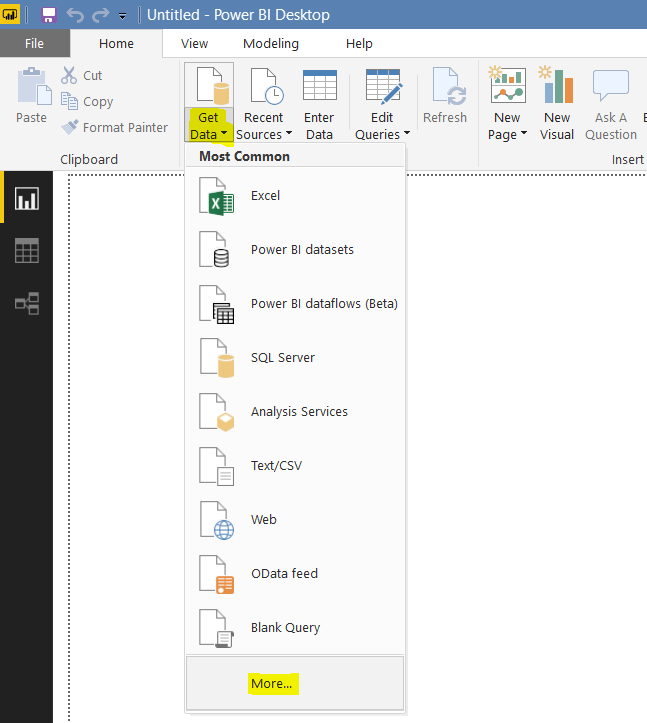
Open Power BI Desktop. From the toolbar, select Get Data and then More:
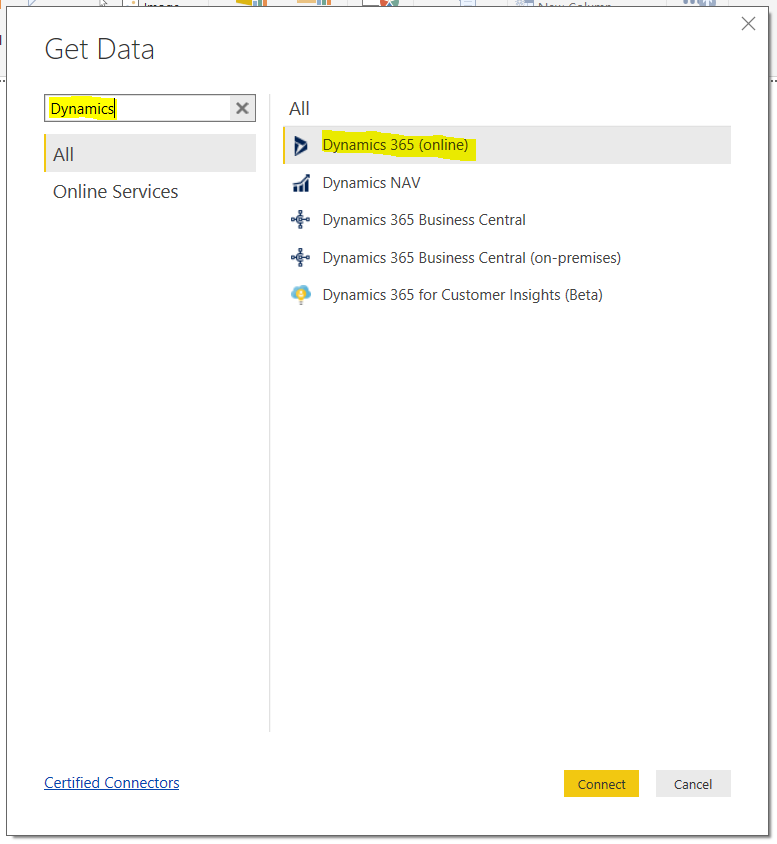
Type in Dynamics, and select Dynamics 365 (Online). Click Connect:
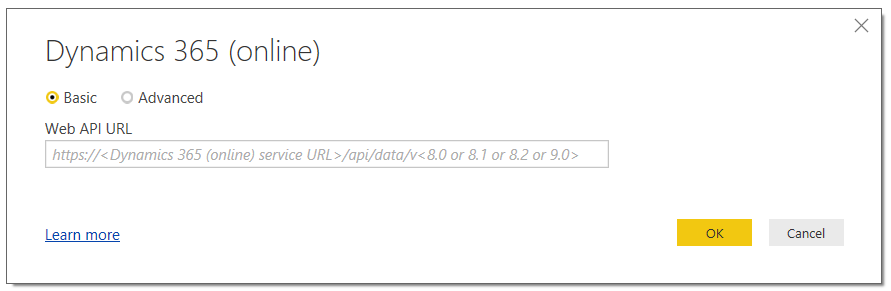
You will be prompted to enter a Web API URL, in the format. Click here to find what your Web API URL is. In my case, in the format is https://yourorg.crm.dynamics.com/api/data/v9.1/:
I will log on using Organizational Account. Click Sign In, and then Connect:

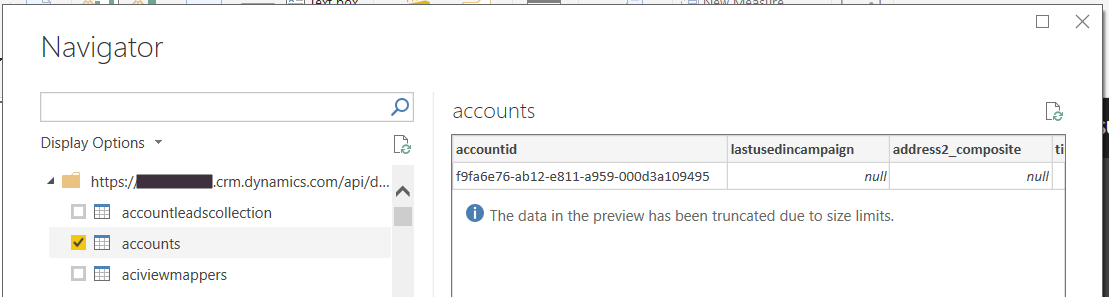
This will then display the Navigator, which shows the entities available to connect to:
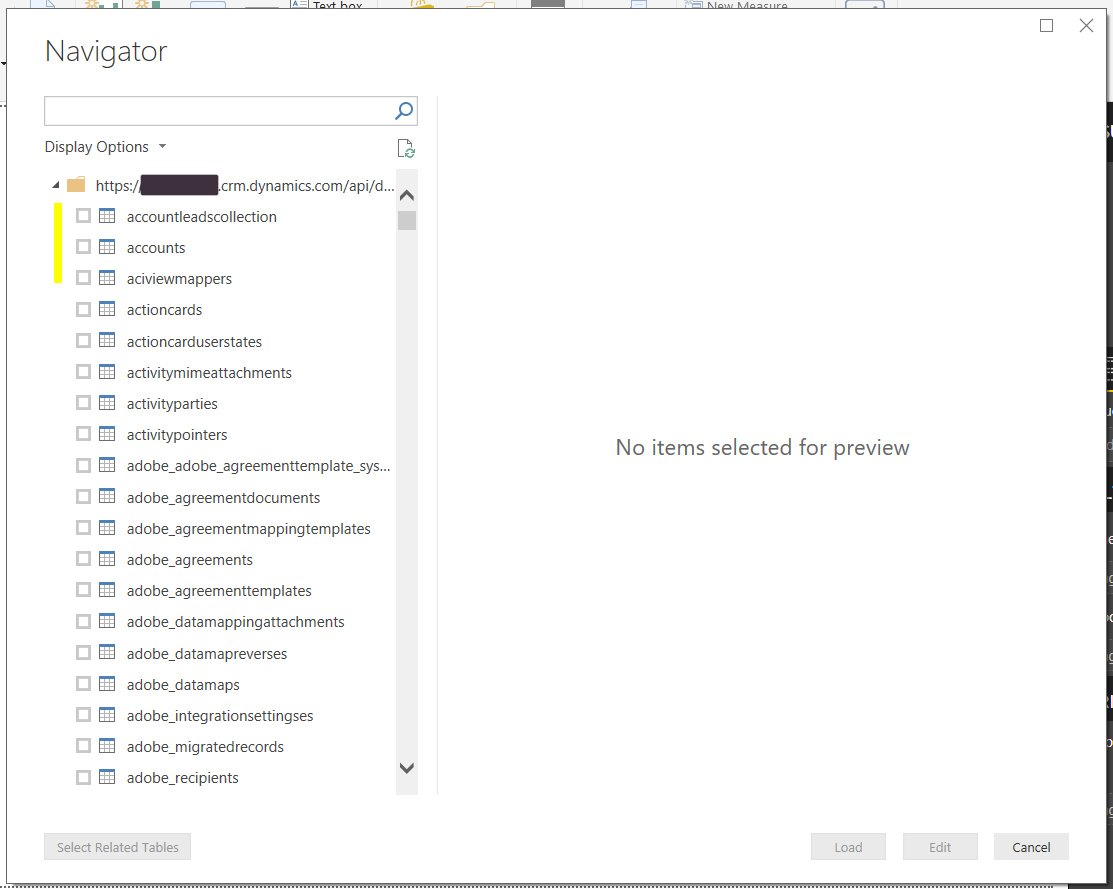
Selecting an entity will display a preview of the data:
Select a few entities you would like to build reports on. Once you have selected all you require (note – you can add more later), you have 2 options:
- Load – This loads the data onto the report canvas so you can start building reports
- Edit – This takes you to Edit Queries where you can work on the data before building the report
![]()
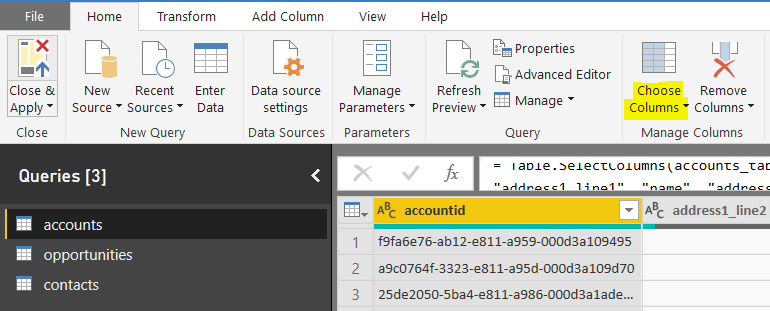
Click Edit. You will see the data sources on the left, with the data in the middle:

We can now select the data we need.
2. Remove Columns and Add Columns through Power Query (M)
At this point, you will add/remove fields and create a report. Select Accounts and click on Choose Columns:
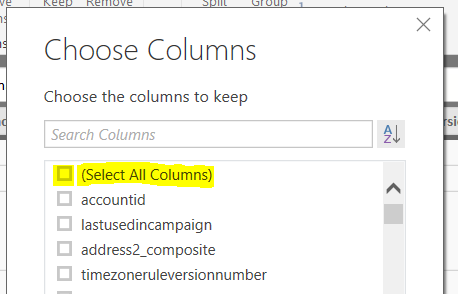
As we will only choose a few columns, uncheck Select All Columns so no columns are selected:
Then select the columns required. Type in a column name to filter:
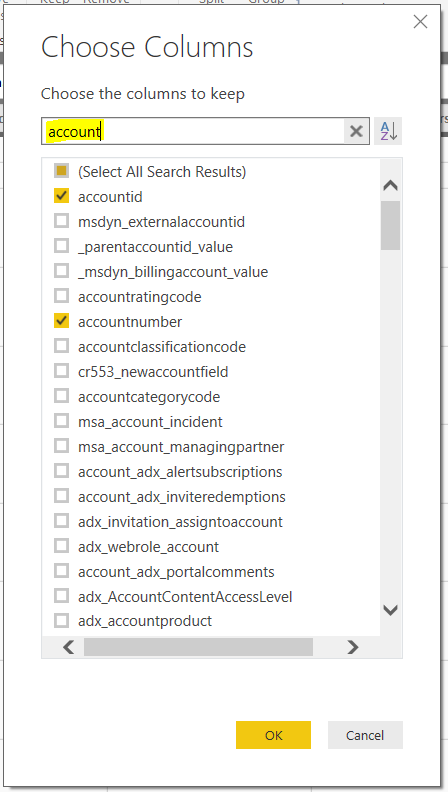
You will need to select Id columns so we can use them to link the data together. For example, accounts and contacts are connected by the accountid and parentcustomerid fields. We will select those as well as fields such as the name, address fields etc.
Once all columns have been selected, repeat with the other data sources. Then click Close and Apply. This will load the data to the report:
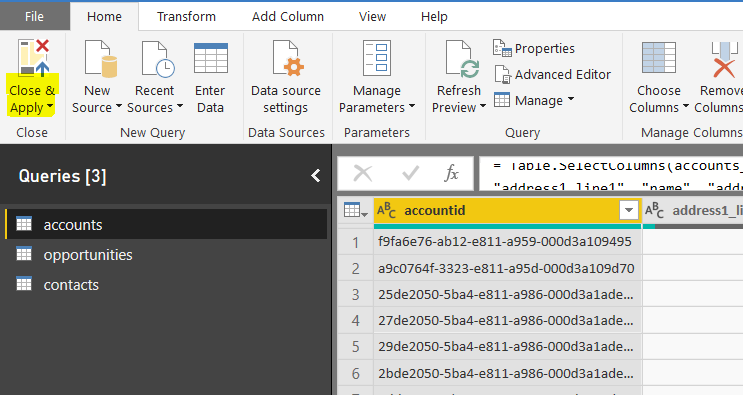
You can also add any additional columns at this point, and use Power Query “M” language to perform business logic on the data such as filtering the data and adding calculated columns. To keep this example simple, we will use the data as it is.
3. Create Relationships and Build the Report
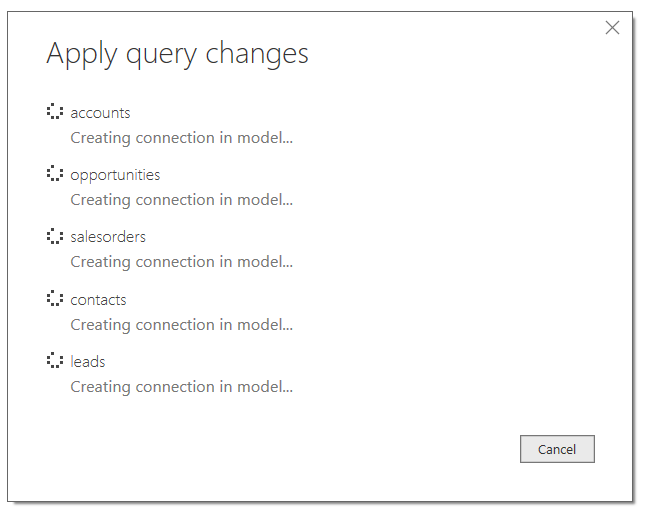
We are now taken to the report canvas. You will see the data loading on the report. This may take some time depending on the size of your data:
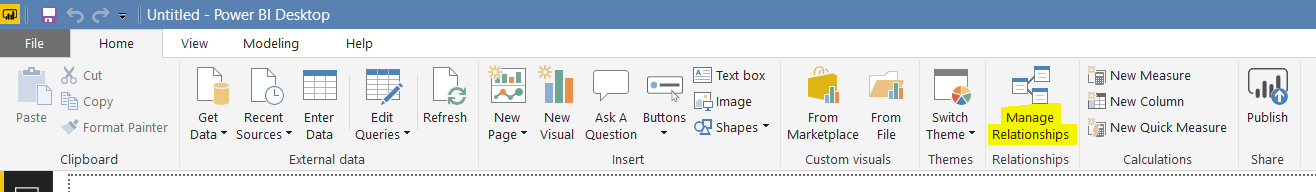
Once complete, we can define the relationships in the data so it links together. Select Manage Relationships:
You will see below. Click New:
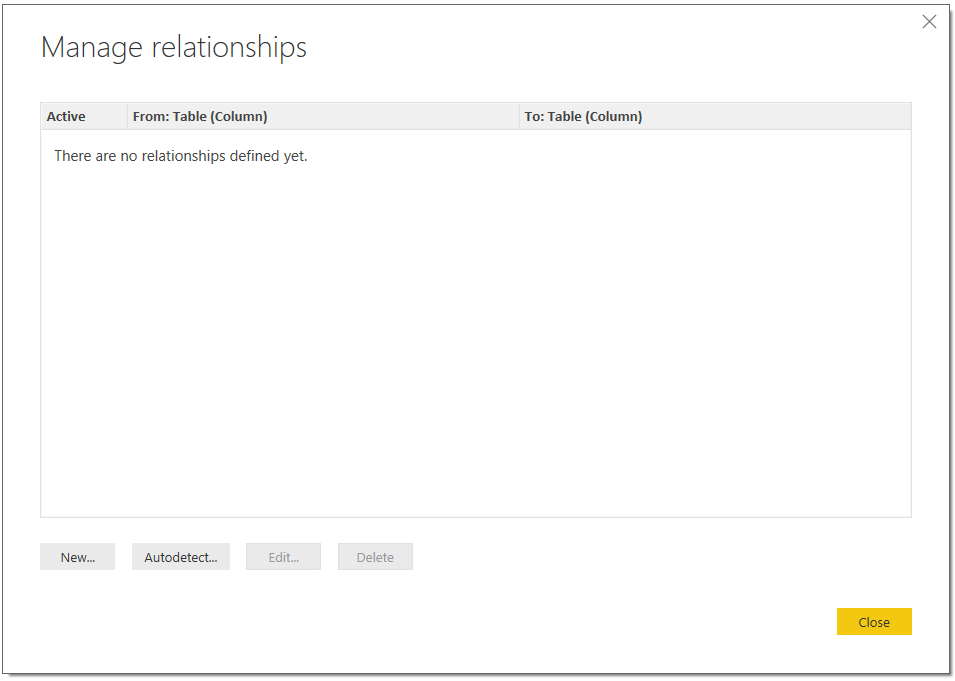
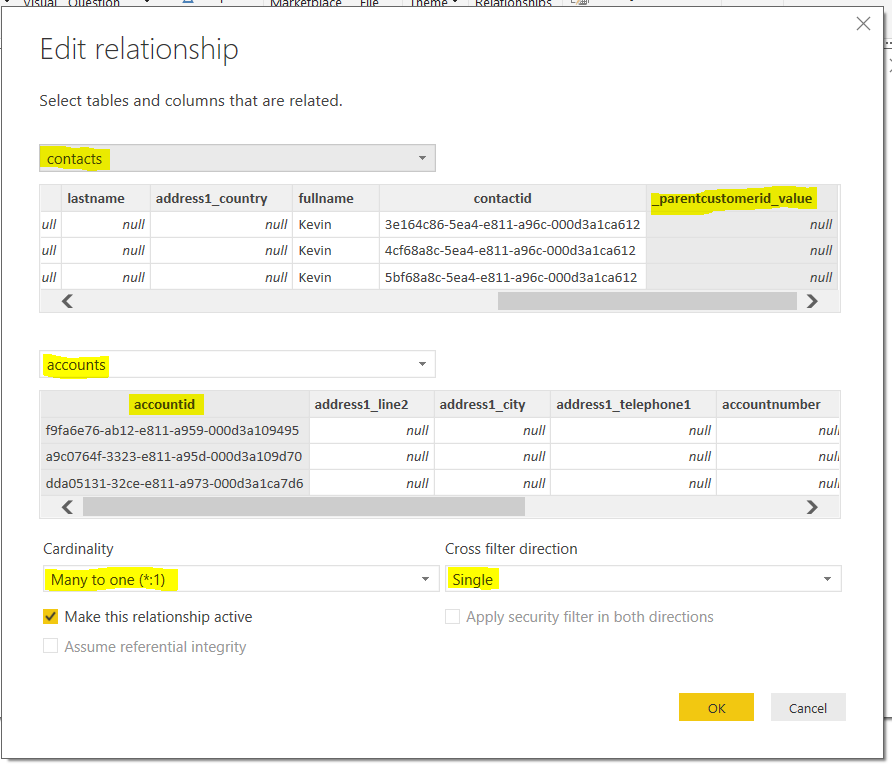
We will define a relationship between the contacts and accounts. These 2 data sets are linked by _parentcustomerid_value and accountid fields. Click OK:
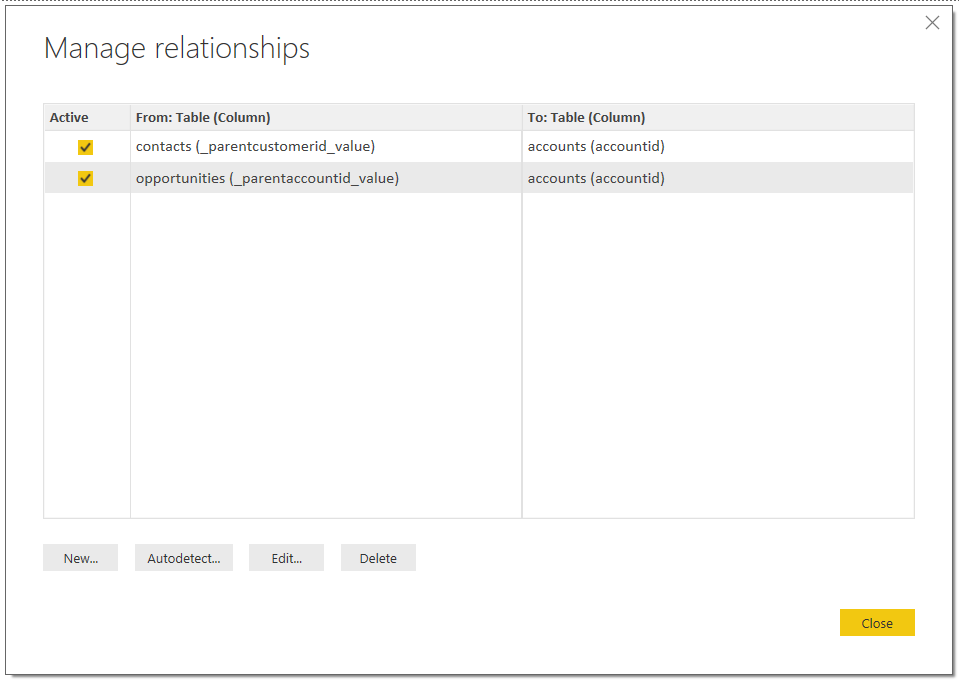
Once you have defined all relationships, you will see something below. Click Close:
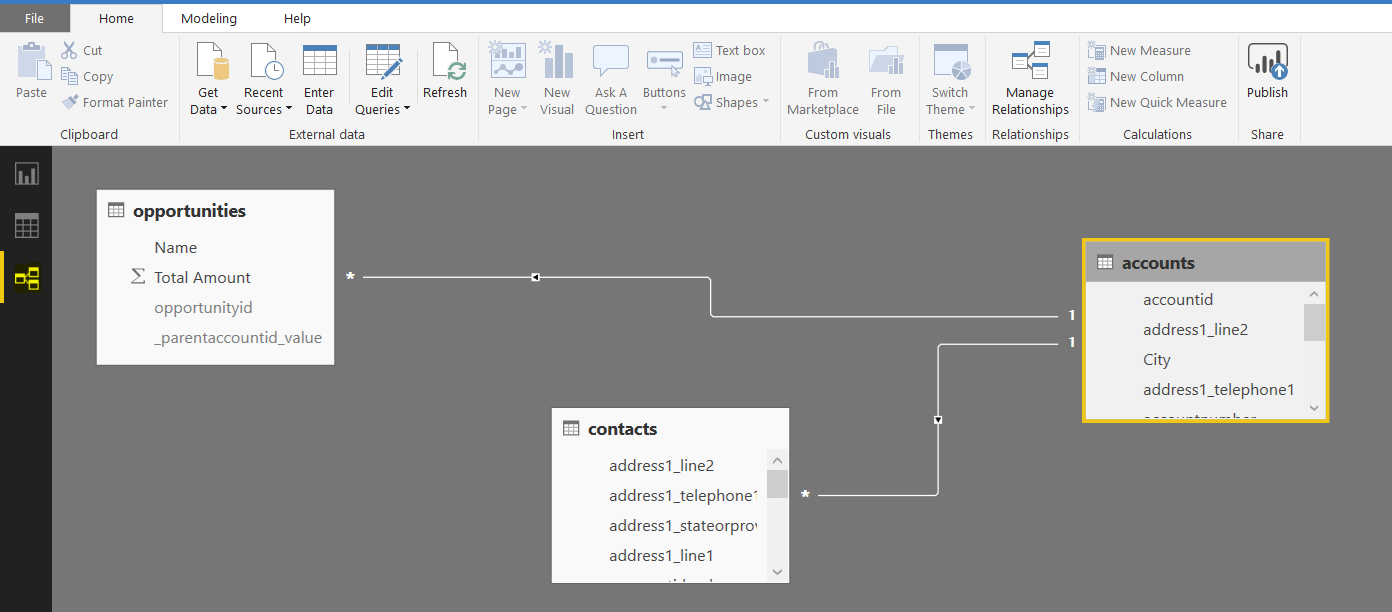
If you now click on the relationships icon, you will see the graphical view of how the data is connected:
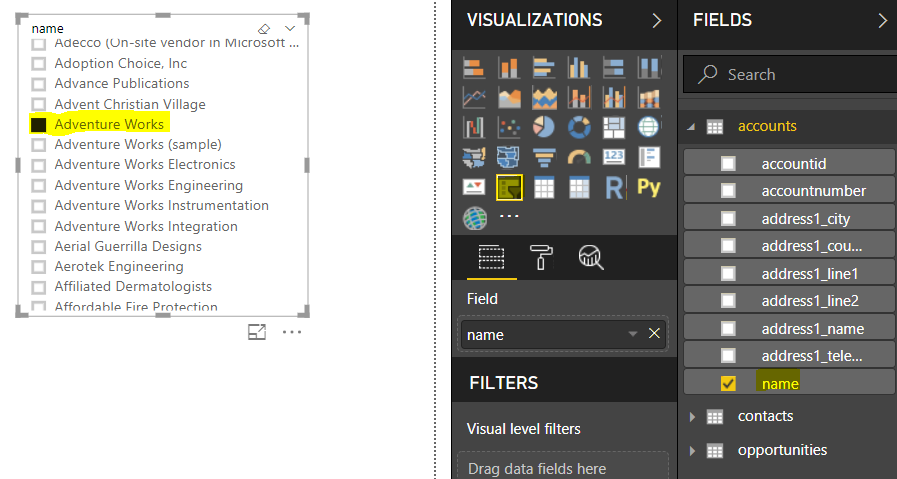
Now let’s drag some fields onto the canvas. Click on the name field under accounts. We will define this as a slicer, so the user can filter on any particular account:
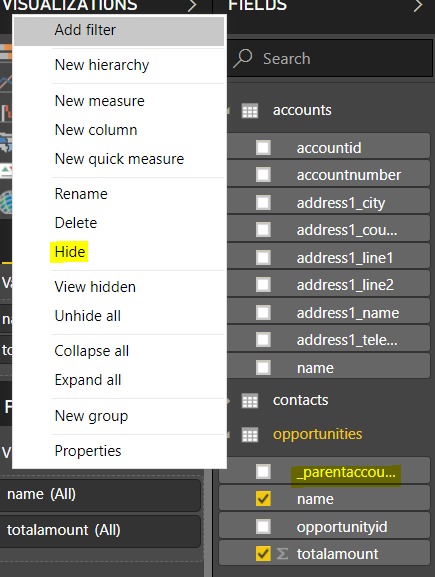
You will see all the fields from the data source here. We may want to hide fields that we will not use, such as the Id fields, for cosmetic and usability reasons, but this is up to you:
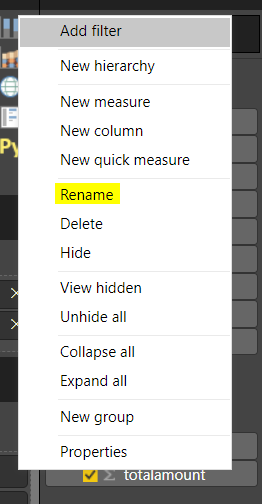
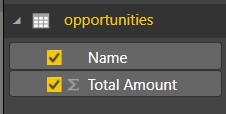
Next, notice the field names are using the Dynamics 365 names, such as totalamount. Let’s rename these to more readable names such as “Total Amount”:
Now, we will drag some additional data fields onto the report. You can see the data is being filtered here for the account selected. The opportunities and contacts displayed are only for the selected account due to the relationships we defined:
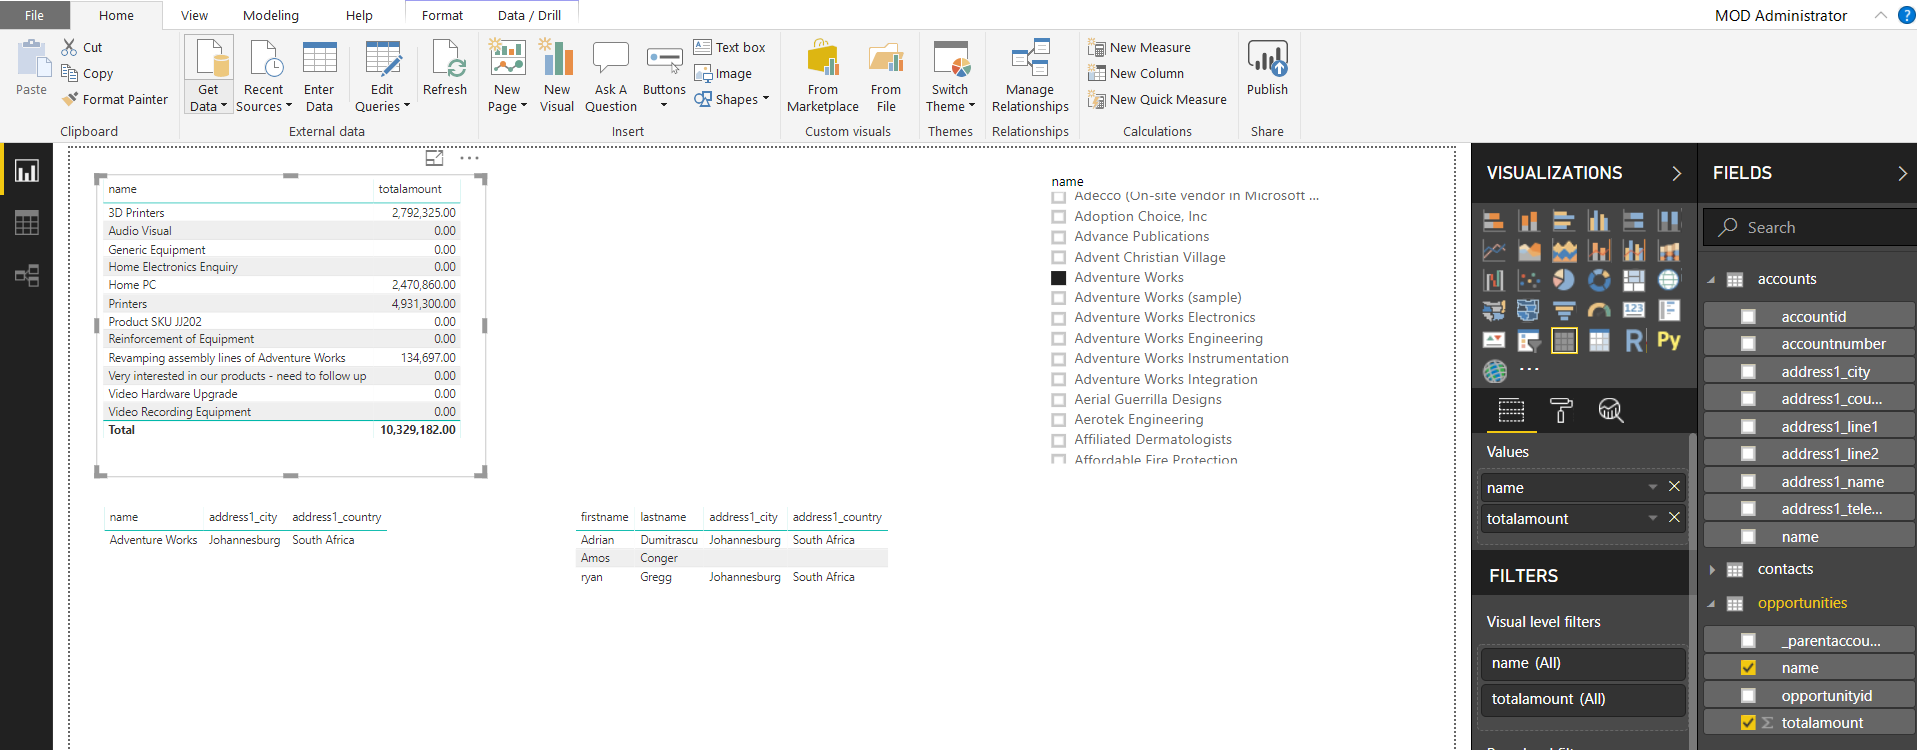
However, the report is simply showing numbers without any visualizations to bring the data out. Select Visualizations to create a better looking report:
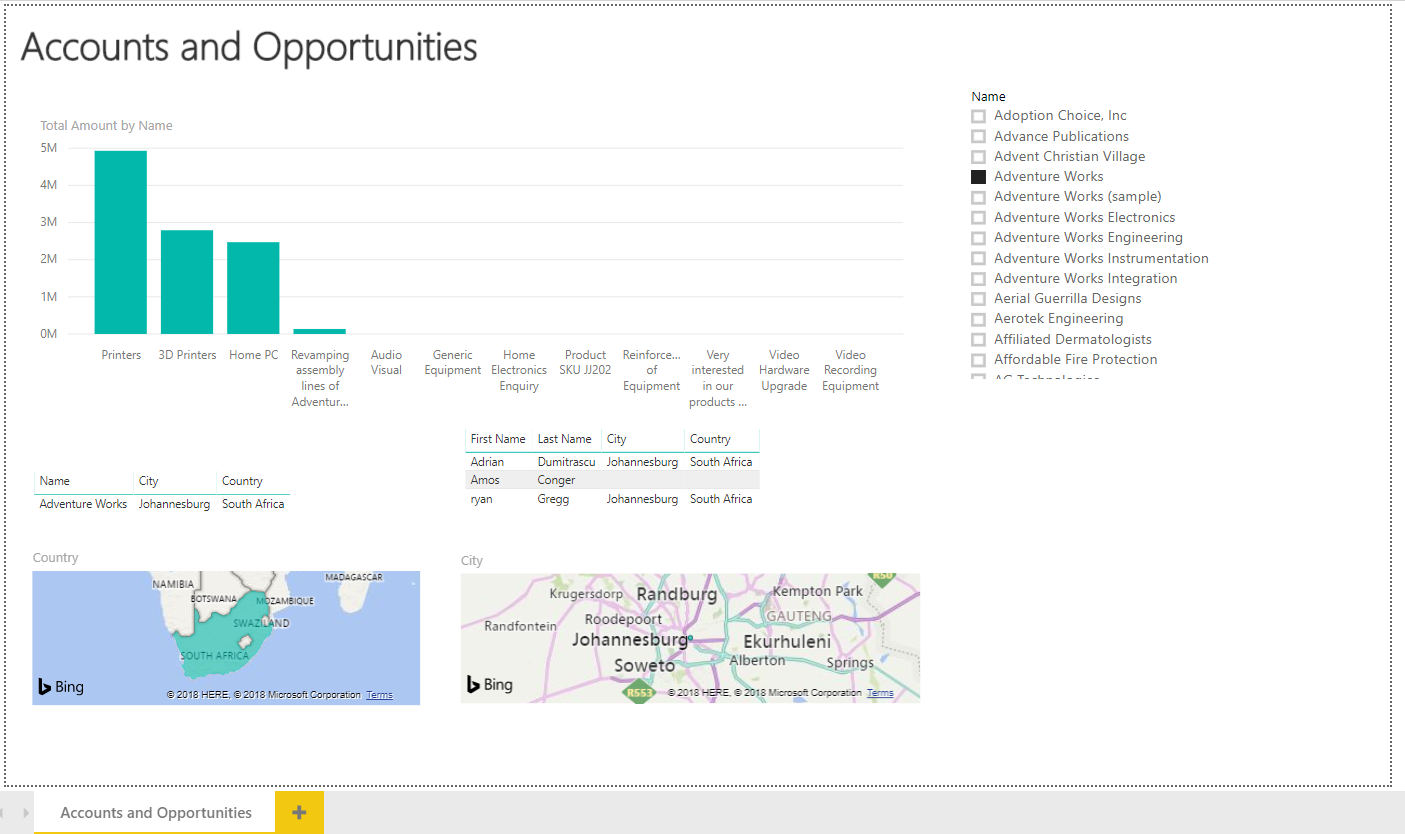
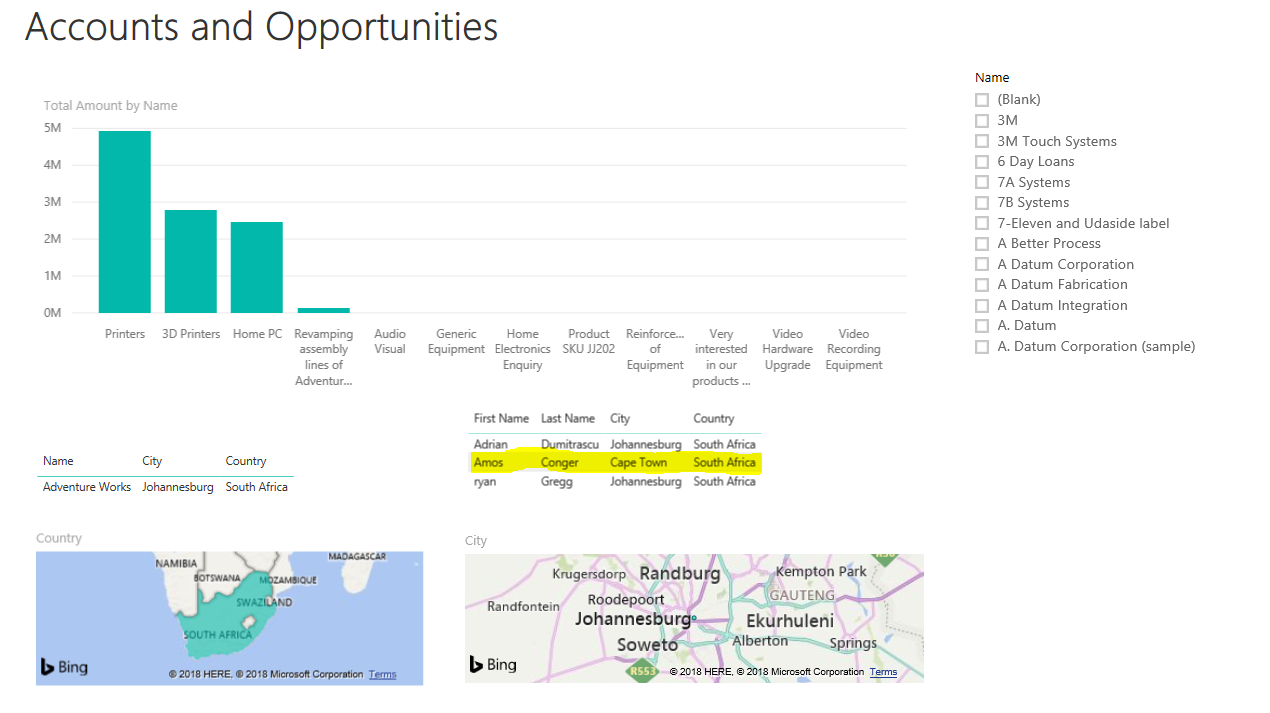
We now see visuals such as the total amount displayed in a bar chart, and the map view of the account location:
4. Publish the Report
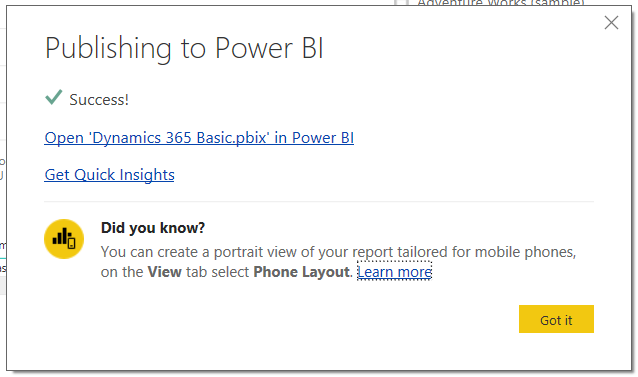
We can now publish the report to powerbi.com so it can be accessed anywhere and shared. Click Publish:

Once published you will see a message like below. Click to Open in powerbi.com:
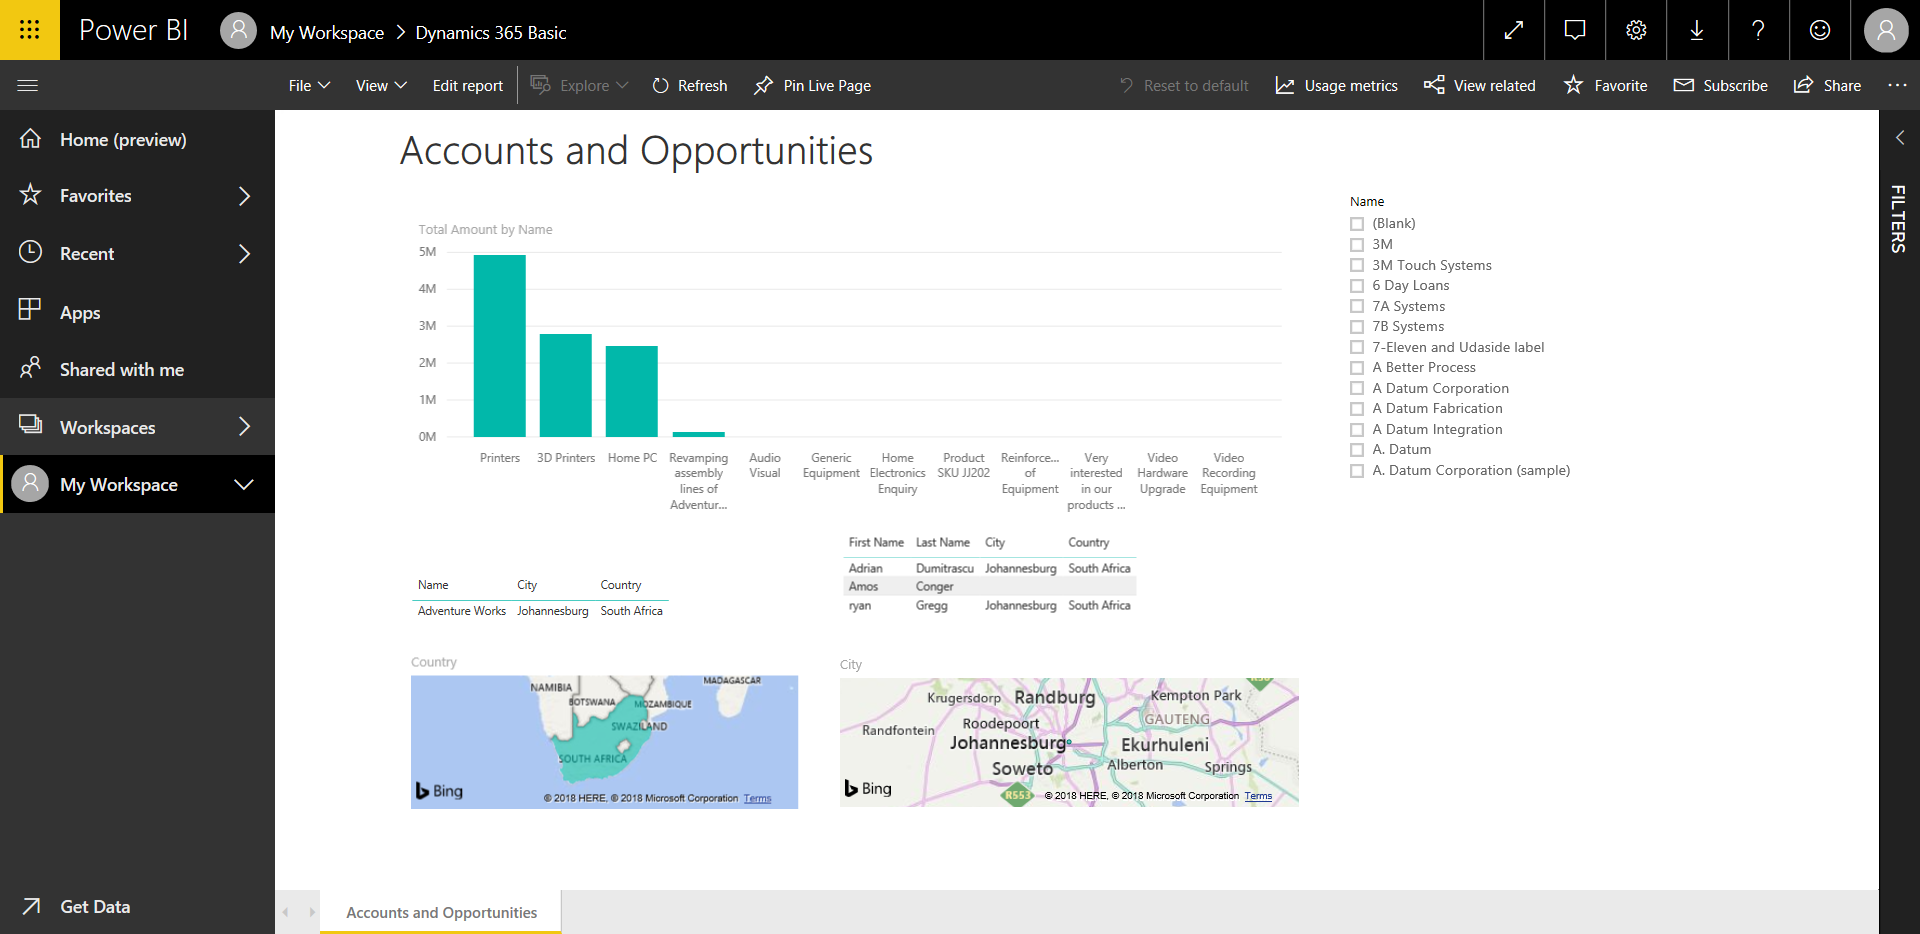
5. View and Share the Report in PowerBI.com
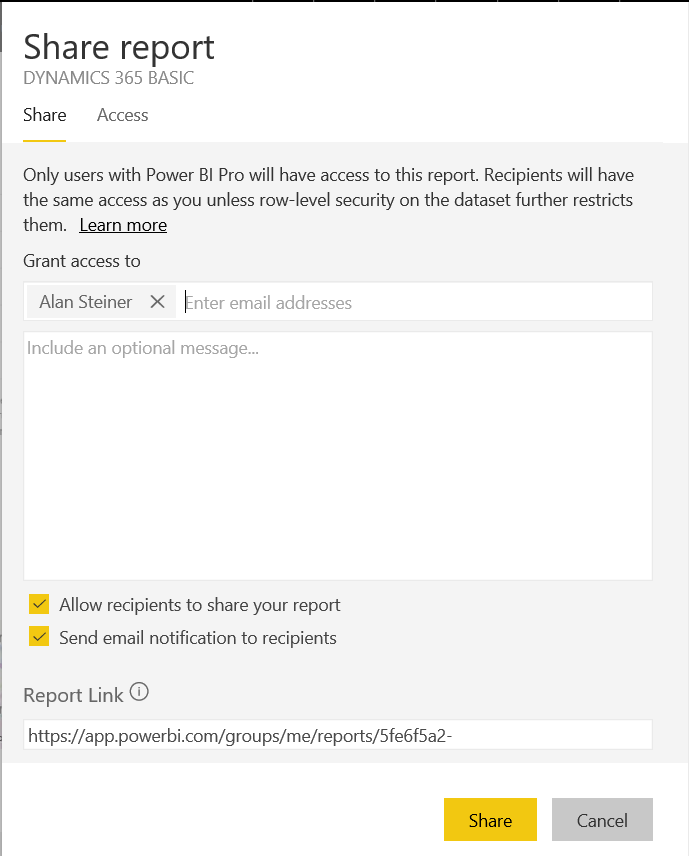
We can now see the report in the cloud! Let’s share it with a user. Click Share on the top right:
And enter a user to share it with:
6. Schedule Refresh to Update Data Automatically
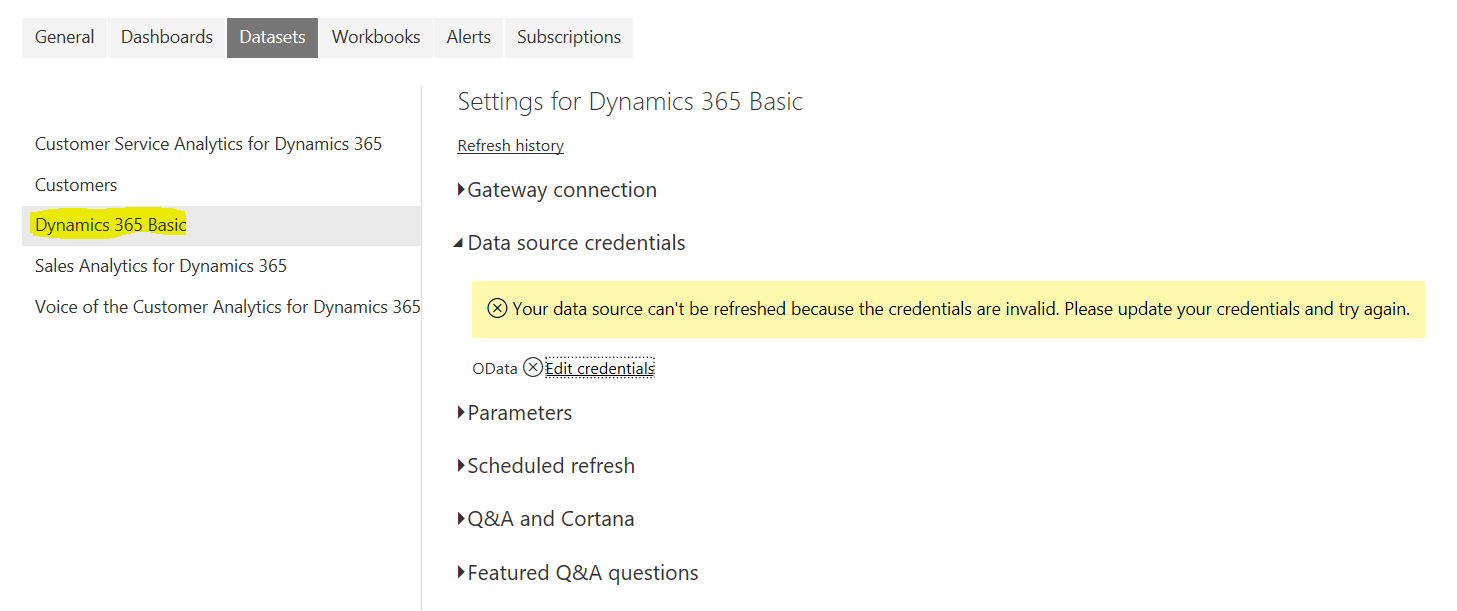
Now that our report is uploaded to the cloud and shared, we would like the data to be automatically refreshed. To do this, go to Settings and select the Dataset. Click Edit Credentials so powerbi.com will know how to connect to the data:
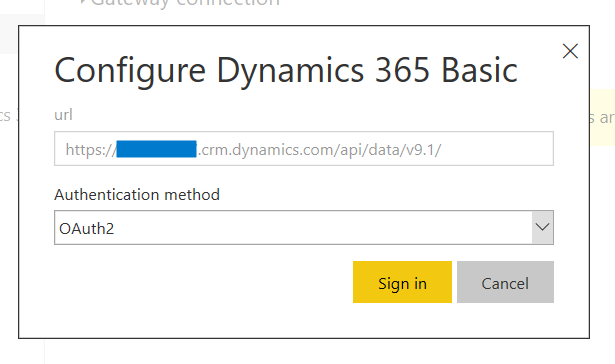
Select OAuth2:
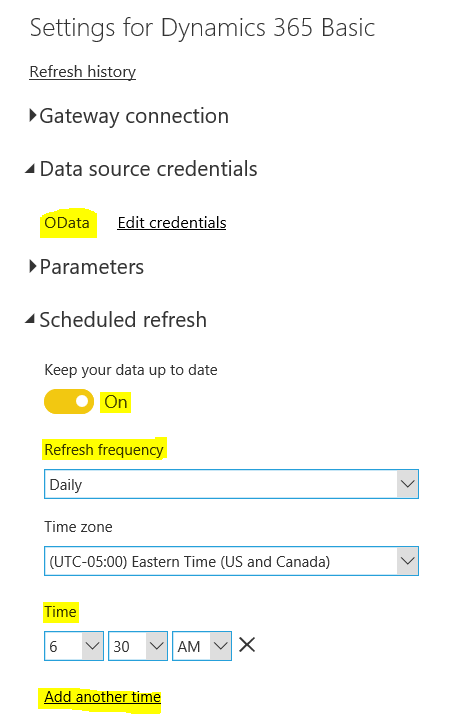
And now select Data source credentials. Turn on refresh and select a frequency and time:
Now in Dynamics 365, we will update a contact record and see this get automatically refreshed in Power BI:
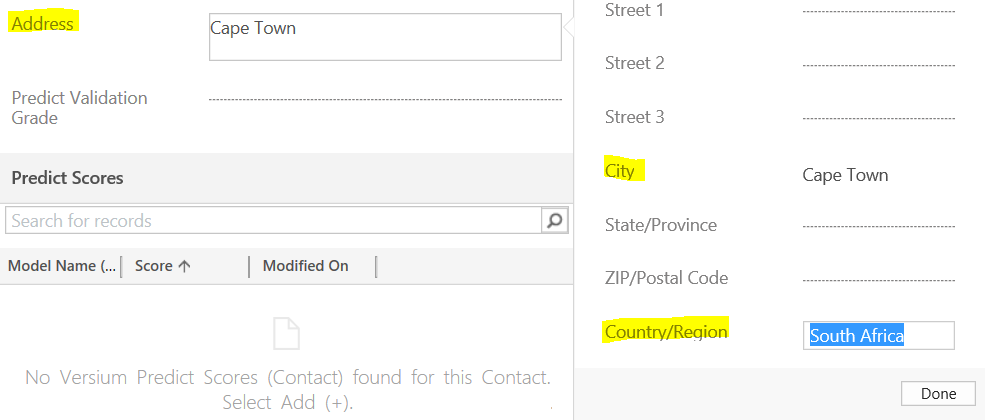
When the refresh time occurs, the data will be refreshed in powerbi.com. A user that accesses the report will then see the report with the latest data:
That’s it. You have built your first Power BI report that connects to Dynamics 365 data.
I AM SPENDING MORE TIME THESE DAYS CREATING YOUTUBE VIDEOS TO HELP PEOPLE LEARN THE MICROSOFT POWER PLATFORM.
IF YOU WOULD LIKE TO SEE HOW I BUILD APPS, OR FIND SOMETHING USEFUL READING MY BLOG, I WOULD REALLY APPRECIATE YOU SUBSCRIBING TO MY YOUTUBE CHANNEL.
THANK YOU, AND LET'S KEEP LEARNING TOGETHER.
CARL

Could you please help me and tell me how do we give permission to “optionset” entity and how do we read it? It looks like the Web API doesn’t support it.