One method to troubleshoot SQL Server Deadlocks is to use the SQL Profiler.
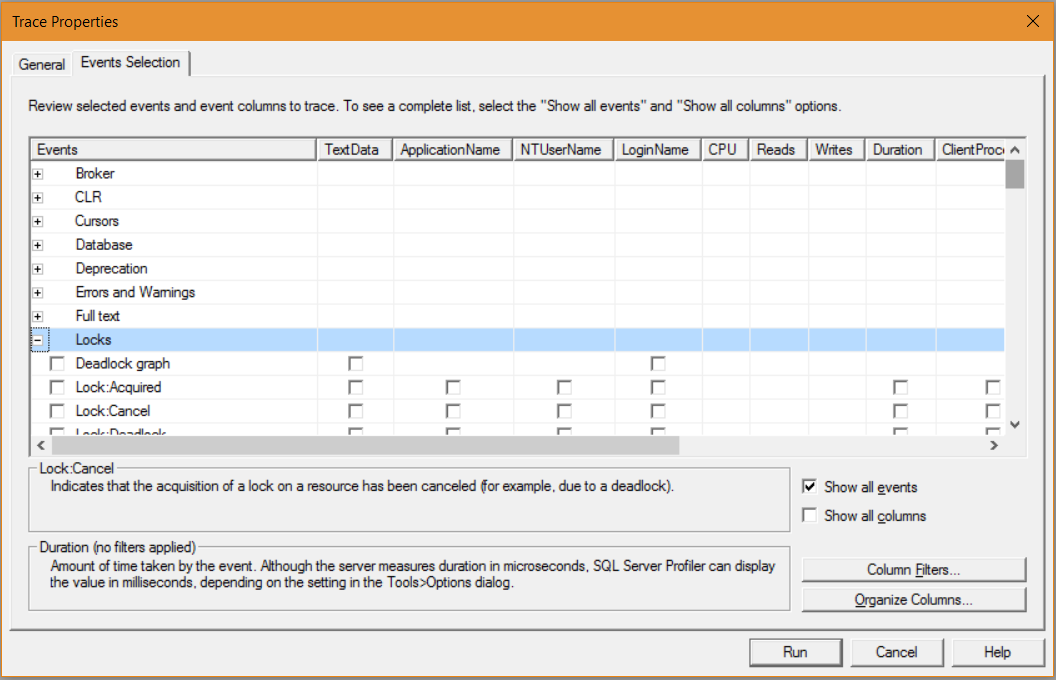
In SQL Profiler, in a new trace, select the Events Selection tab and expand Locks:
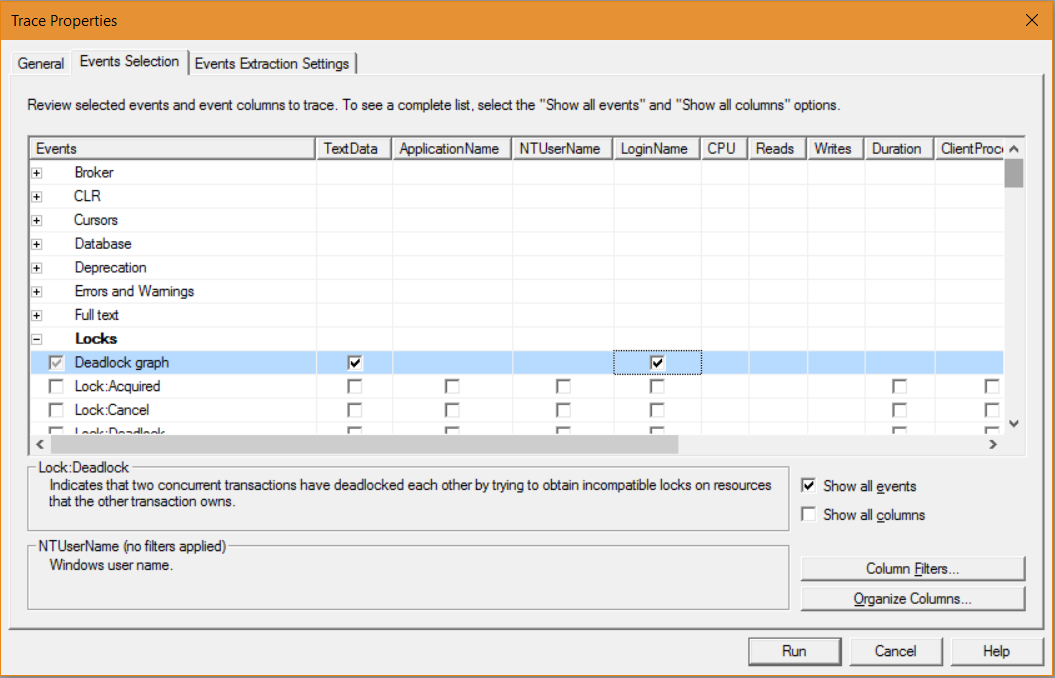
Select the Deadlock graph:
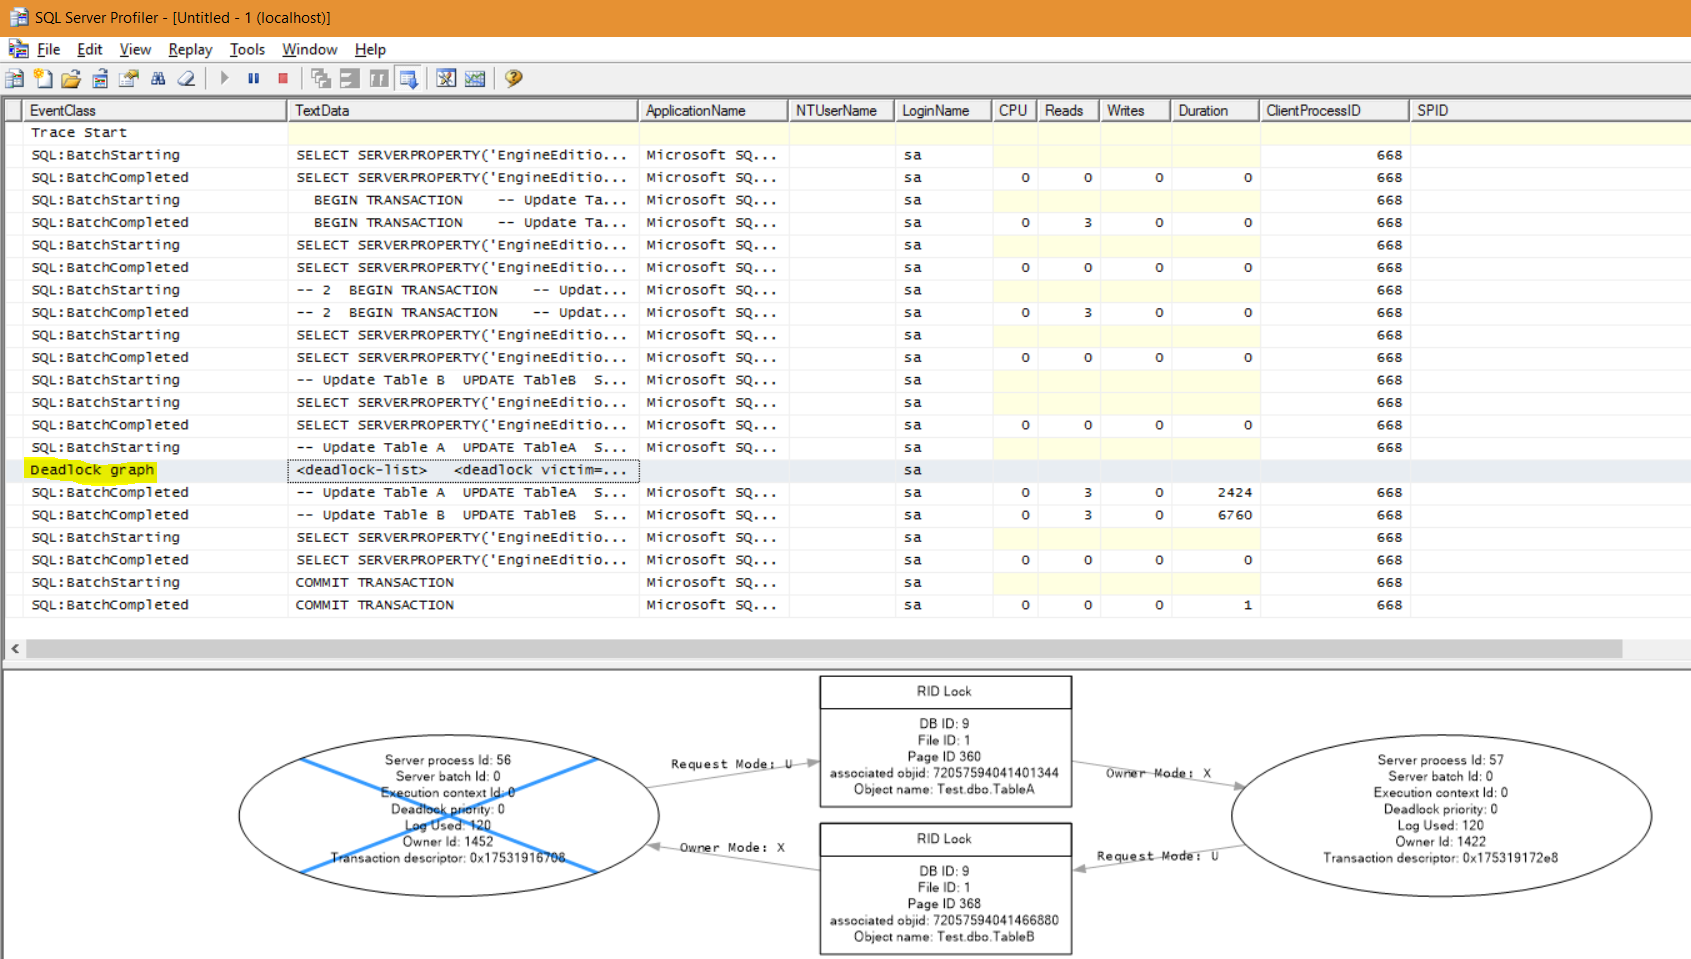
Run the code that causes a deadlock. In profiler, you will now see a line for the Deadlock graph. Selecting it will show the graph with the process that succeeded and did not succeed:
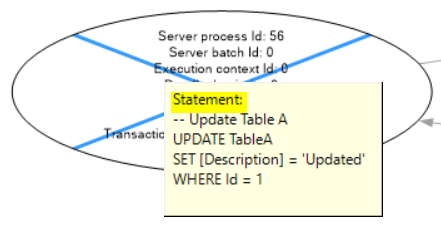
Hovering over the graph shows the SQL trying to be executed:

Keep learning. Keep building.
Explore AI, agents & Microsoft technology.
I share practical ideas, tutorials, and videos about AI, AI agents, Microsoft technologies, and the Power Platform.
Subscribe on YouTube →Carl de Souza Enterprise Architect at Microsoft · AI Technology Expert