There are a few ways to troubleshoot errors from deadlocks in SQL Server. One of these ways is to use tracing.
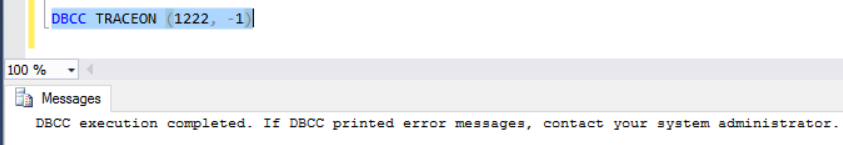
First, turn on tracing using the command (a Database Console Command):
DBCC TRACEON (1222, -1)
You should see:
Now, wait for a deadlock in SQL Server to occur. Once it occurs, you can run the following command to read the error log:
exec sp_readerrorlog
Scroll to look for the word “deadlock -list” in the Text column. From this point on, you will see deadlock information:
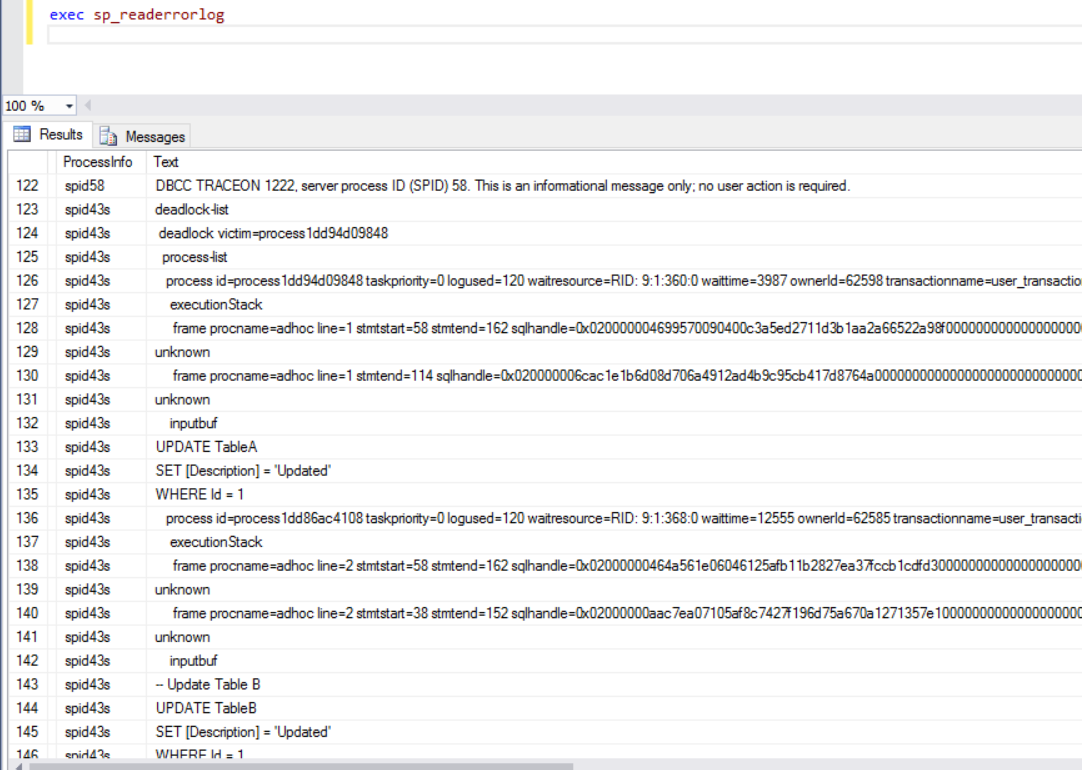
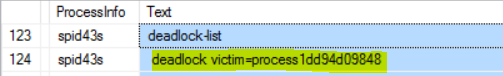
You can see the deadlock victim’s process id is listed below:
Next is the process list section. You can see this lists the processes related to the deadlock. There are two listed below, and the first one was chosen as the victim based on above.
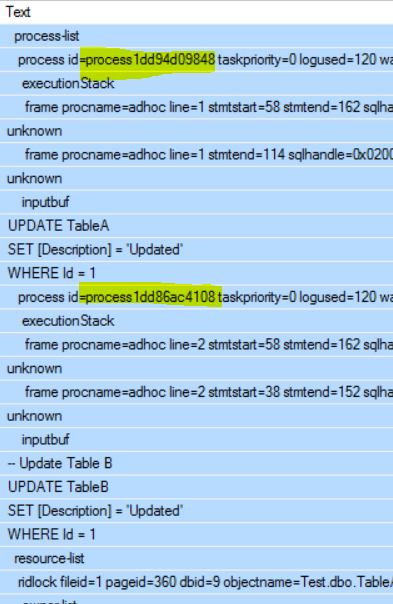
Within the execution stack is the procedure name, in this case it was an ad-hoc query:
![]()
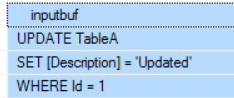
The Input Buffer tells us which code was excuting:
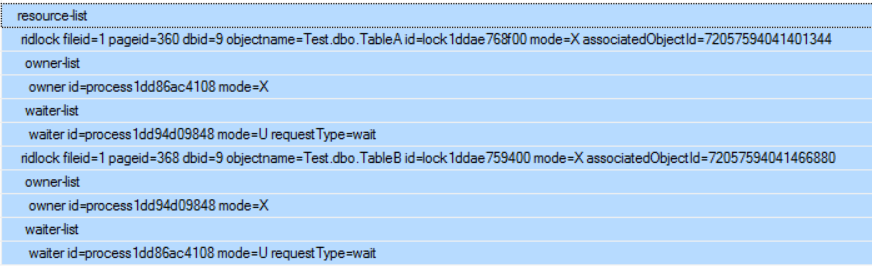
From the resource list, we can see the owner process, and the waiter process, i.e. which one has the exclusive lock, and which one is waiting for an exclusive lock.
This is one method to help troubleshooting SQL Server deadlocks.
I AM SPENDING MORE TIME THESE DAYS CREATING YOUTUBE VIDEOS TO HELP PEOPLE LEARN THE MICROSOFT POWER PLATFORM.
IF YOU WOULD LIKE TO SEE HOW I BUILD APPS, OR FIND SOMETHING USEFUL READING MY BLOG, I WOULD REALLY APPRECIATE YOU SUBSCRIBING TO MY YOUTUBE CHANNEL.
THANK YOU, AND LET'S KEEP LEARNING TOGETHER.
CARL
