When analyzing and troubleshooting network traces in browsers such as Edge, Chome, Firefox, and IE, you can export these and import them into Fiddler for further analysis.
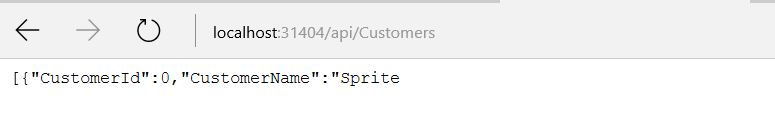
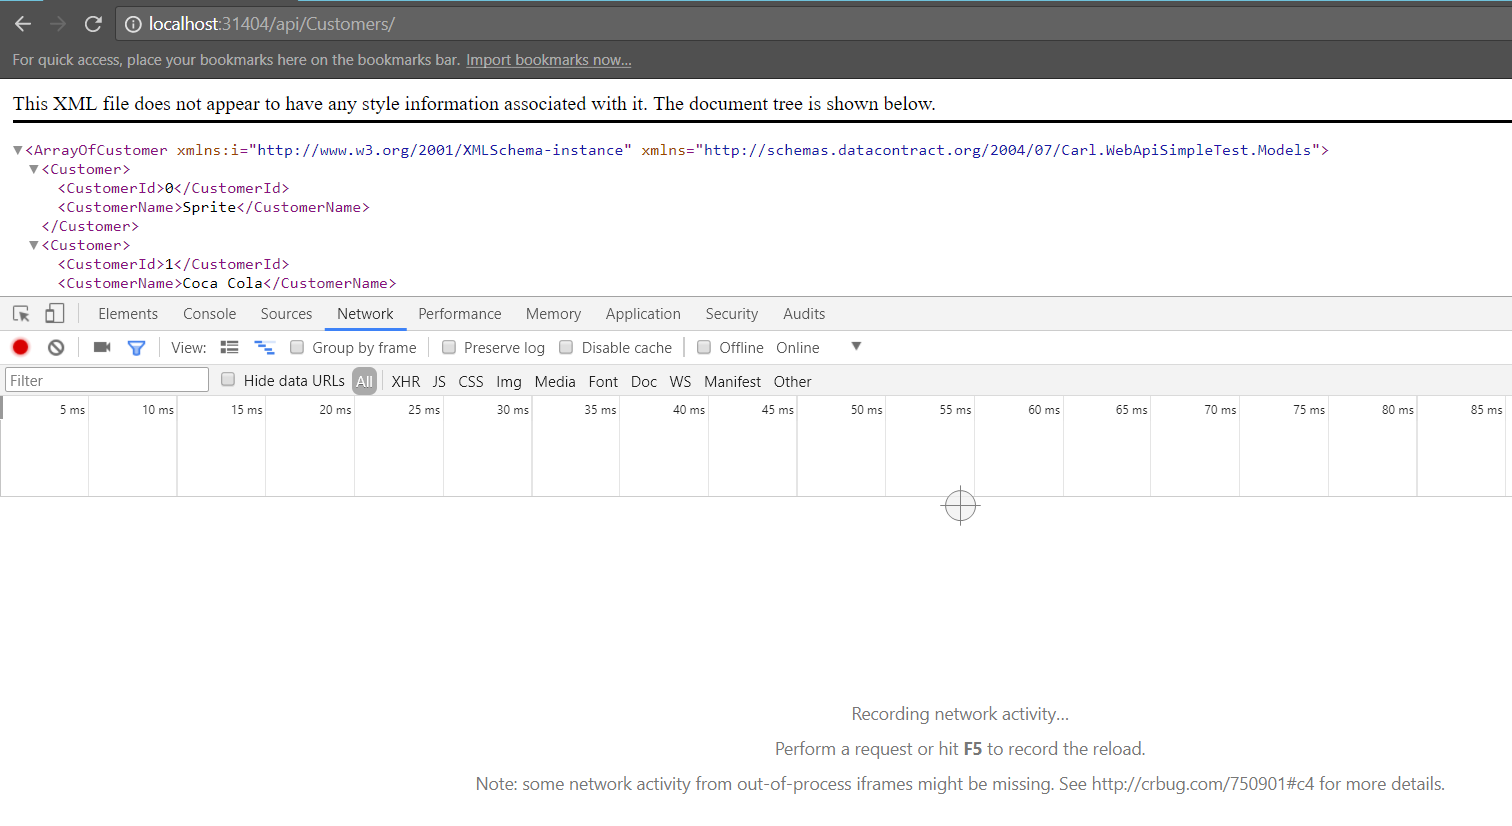
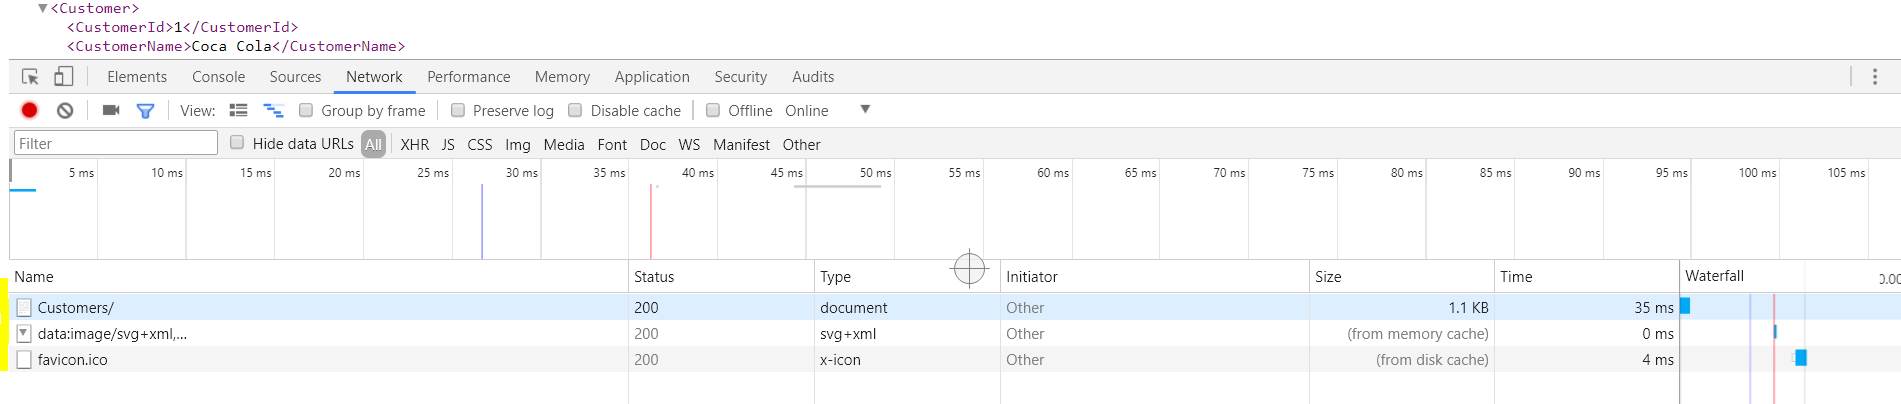
For example, let’s say you are working in Edge and are analyzing a REST API. You send a request through your browser to the API, that returns a list of customers:
If you click F12 to open Developer Tools, you can see the request that was sent:
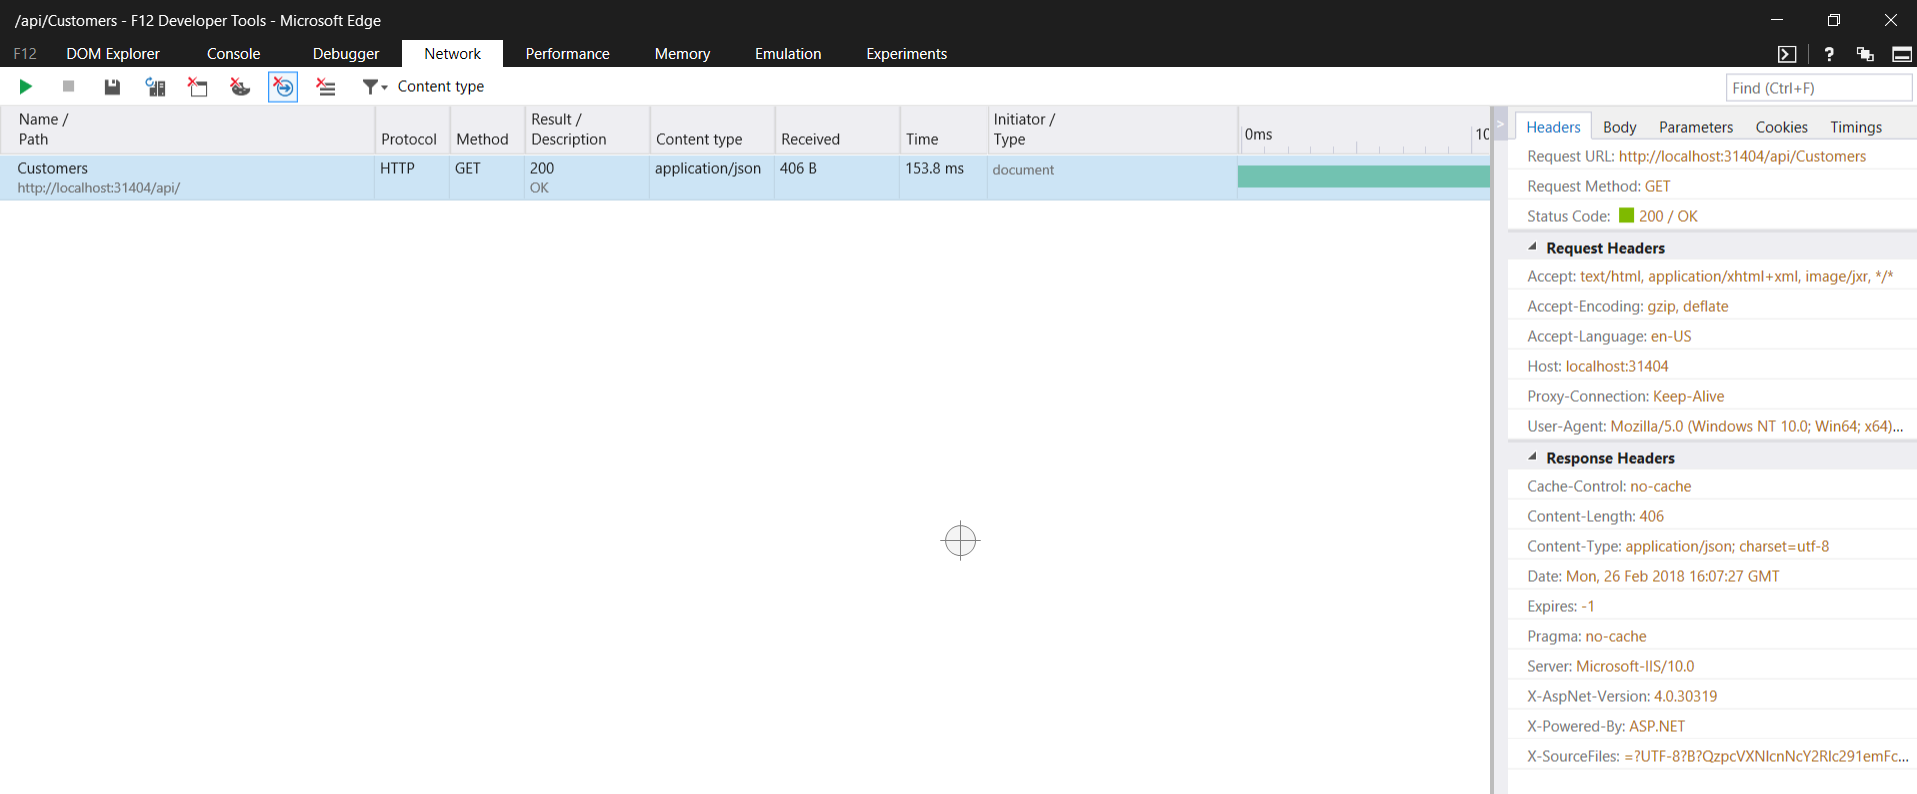
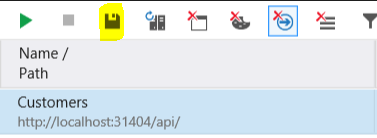
From here, you can click the Save button:
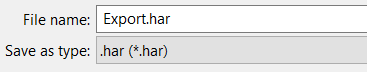
And save the export as a .HAR file (HTTP Archive):
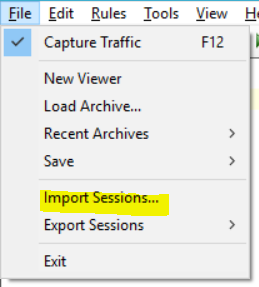
Now in Fiddler, select Import Sessions:
Select the Import format as HTTPArchive:
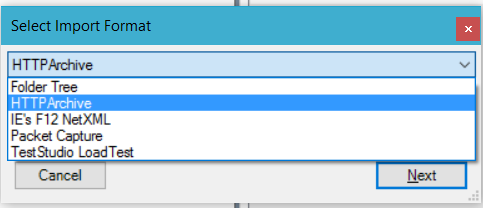
Click Next and select the Export.har file from above.
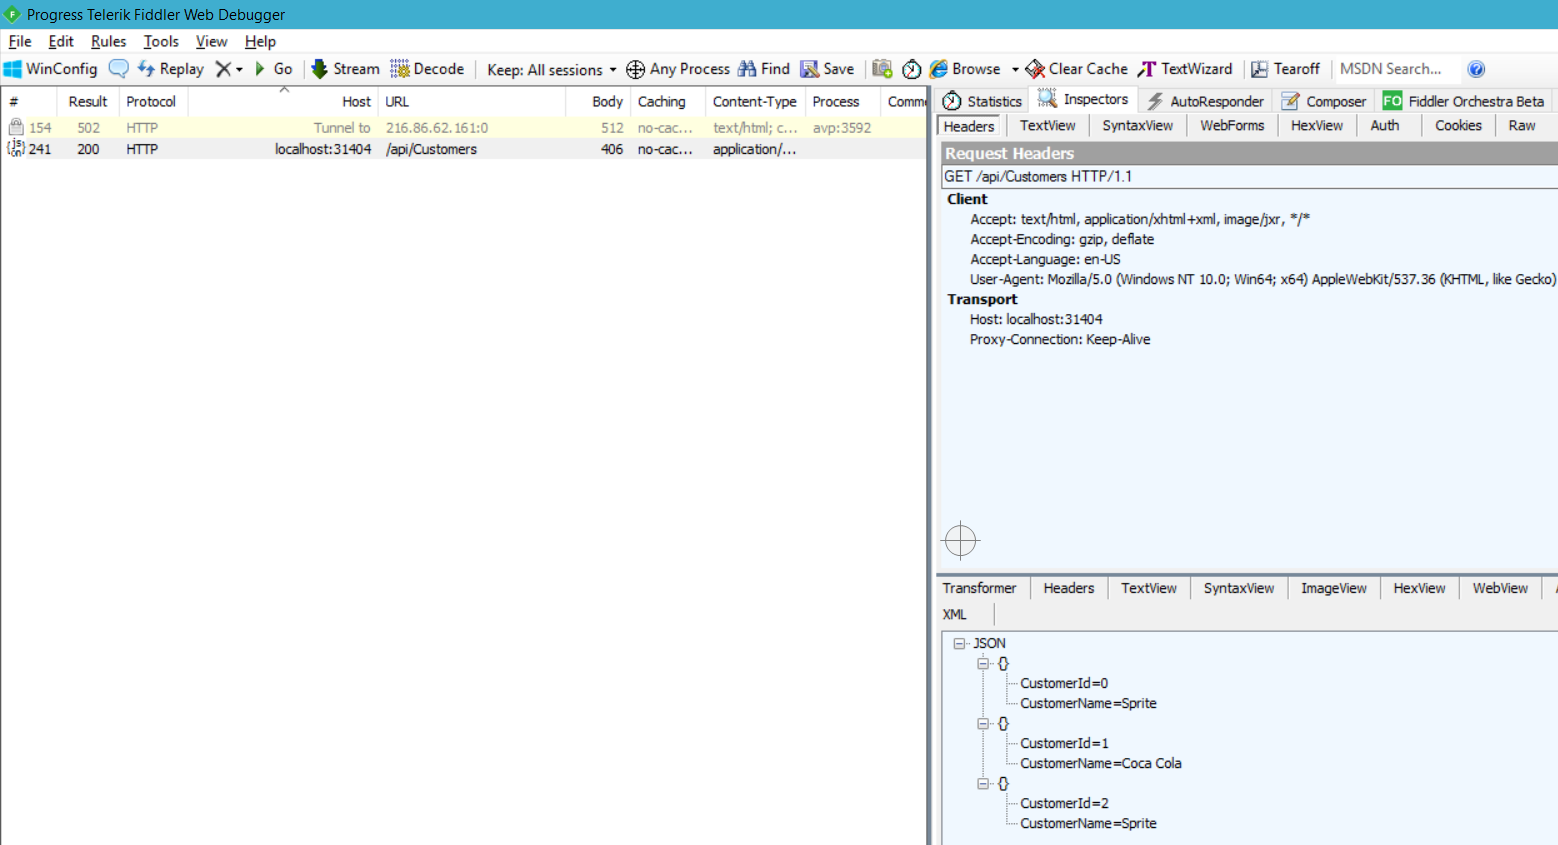
You can now see the network trace in Fiddler:
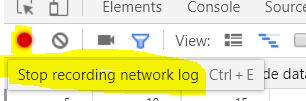
To do this with Chrome, go to the page you would like to analyze and select F12, then Refresh:
The network trace will run:
Click Stop Recording:
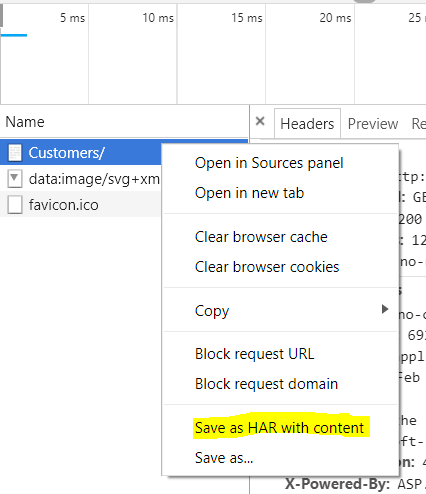
Right click a line and select Save as HAR with content:
Import as above.
I AM SPENDING MORE TIME THESE DAYS CREATING YOUTUBE VIDEOS TO HELP PEOPLE LEARN THE MICROSOFT POWER PLATFORM.
IF YOU WOULD LIKE TO SEE HOW I BUILD APPS, OR FIND SOMETHING USEFUL READING MY BLOG, I WOULD REALLY APPRECIATE YOU SUBSCRIBING TO MY YOUTUBE CHANNEL.
THANK YOU, AND LET'S KEEP LEARNING TOGETHER.
CARL
