In the previous posts, we installed R for Windows and RStudio as an IDE for R. Both are configured to work with Power BI. In this post, we will run an R Visualization from the Power BI marketplace.
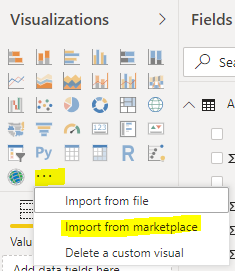
In Power BI Desktop, under Visualizations select Import from Marketplace:
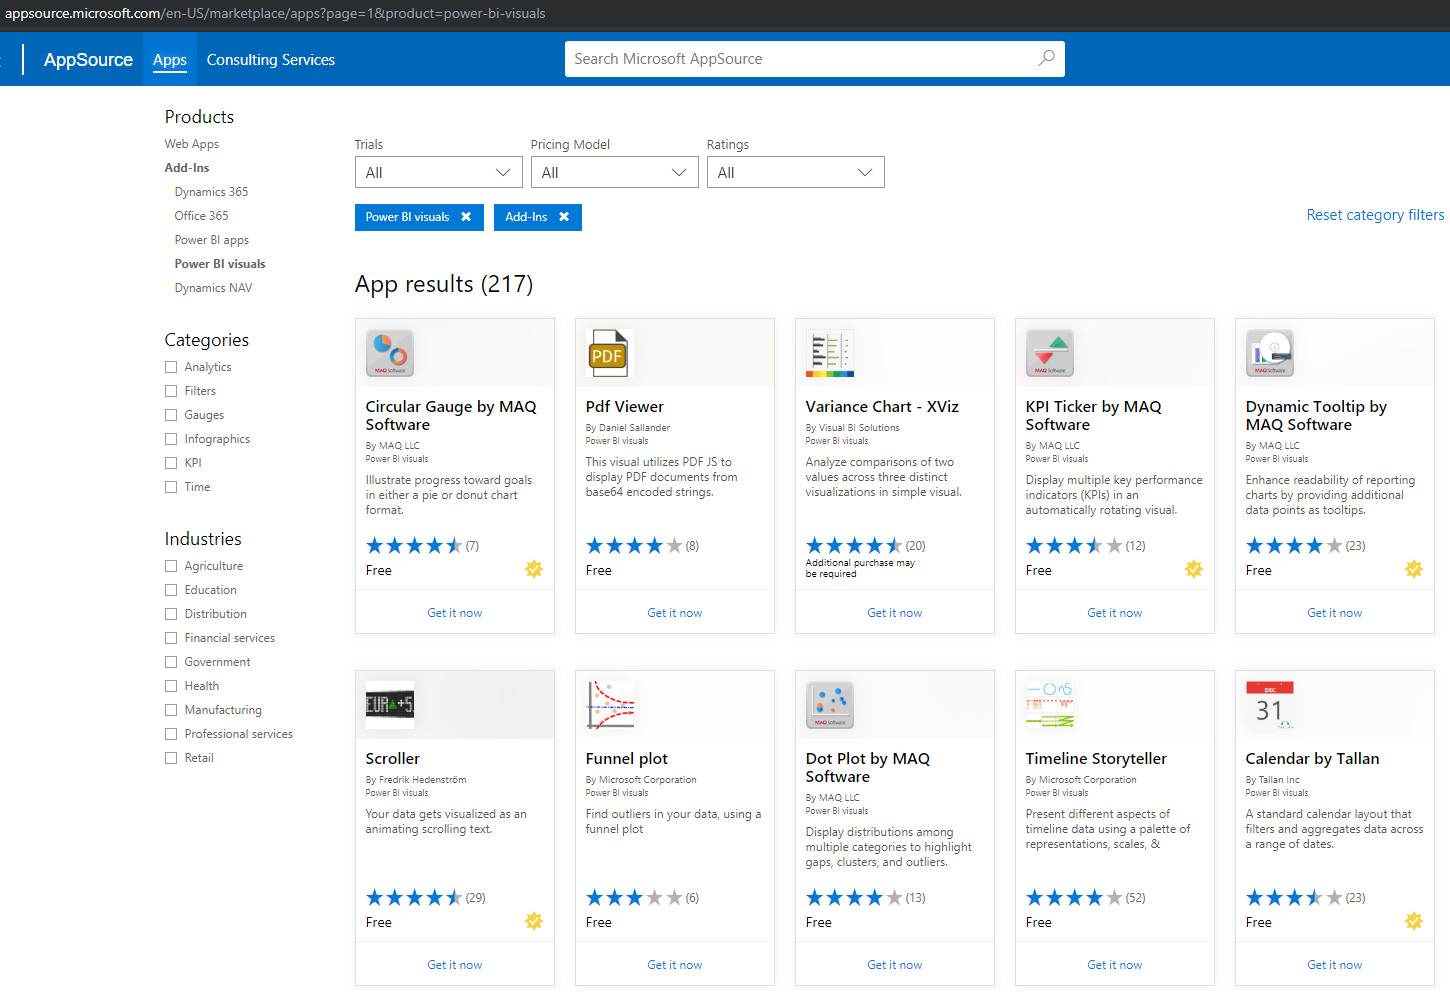
Note you can see these visualizations from AppSource at https://appsource.microsoft.com/en-US/marketplace/apps?page=1&product=power-bi-visuals:
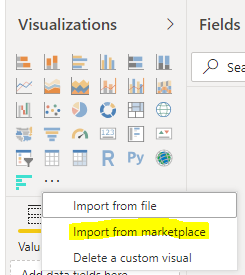
Let’s install the Outlier Detection visualization from Microsoft. In Power BI Desktop, select Import from Marketplace:
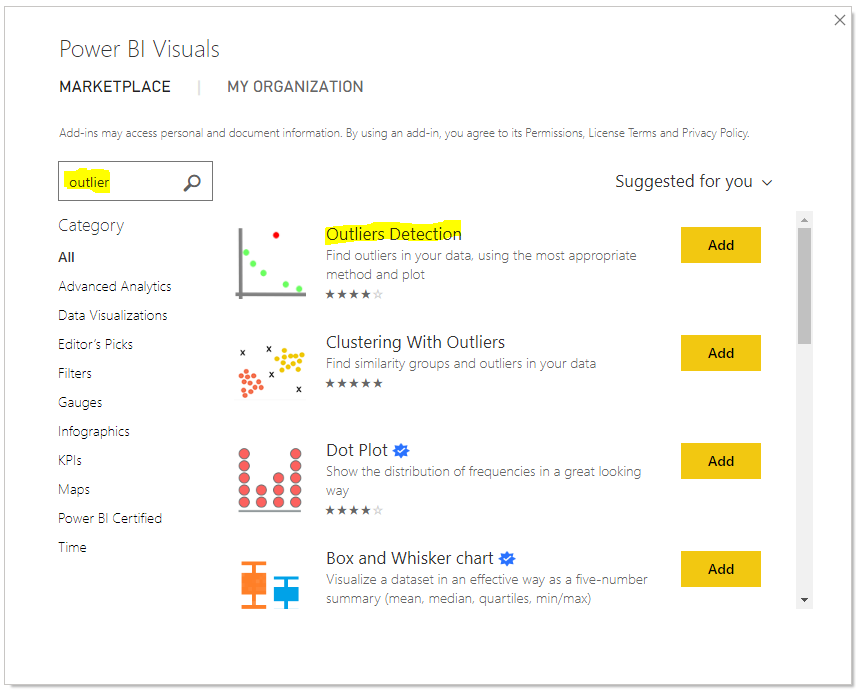
Find the Outliers Detection visualization:
The new visual will be installed:
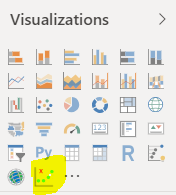
Click the Icon to add it to the canvas:
![]()
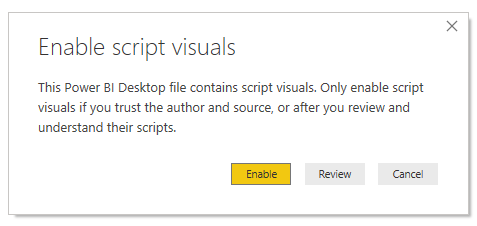
You will see the message. Click Enable:
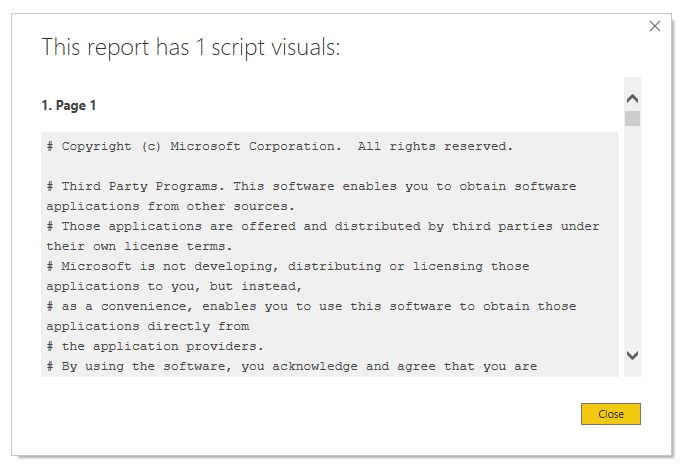
Clicking Review, we can see more details about the R script:
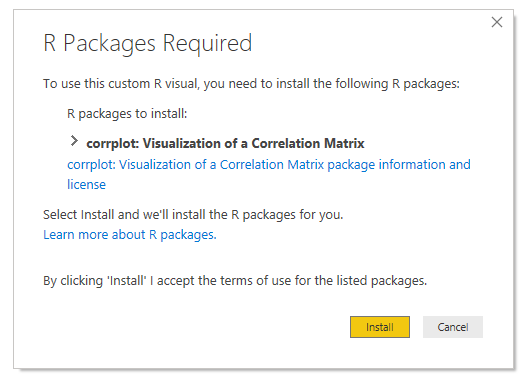
Click Install. Note on clicking Install, you may be prompted to install any R packages, which looks something like below from a different package install:
Once installed, you can use the visualization by clicking on the new icon and adding fields:
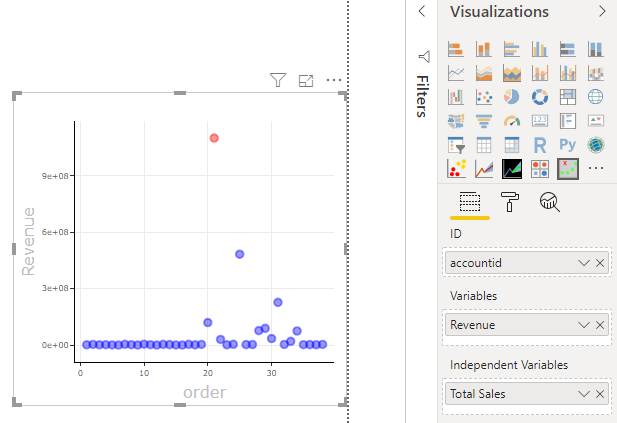
You are now using R visualizations from the marketplace in Power BI. Next, let’s look at how to use the R Visualization in Power BI Desktop.
I AM SPENDING MORE TIME THESE DAYS CREATING YOUTUBE VIDEOS TO HELP PEOPLE LEARN THE MICROSOFT POWER PLATFORM.
IF YOU WOULD LIKE TO SEE HOW I BUILD APPS, OR FIND SOMETHING USEFUL READING MY BLOG, I WOULD REALLY APPRECIATE YOU SUBSCRIBING TO MY YOUTUBE CHANNEL.
THANK YOU, AND LET'S KEEP LEARNING TOGETHER.
CARL
