It’s almost time for Super Bowl 50, and I thought it would be timely to show how Power BI can be used to help analyze the game of American Football!
As we get closer to the big day, sports analysts are showing different ways to look at the myriad of data at their disposal. Sports news websites and TV shows frequently display line charts, bar charts, donut charts and numbers as a way to convince the audience which factors will influence the outcome of the game. Sound familiar? We do the same thing in business.
Power BI lends itself well to analyzing all kinds of data, including sports data. Today I will show you how to use Power BI to help with your football analysis and predictions.
The Power Football League
Instead of using real football teams and stats, I created a fictional dataset to show you how to dig into your own football data. Be sure to check out the terms and conditions of any websites before connecting to their data.
The fictional Power Football League is finishing its 2015/2016 season. Two teams have made it to the final game, known as the Power Bowl. These teams are The Indigos and The Cyans. The Indigos are led by star quarterback Johnny “Real-Time” Dimension, and The Cyans are led by their quarterback Joe “Mobile” Metrics.
The Data
Stats have been compiled all season. Just like the real world, data is coming from many different data sources. Websites have been publishing different kinds of football data, and spreadsheets are being used to track everything. We will want to use all of this data collectively and be able to relate it together.
This data includes:
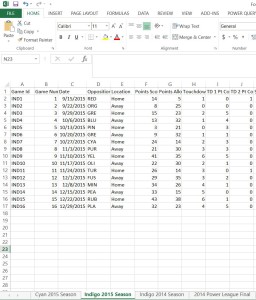
- All 16 Indigos and Cyans games in the season with final score, offense and defense stats. Individual game data, such as drives, yardage, interceptions etc. Comparison data, such as what happened the last time these 2 quarterbacks met. This is all stored in a spreadsheet
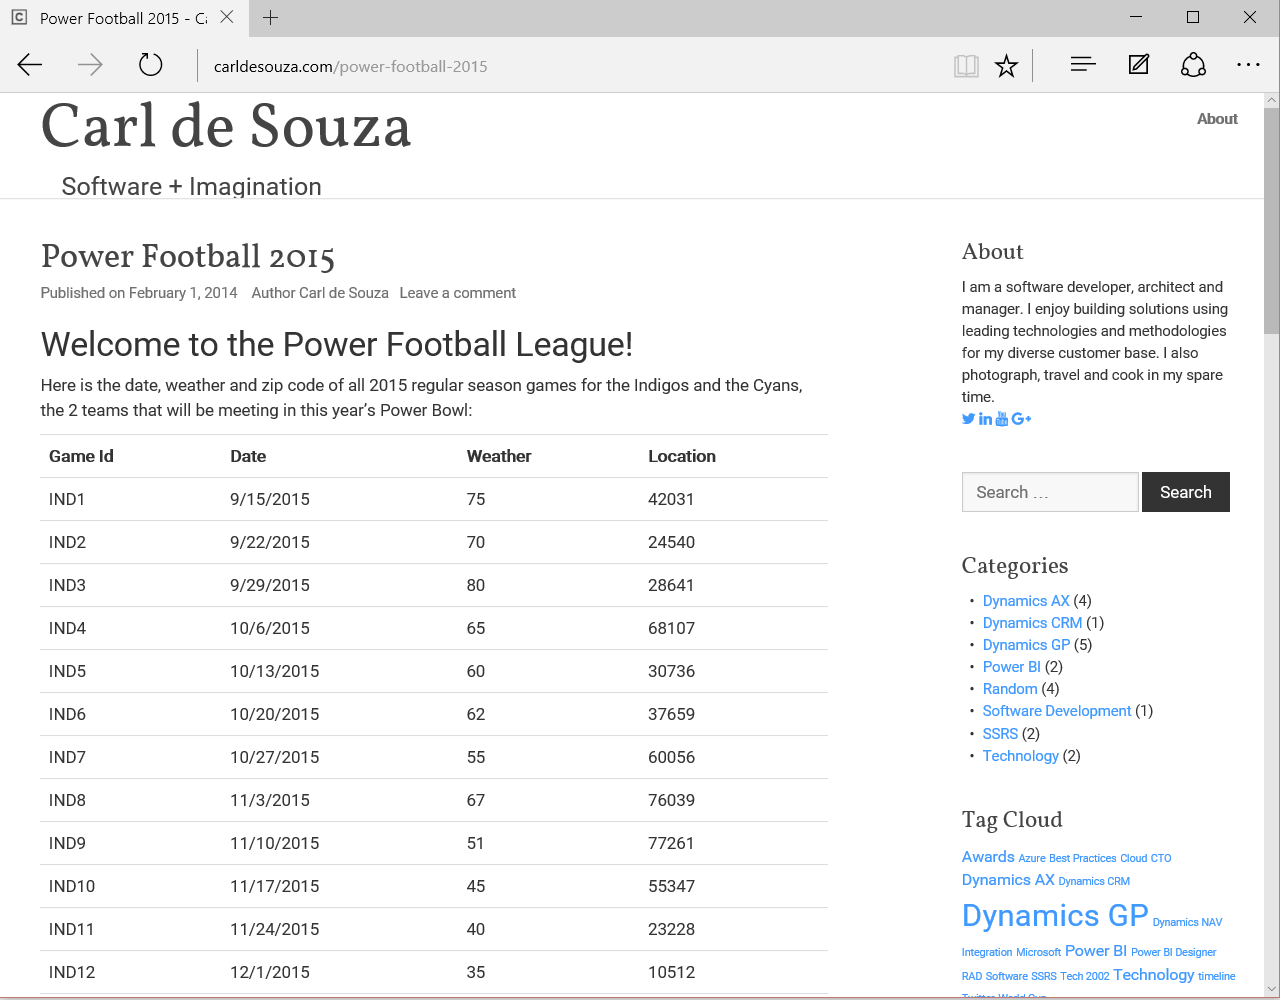
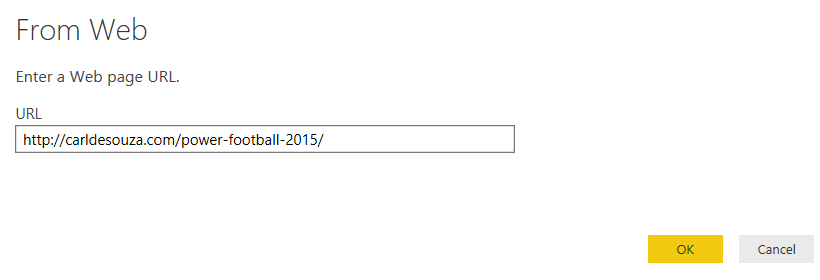
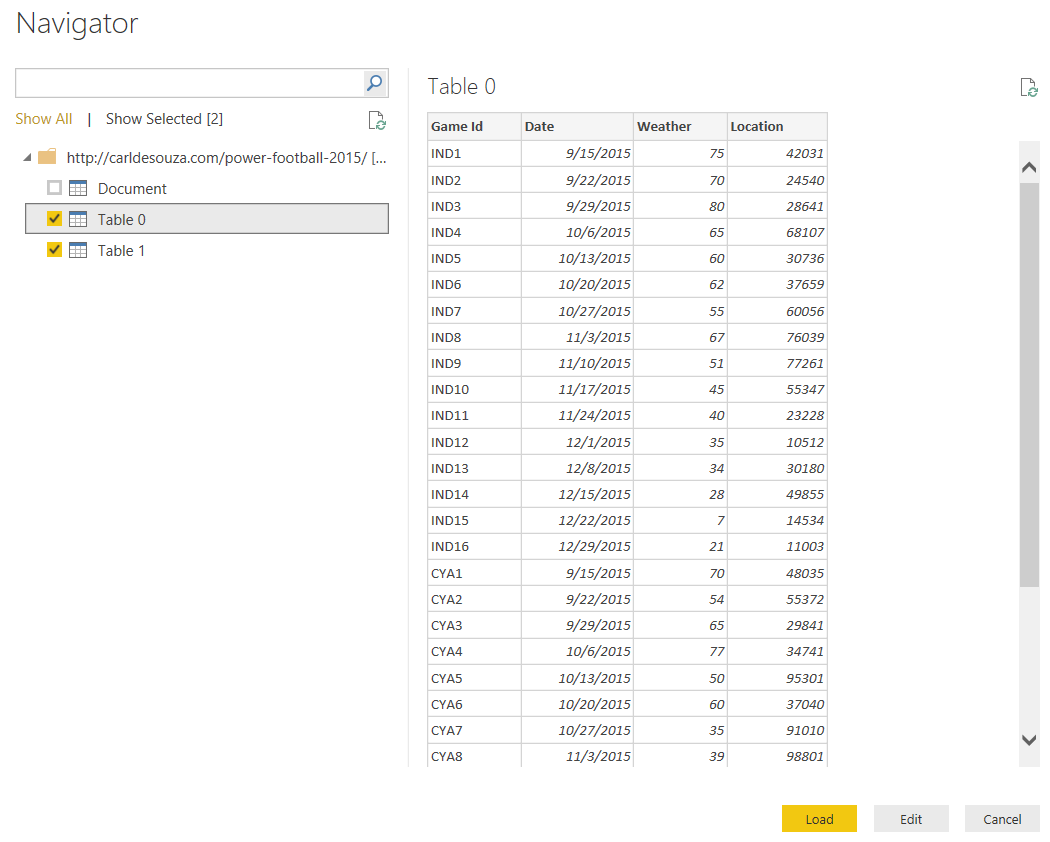
- The weather during each game the Indigos and Cyans played in and league team stats for 2015. This is stored online at a website located here: http://carldesouza.com/power-football-2015
The Setup
First thing we’re going to do is connect to the data. In Power BI Desktop, it is easy to connect to different types of data sources.
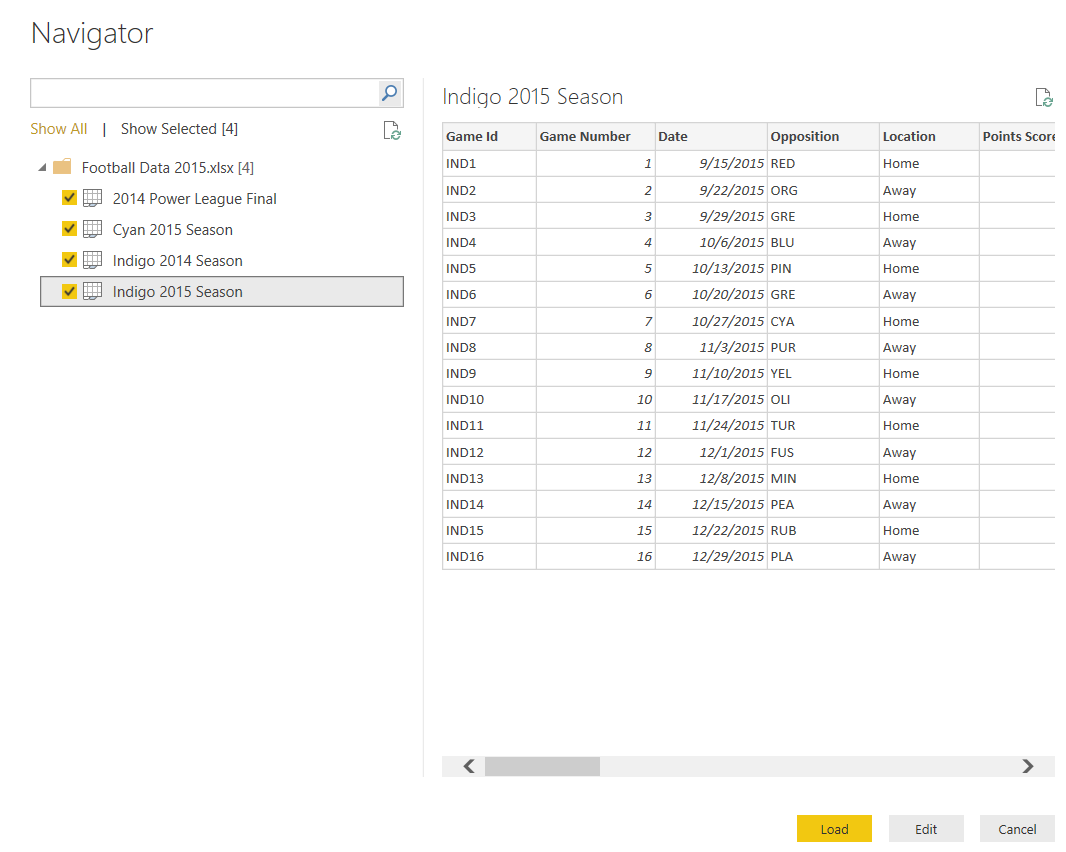
Here I am connecting to the spreadsheet directly:
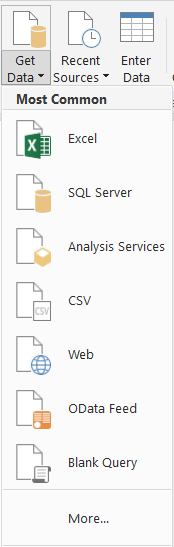
And also to the website housing the data:
After importing, the relationships between the data sources are defined in Power BI Desktop.
We can now build the reports.
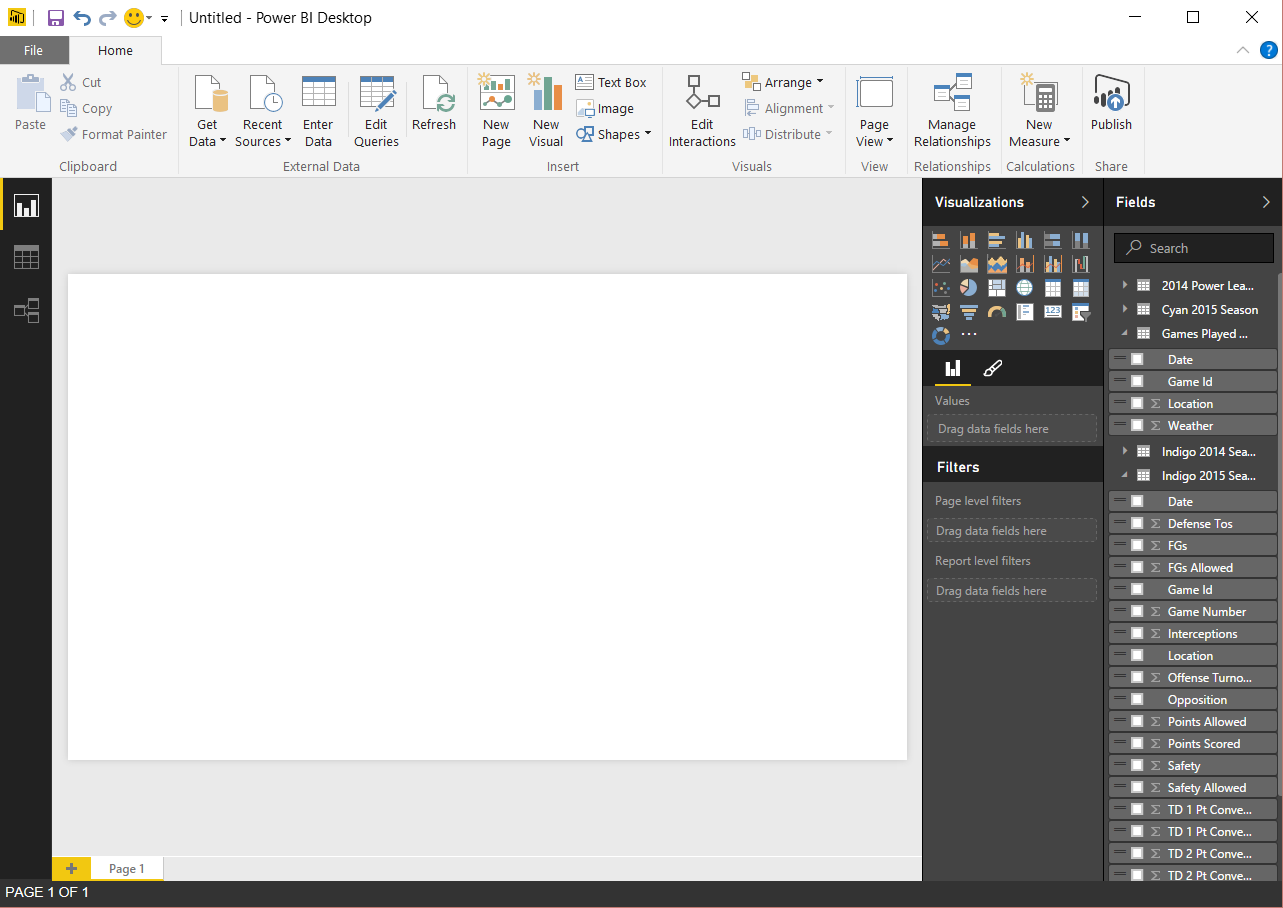
The Reports
Building the reports in Power BI is easy. Drag and drop fields from the source and pick your visualization type to create your charts. Here I am creating a clustered column chart showing what happened in last season’s Power Bowl final.
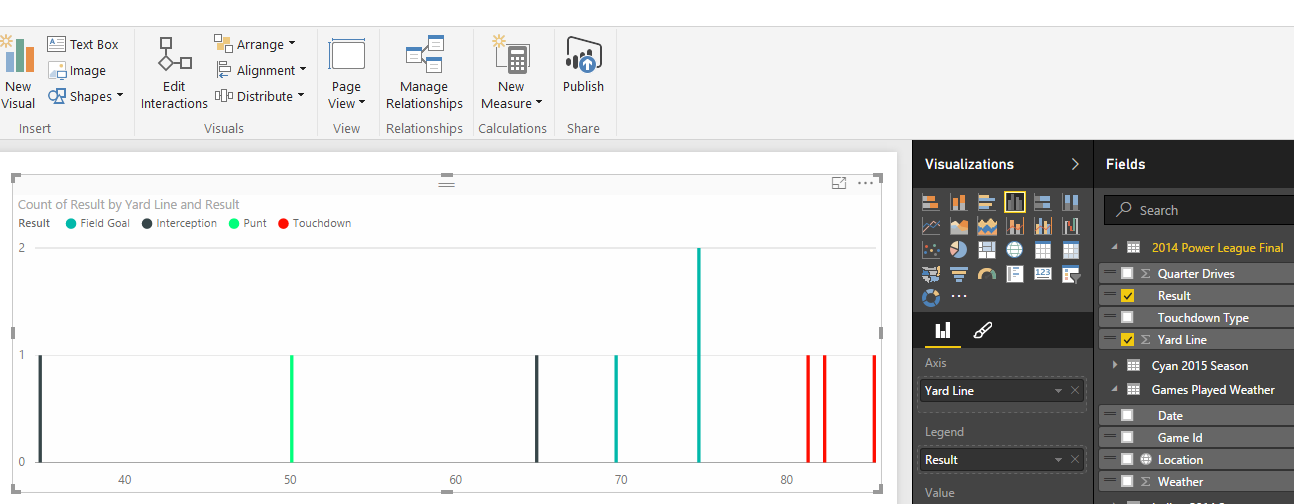
Let’s analyze this data. As you can see from the Indigos’ drives, when they get in the red zone at 20 yards from goal, they always scored touchdowns. 30 yards out they’re kicking field goals.
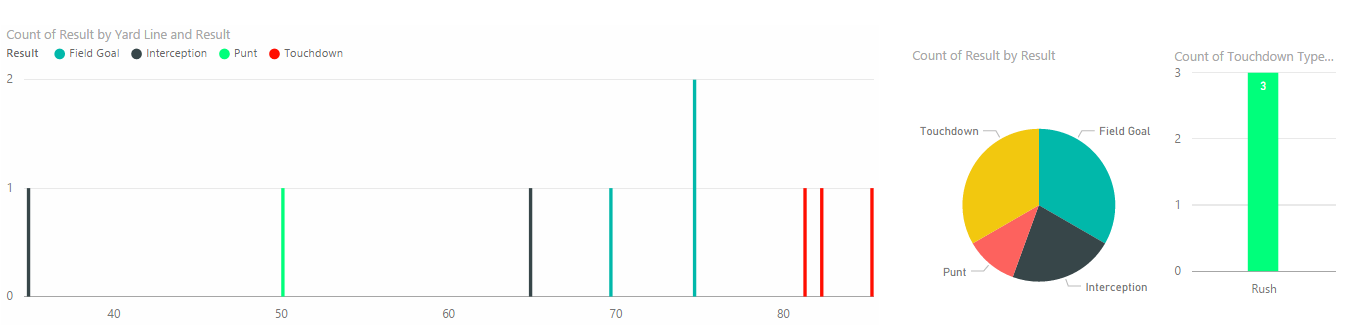
If we drill into the data further, we see that 100% of their touchdowns come as a result of running the ball. The Cyans’ defense will want to keep this in mind during the upcoming Power Bowl.
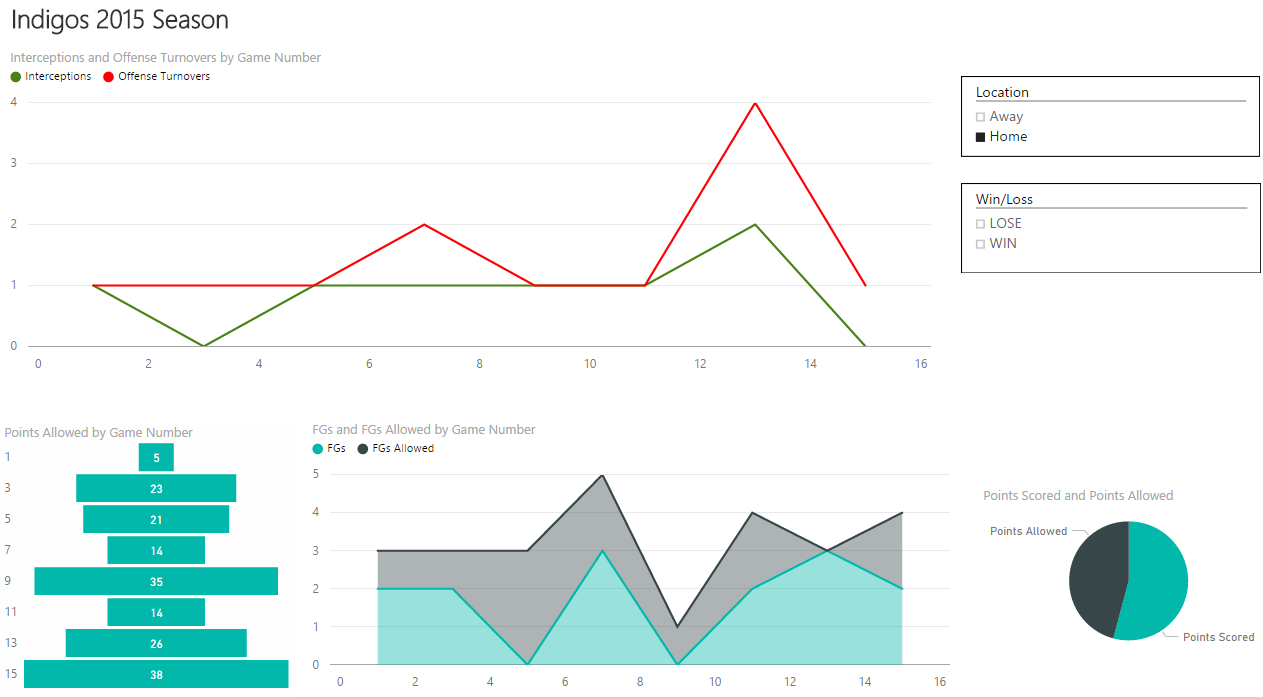
Let’s look at some stats for the Indigos’ 2015 season. As we can see from the Power BI line chart below, their interceptions per game (green line) are relatively consistent, but their turnovers (red line) are increasing as the season went on.
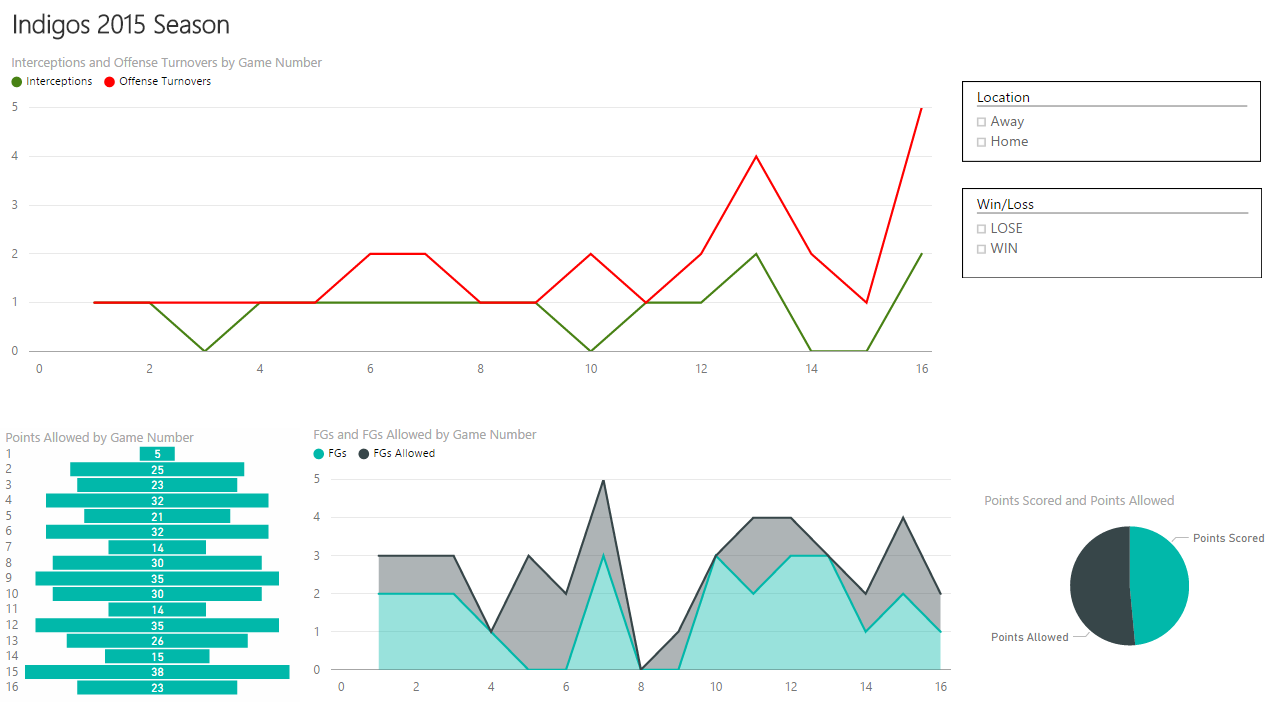
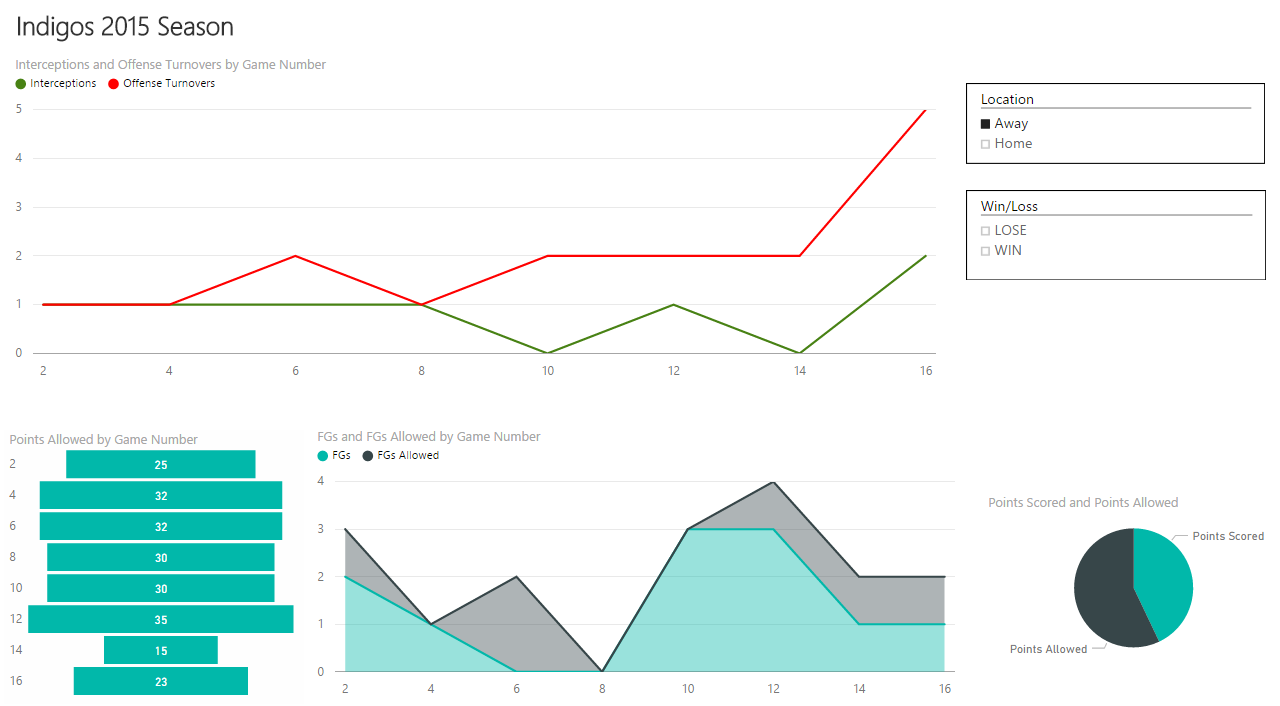
We’re also analyzing field goals for and against in an area chart. This seems pretty consistent. Points allowed per game in the funnel is reasonably consistent as well. Filtering by Home and Away doesn’t reveal any more patterns as the charts redraw.
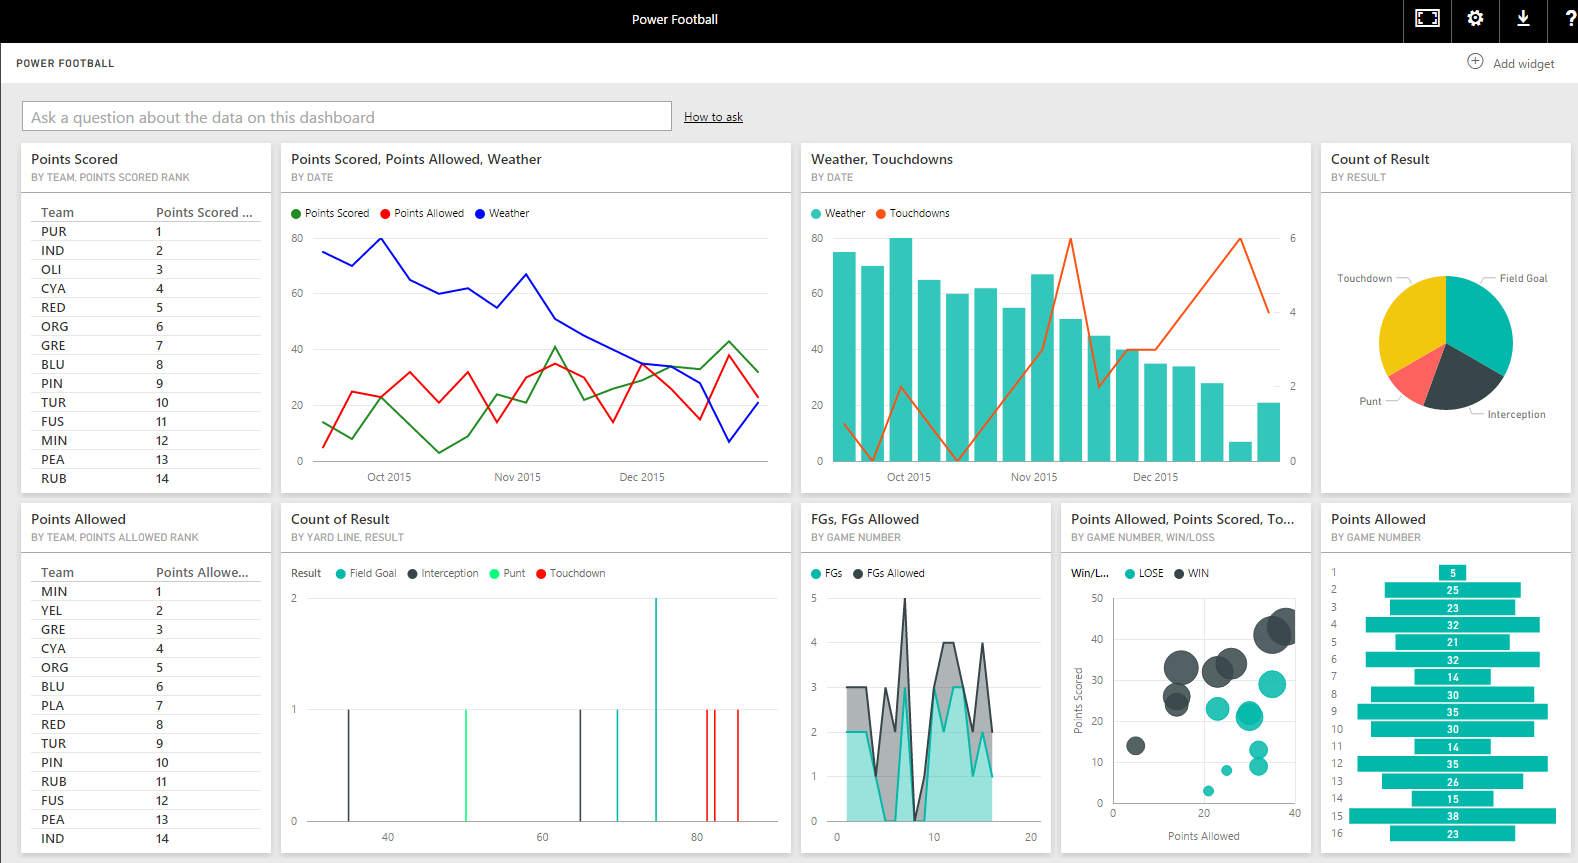
Let’s see if weather has any influence on the games. We can create a line chart for Points Scored, Points Allowed and Weather, by Date.
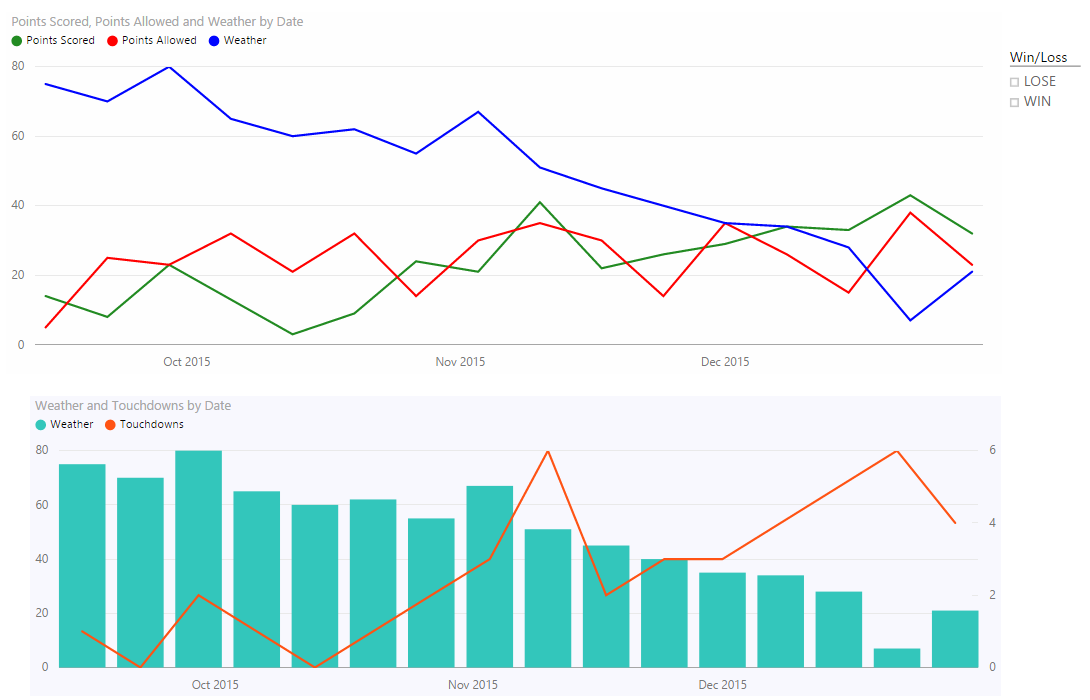
We see a decrease in the weather (blue line) goes with an increase in points the Indigos scored (green line). The bar chart we created also shows the weather decrease against touchdowns – they score more touchdowns in colder weather.
We can also see from a map the weather (size) and points scored (color saturation). Smaller circles means colder weather, darker circles means more points scored.
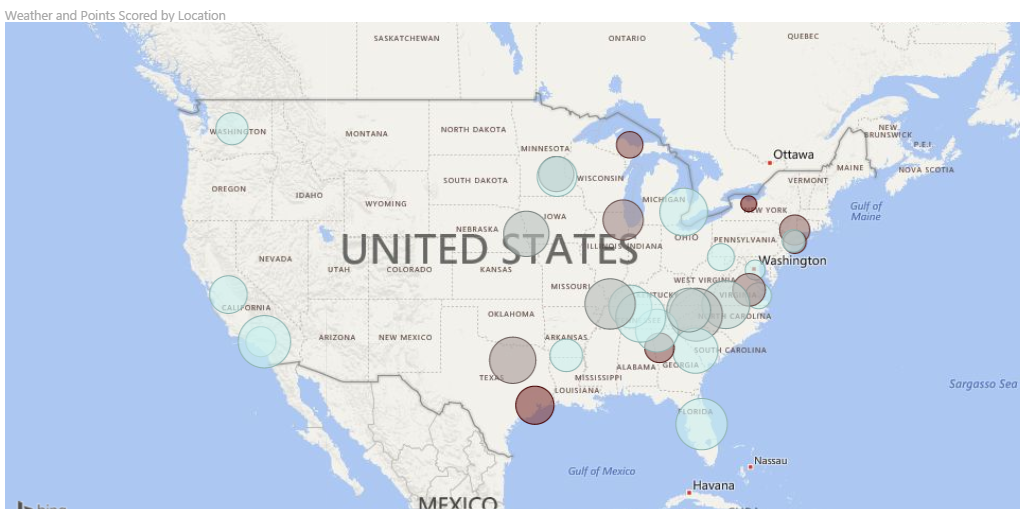
The weather forecast for the Power Bowl is 50 degrees, so that may go against the Indigos’ chances of winning.
From the Power BI table below, compared to the rest of the league the Indigos are ranked 2nd on offense but 14th on defense. The Cyans are ranked 4th on offense and 4th on defense.
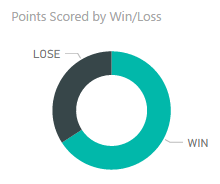
Games where more points are scored by the Indigos result more often in an Indigo win.
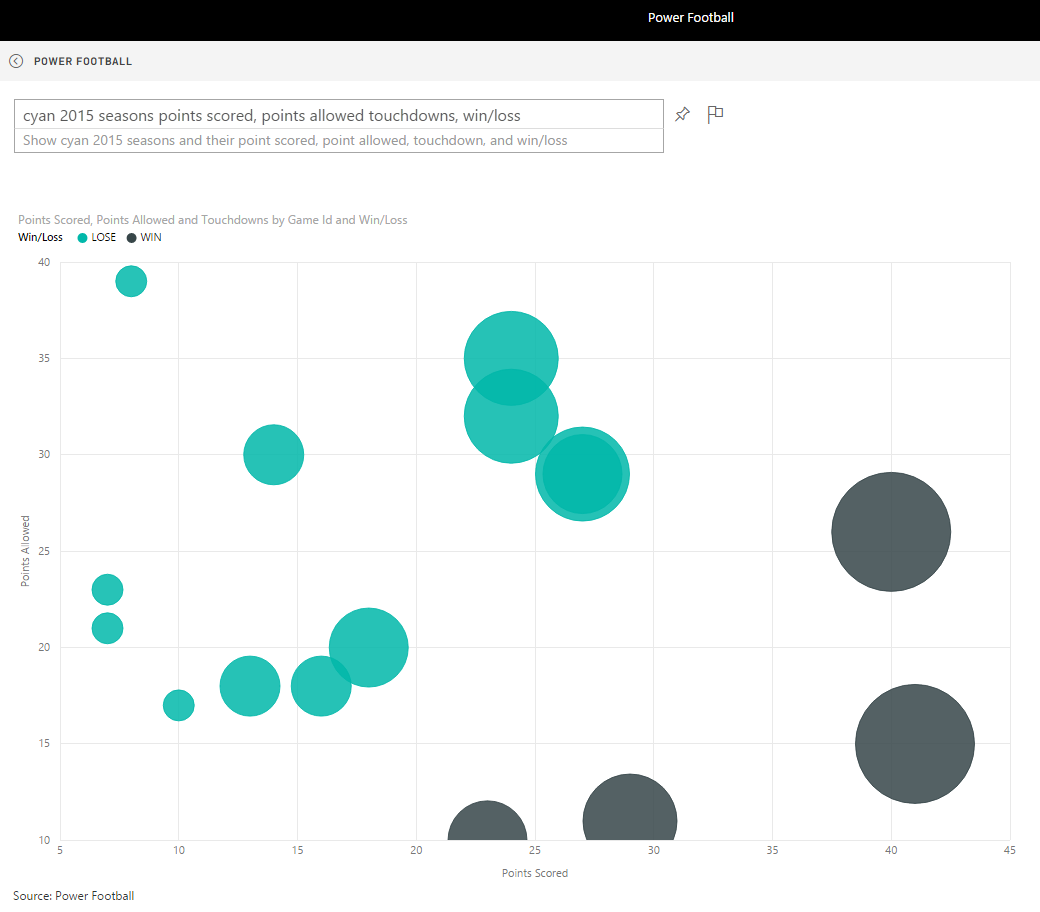
Lastly, I’m going to publish the data up to powerbi.com so I can ask questions of the data using natural language Q&A feature. Here I’m going to ask Power BI to “show the Cyan 2015 season points scored, points allowed, touchdowns, win/loss” by typing it into the Q&A box. It looks like a low scoring game might help the Cyans’ chances of winning.
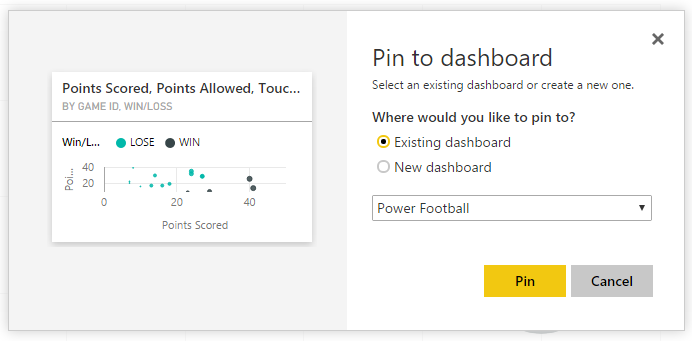
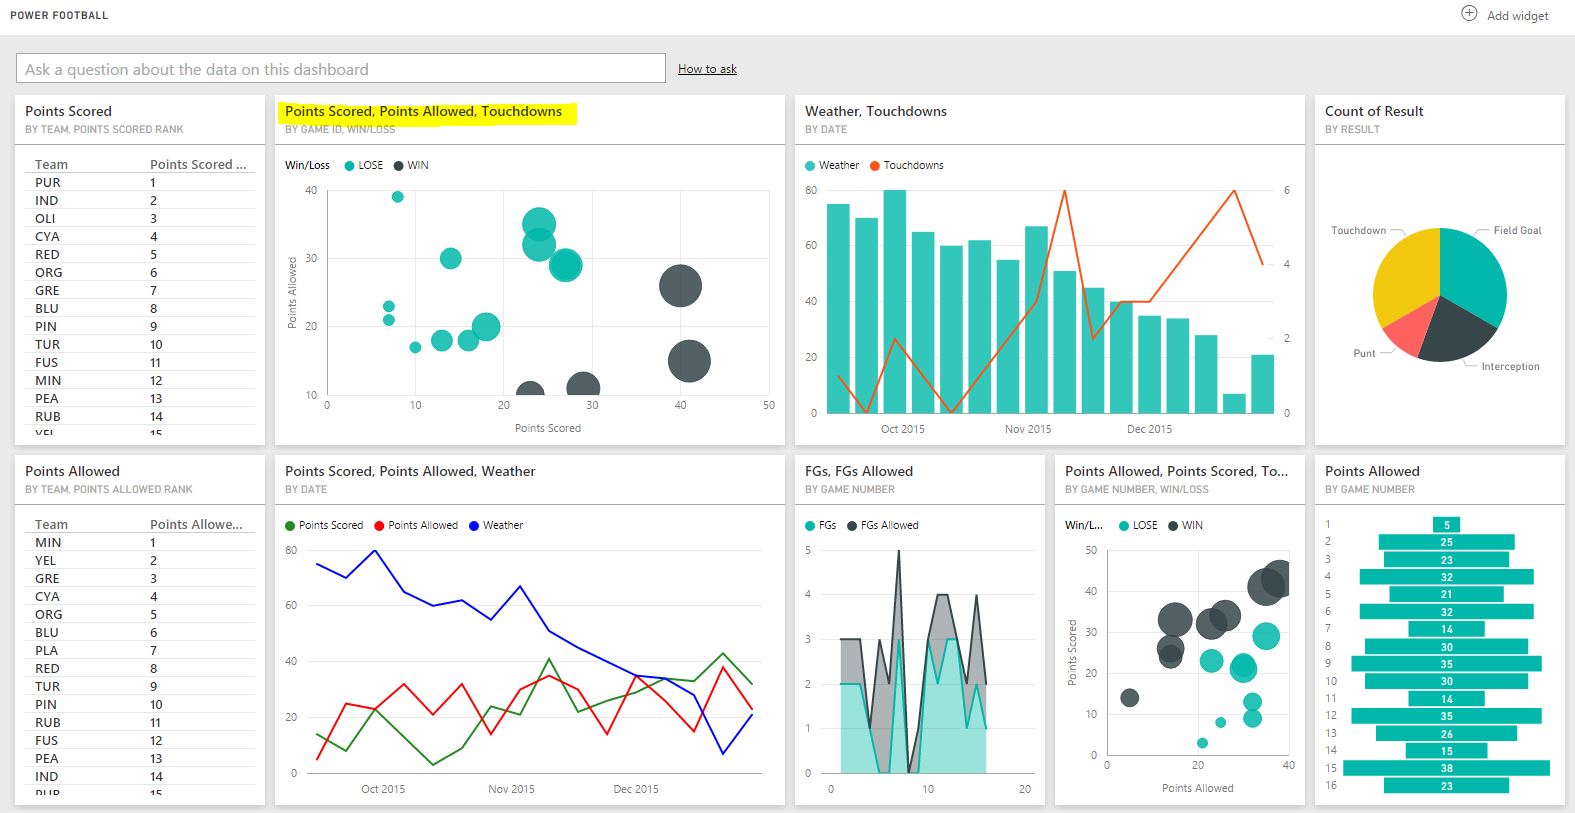
I can then pin this to my football dashboard for future reference:
Conclusion
By analyzing football data, we can uncover patterns and draw conclusions in the same way sports analysts do. This kind of information can hopefully be used to better your team’s performance.
Good luck with your predictions in Super Bowl 50!
I AM SPENDING MORE TIME THESE DAYS CREATING YOUTUBE VIDEOS TO HELP PEOPLE LEARN THE MICROSOFT POWER PLATFORM.
IF YOU WOULD LIKE TO SEE HOW I BUILD APPS, OR FIND SOMETHING USEFUL READING MY BLOG, I WOULD REALLY APPRECIATE YOU SUBSCRIBING TO MY YOUTUBE CHANNEL.
THANK YOU, AND LET'S KEEP LEARNING TOGETHER.
CARL

Hey Carl – I realize this post is 3 years old but I’m currently attempting to build out a model similar to this and I can’t quite nail down how to store the data. You show a small snippet of the Excel layout but I’d be interested in seeing how have that data stored. I’m struggling with home v away and how to connect those pieces in the data model. Then, trying to incorporate individual player stats for each game as well. Do you have any further information on best practice for data layout to achieve this kind of model? Thanks!
Hi Mike,
It’s a good question. Btw I looked for the spreadsheet I used, I have no idea where it is! Either way, I think there’s potentially many answers to this question. It’s kind of a 2 part answer, but it really depends on how you’re getting your data and what you plan to do with it. In terms of the data model, you could do something kinda straight forward, with tables for Team, Player, Game, PlayerGameStats, etc, and with the Game data having a location field for home/away. These tables would then be joined by identifiers. The tricky part can be populating this data each week, you may have to do some preprocessing, merging and appending. But it really depends on your requirements, thinking through this there’s all kinds of possible scenarios that might come into play with the data model. What you might find interesting is the NFL API located here – https://api.nfl.com/docs/league/models/game/index.html (I don’t think you can just “use” it but you can at least get an idea of how their data model is put together, and also the NFL fantasy football web service, which appears to be more useable – https://api.fantasy.nfl.com/. Hope it helps, reply back if you’re able to figure something out!
Hello Carl. Great tutorial on how to work with Power BI and American Football! Thank you very much!