Last week saw the end of an entertaining NBA playoff series between the Memphis Grizzlies and the San Antonio Spurs. The Spurs ended up winning the series 4-2. One of the series highlights came off the court, when Grizzlies coach David Fizdale went on an epic rant in a post-game interview, stating various statistics and concluding the officiating in the game was biased. He finished the interview with the words “Take that for data” and emphatically slapped his hand on the table before walking off. Of course, this quickly became an internet meme (I want to buy the t-shirt myself!).
The data that Fizdale produced in the interview did in fact tell a story. Being a naturally curious data guy, I couldn’t help pulling the series data into Power BI, Microsoft’s business intelligence platform, to take a look for myself.
Firstly, Fizdale was right in his raw statements. He questioned how opposing player Kawhi Leonard was able to get to the free throw line so often. He said “They shot 18 times in the paint and had 32 free throws. Kawhi shot more free throws than our whole team. Explain it to me.”
In the graph below, we can see in Game 2 the Grizzlies were awarded 15 free throws, versus the Spurs who were awarded 32 free throws:
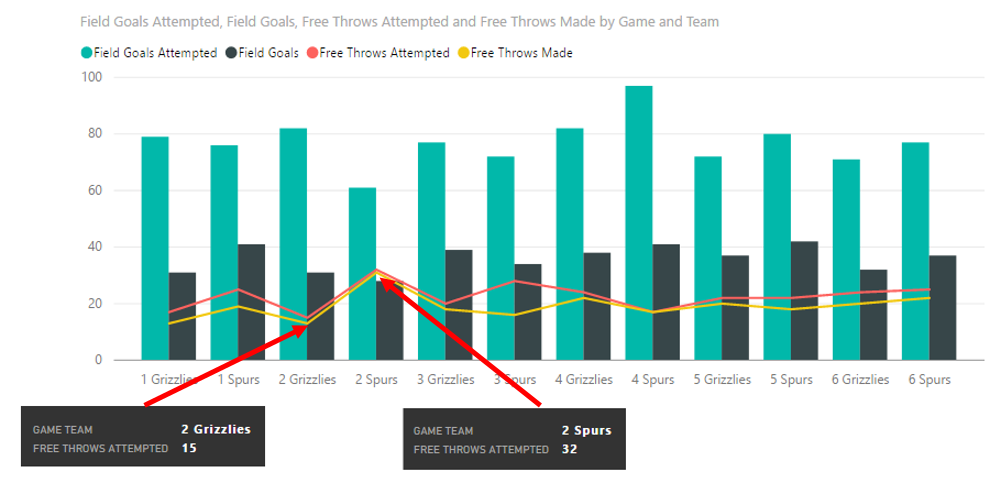
First Round NBA Playoffs 2017, Grizzlies vs. Spurs, Free Throws and Field Goals
Additionally, Leonard led all free throw shooters with 19, or 40% of all free throws in the game, even more than all the Grizzlies players combined:
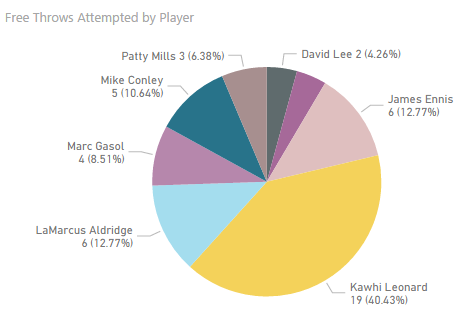
First Round NBA Playoffs 2017, Grizzlies vs. Spurs, Game 2 Free Throws by Player
Interestingly, looking at the first graph, free throws appeared to even out as the series went on. There was still a Spurs advantage in Game 3, and the Grizzlies had an advantage in Game 4 before the series became more even.
“I’m not a numbers guy, but that doesn’t seem to add up.” – David Fizdale
So was there a bias towards Leonard getting to the free throw line? If we look at all player’s free throw numbers in the series, we can see Leonard is much higher than the next player:
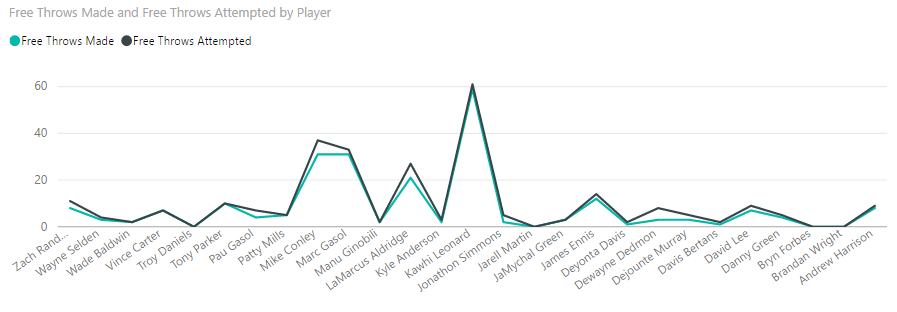
First Round NBA Playoffs 2017, Grizzlies vs. Spurs, Series Free Throws Made and Attempted
The Grizzlies were also on the receiving end of more fouls in the series, and producing the top 3 players in foul trouble. The question then becomes, is Kawhi very good at getting to the free throw line, or are officiating errors helping him get there? Either way, perhaps we can do more with data to neutralize his drawing of fouls.
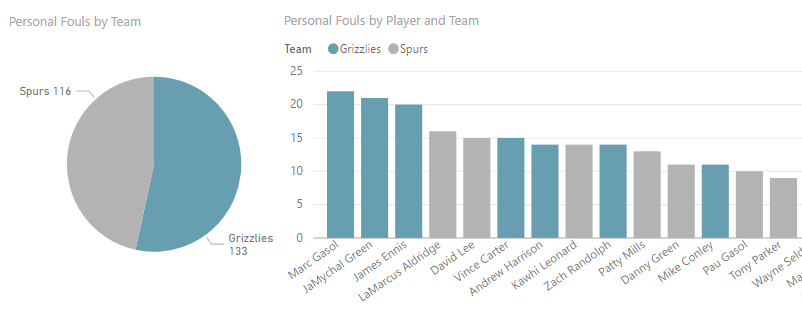
First Round NBA Playoffs 2017, Grizzlies vs. Spurs, Personal Fouls
So how does data help teams win basketball games?
We can derive from the above that if Leonard was awarded less free throws, the series may have turned out differently. Assuming there was no bias in the officiating, how can we use data to help teams be more competitive?
Looking at patterns from the past can help us in predicting the future. Mark Cuban, owner of the Dallas Mavericks and billionaire businessman, recently tweeted “The new NBA” with a photo of a book on Machine Learning using the Python programming language (and some Jupyter notebook code).
The new NBA pic.twitter.com/RkV6PkwXaD
— Mark Cuban (@mcuban) March 28, 2017
Mark Cuban and the Dallas Mavericks are what ESPN has categorized as “All-In” for analytics. ESPN released a list called the “The Great Analytics Rankings” and went on to categorize each professional sports team and how much they used analytics. The teams were divided into the categories of All-In, Believers, One Foot In, Skeptics and Non Believers.
Teams are using analytics in a variety of ways. Biosensors can help athletes measure performance, movement and motion. Coaches can study opposing teams and player weaknesses through software and exploit that on the court. Data scientists can use algorithms to determine how teams complete against each other and determine the right players to have on the court at the right time. Mark Cuban’s reading material will help him build those predictions as data can be used with algorithms and then validated to determine the accuracy of the model – some algorithms will work better than others. There are many ways in which analytics can be used to help teams win.
How can teams beat the Spurs?
David Fizdale highlighted a major point: Kawhi Leonard is a very important factor in the Spurs offense (see charts below). Leonard is a major scorer, and the Spurs actually produced less assists in this series than the Grizzlies, perhaps uncharacteristic for a team whose style of play is to move the ball around. Other teams should try to keep the ball out of Leonard’s hands while maintaining a strong defense overall. Studying the Spurs offensive data may produce patterns that provide details on how to stop them. And you can be sure the Spurs analytics department, who are “All-In,” will be analyzing their opponent’s strategy as well, play by play and game by game.
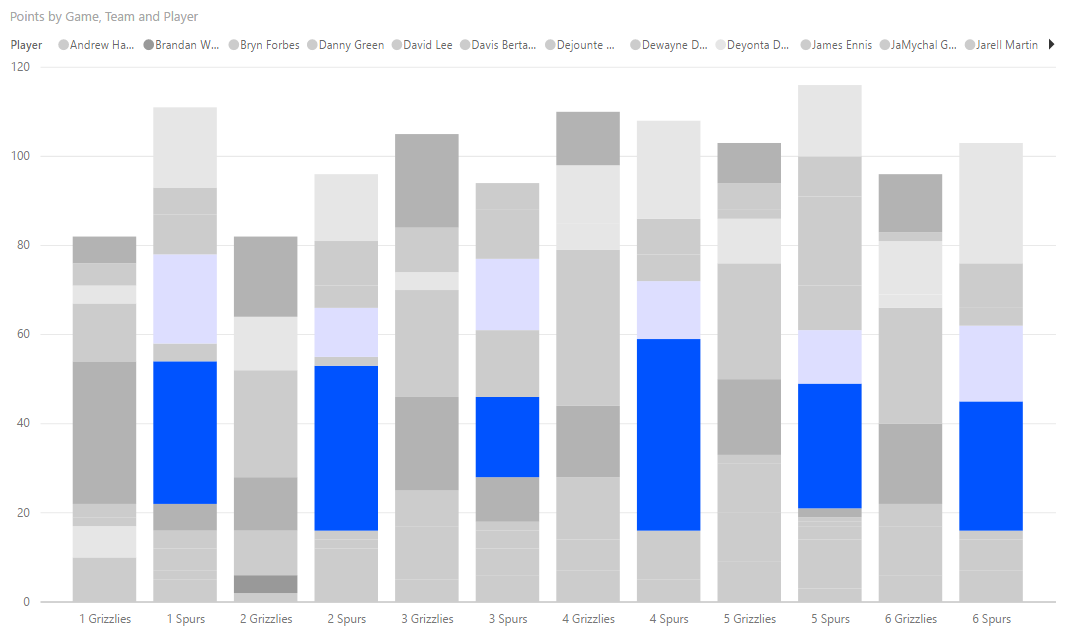
Kawhi Leonard Scoring vs Rest of Players, First Round NBA Playoffs 2017 vs Memphis Grizzlies
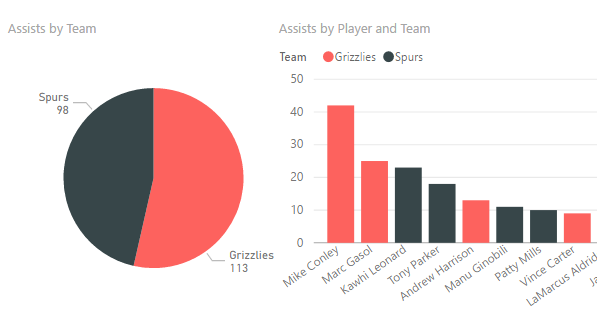
First Round NBA Playoffs 2017, Grizzlies vs. Spurs, Series Assists
Conclusion
There is much debate regarding just how much analytics helps teams win. Regardless of if you are “All In” or a “Non-Believer,” there are many factors which go into building a championship team. How much data you capture and how you use this data can determine how well you can make predictions.
I’ll leave you with an anecdote I found during my data analysis. In the Spurs-Grizzlies series, players whose first names start with A-J scored a combined 265 points in the series, whereas players whose names started with K-Z (i.e. Kawhi, Mike, Marc, Tony, LaMarcus, Zach etc) scored a combined 941 points. And if you’re wondering if we do A-K, it’s still a significant difference. The data is telling us we should have more players whose first names are K-Z on the team.
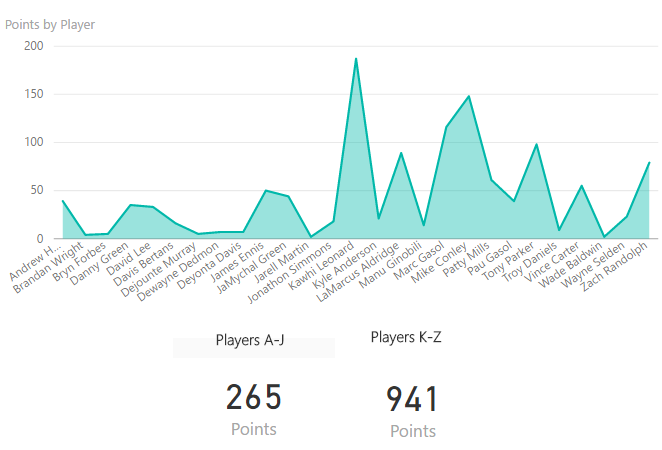
First Round NBA Playoffs 2017, Grizzlies vs. Spurs, Series Scorers, Alphabetical
I AM SPENDING MORE TIME THESE DAYS CREATING YOUTUBE VIDEOS TO HELP PEOPLE LEARN THE MICROSOFT POWER PLATFORM.
IF YOU WOULD LIKE TO SEE HOW I BUILD APPS, OR FIND SOMETHING USEFUL READING MY BLOG, I WOULD REALLY APPRECIATE YOU SUBSCRIBING TO MY YOUTUBE CHANNEL.
THANK YOU, AND LET'S KEEP LEARNING TOGETHER.
CARL
