Power BI has a forecasting capability that can be applied to line charts.
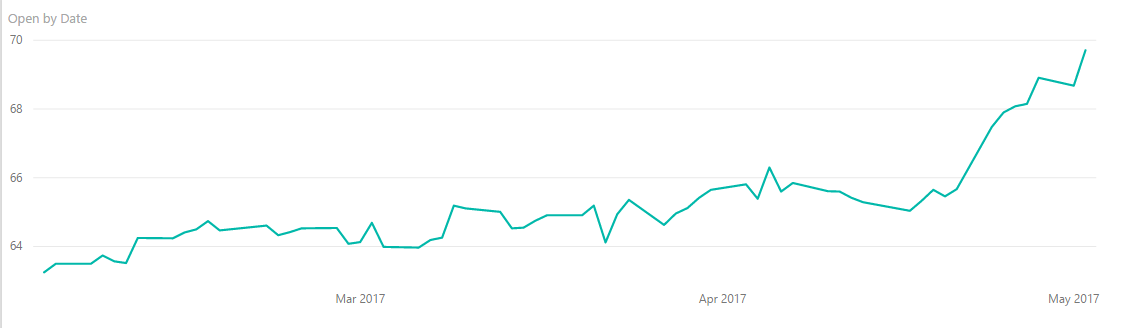
To use the forecasting, create a line chart, for example like the one below showing MSFT stock prices:
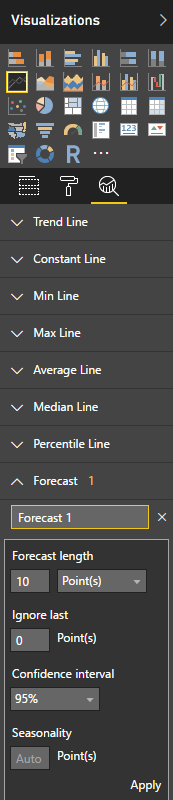
Under the Visual properties, go to the Analytics tab and you will see Forecast. Add a new forecast:
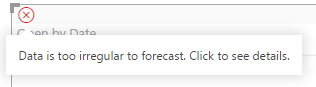
You may see this message below if the data is irregular.
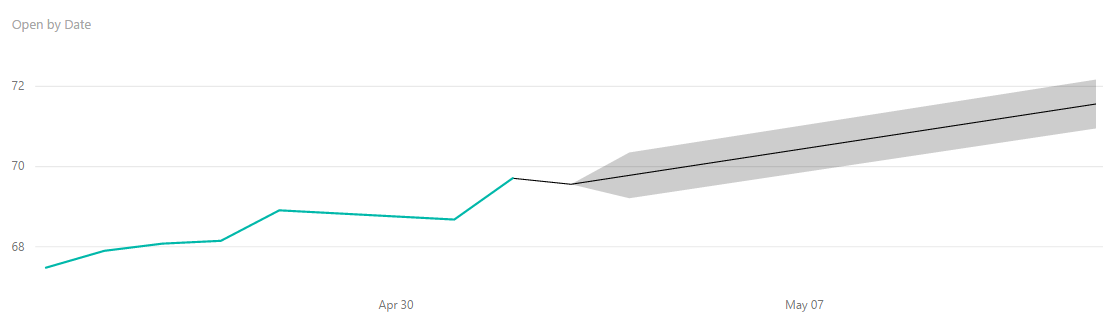
In our case, we can filter the data to show the more recent prices. This will allow the forecasting to work:
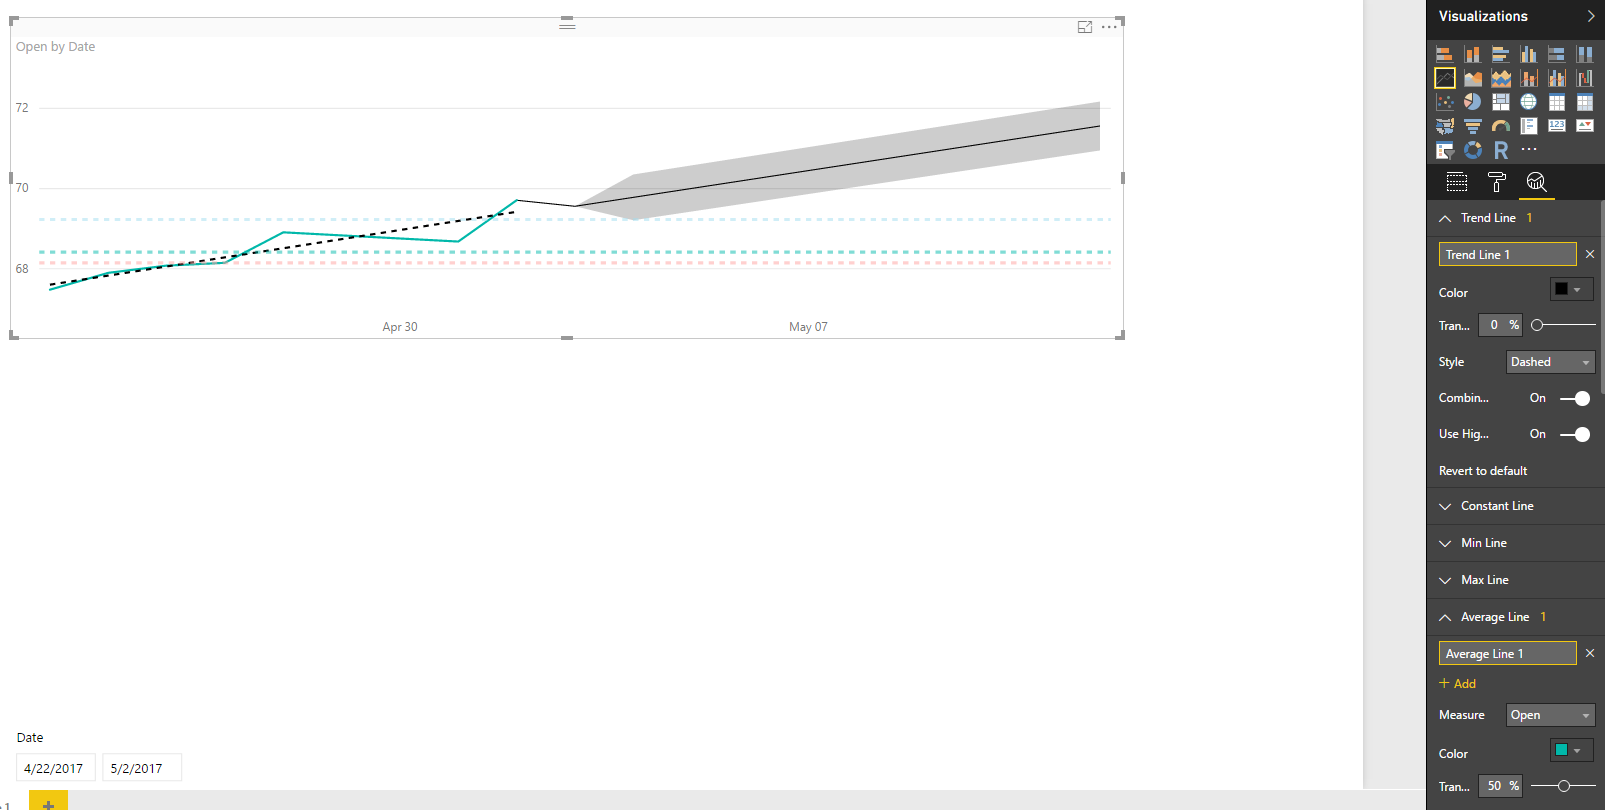
You can also add a trend lines, constants, min, max, average, median and percentile lines:

Keep learning. Keep building.
Explore AI, agents & Microsoft technology.
I share practical ideas, tutorials, and videos about AI, AI agents, Microsoft technologies, and the Power Platform.
Subscribe on YouTube →Carl de Souza Enterprise Architect at Microsoft · AI Technology Expert