In Power BI, there is a DAX function called USERELATIONSHIP. This is particularly useful when you need multiple relationships between tables. Here we will go through an example of how this works.
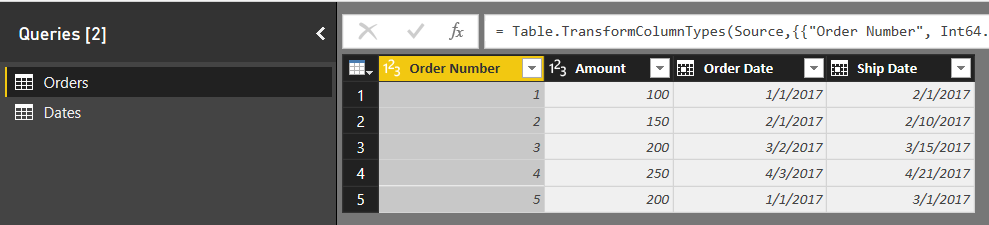
Consider a typical example, where you have an Orders table with different dates such as the Order Date (i.e. the date the order was created) and the Ship Date (i.e. the date the order was shipped). You would like to run reports on data based on each of these dates at the same time.
The tables looks like below, and you also have a standard Dates table:
Now, we will build a relationship so we can use the Orders table with the Dates table.
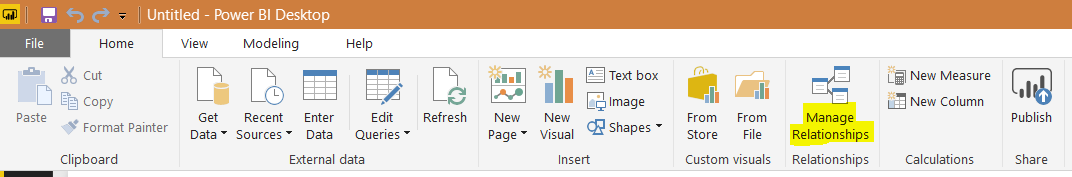
Click on Manage Relationships:
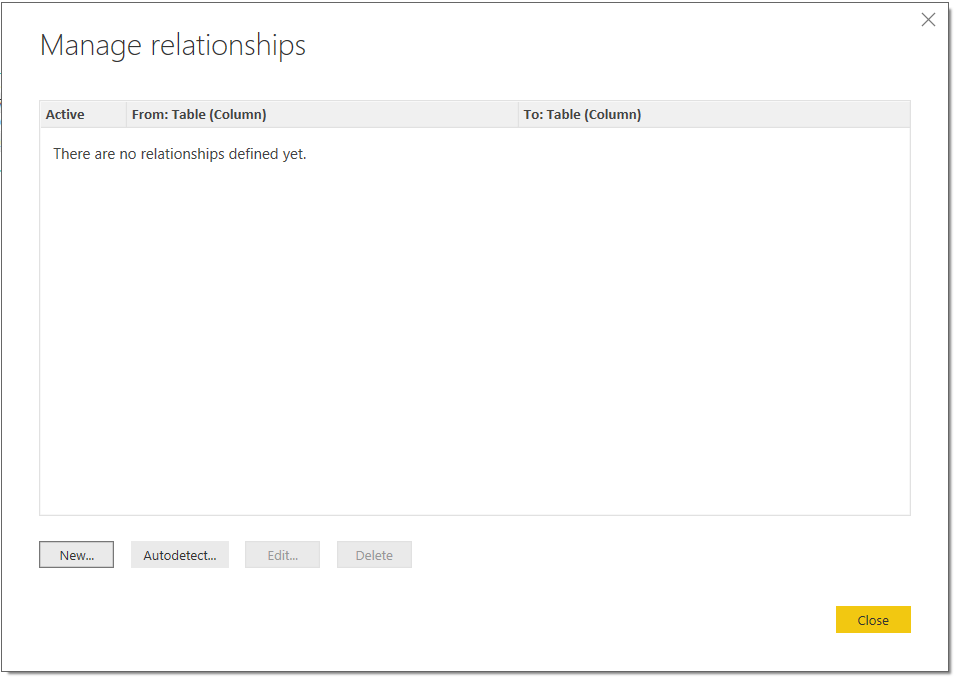
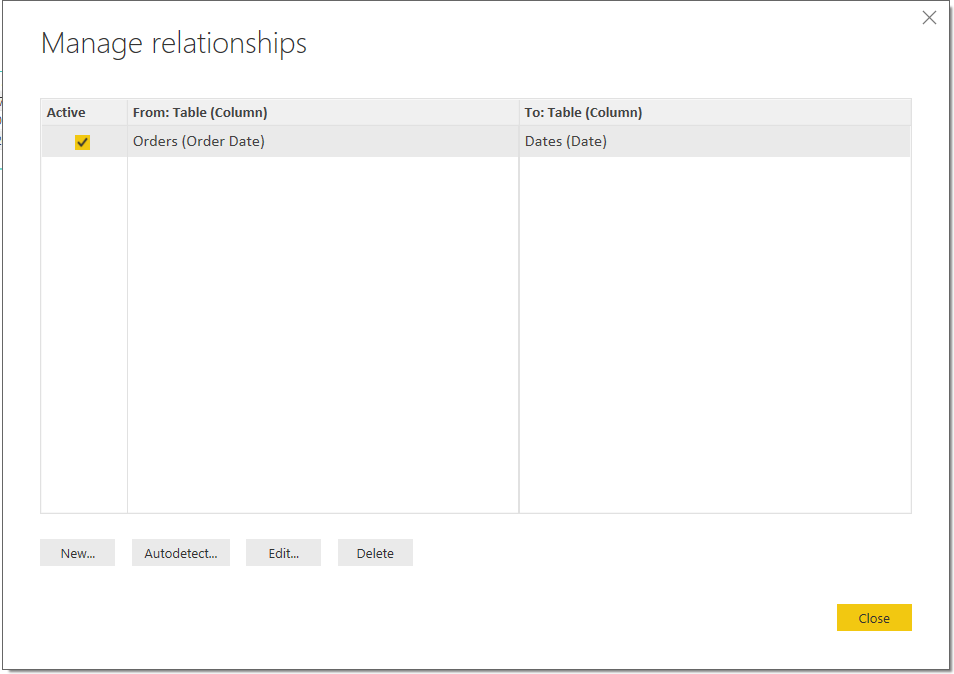
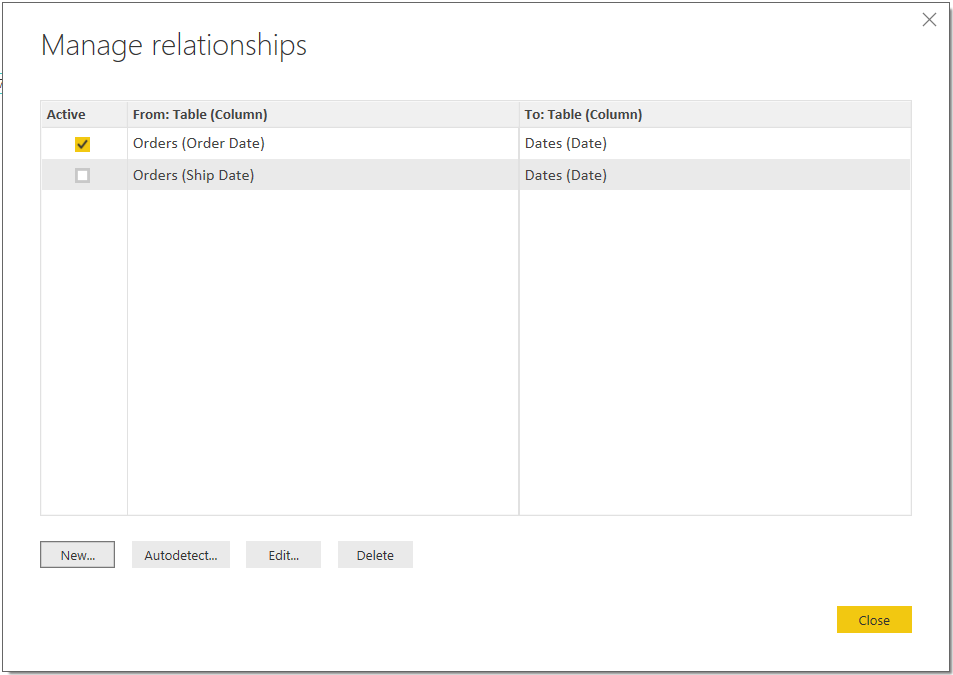
This will open the window:
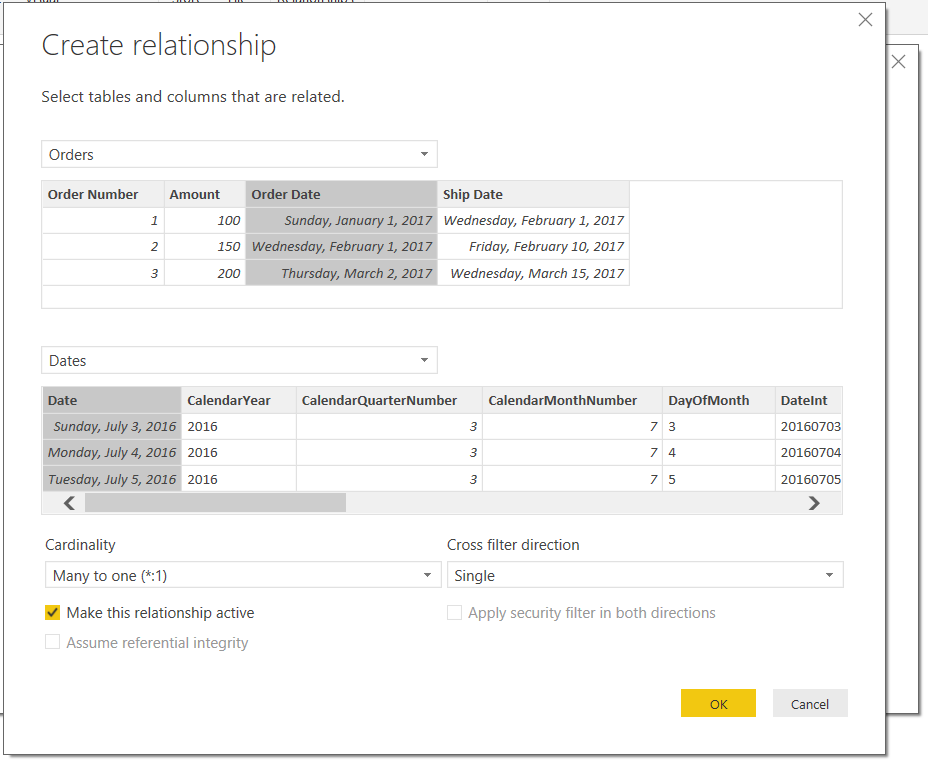
Click New, and select the two dates to form the relationship, then click OK with the defaults below:
You will now see:
Now let’s drag some visualizations across to view the data. We will add a Calendar Month slicer so we can filter by Month to see how our sales amount is doing, and we will drag across the Amount field, which is a sum of the amount. We also have some other tables to display the records of Order Date, Ship Date and Amount:
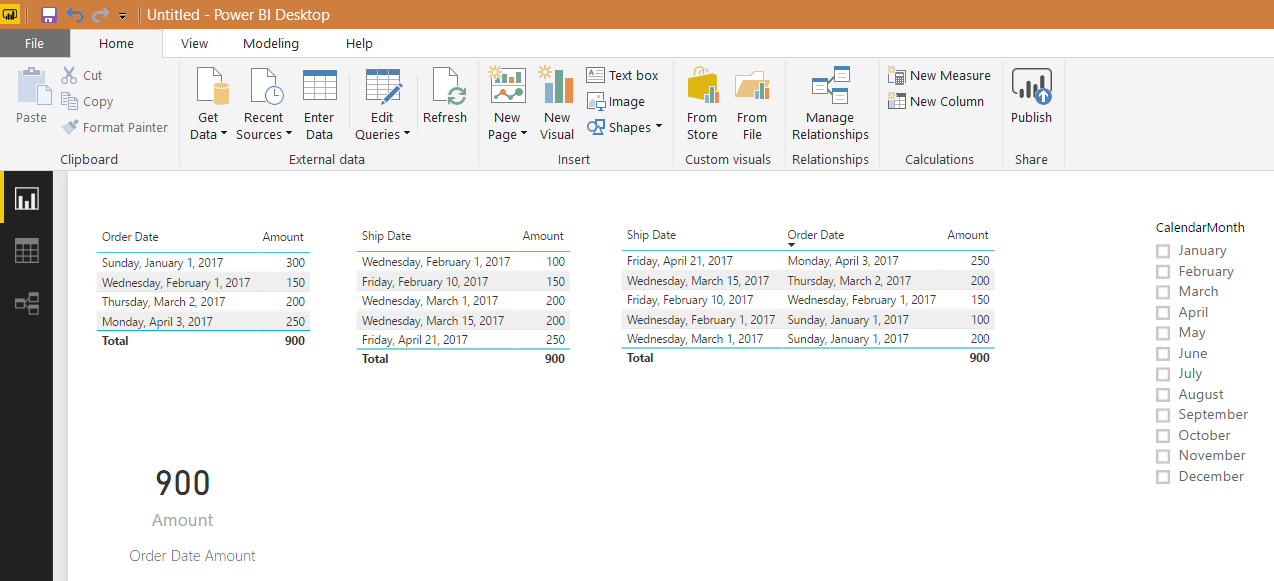
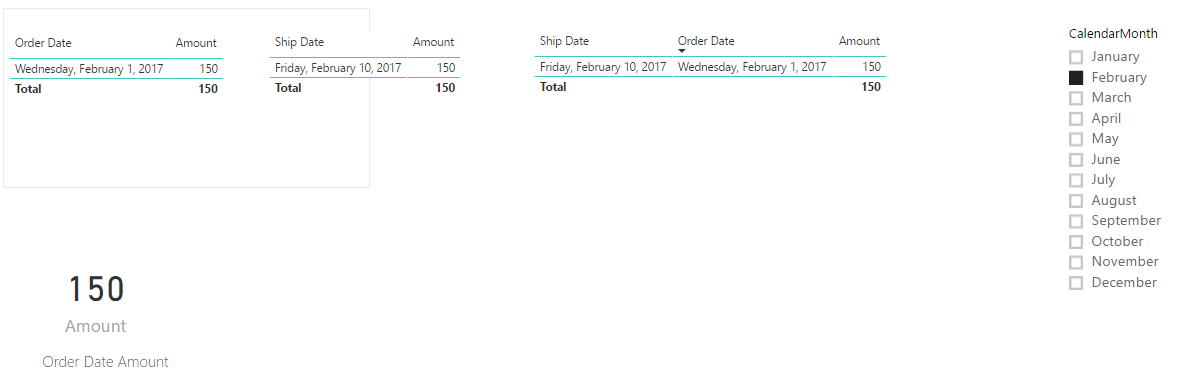
So we can see, the total amount is 900. If we click on February, we can see the total amount is 150:
Now, this amount is based on the relationship we defined above. Power BI is assuming when we select a date from the slicer, that our visualizations will use this date for their filtering. What if we want to see how our sales are doing by using the ship date?
The first thing we will do, is click to add a new relationship. We will select the Ship Date this time, and the date as we did last time. Notice this time, if we try check the relationship as Active, we get a message “Another active relationship exists” :
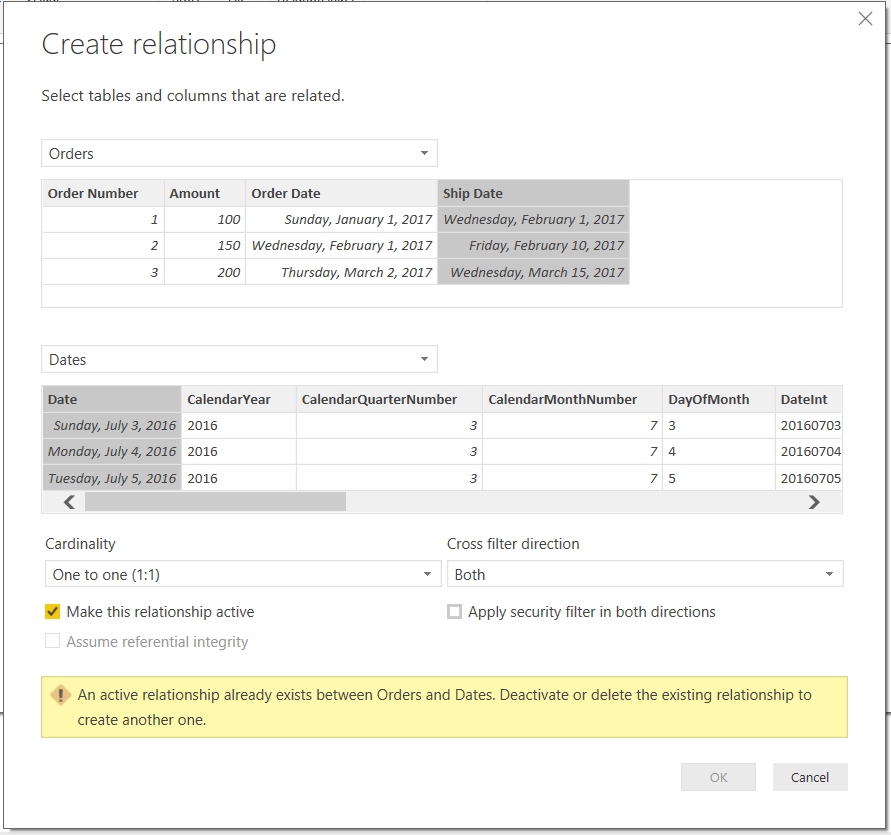
Uncheck the relationship active box and click OK. You will now see two relationships, one active and one not active:
We can now use this non-active relationship to build our queries. Let’s create a new measure to display the total sales amount, using the shipping date.
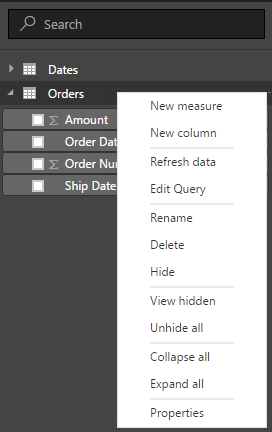
On our Orders table, click to add a new measure:
In the measure window, add the code:
Amount Using Ship Date =
CALCULATE (
 SUM ( Orders[Amount] ),
 USERELATIONSHIP (
 Orders[Ship Date],
 Dates[Date]
 )
)
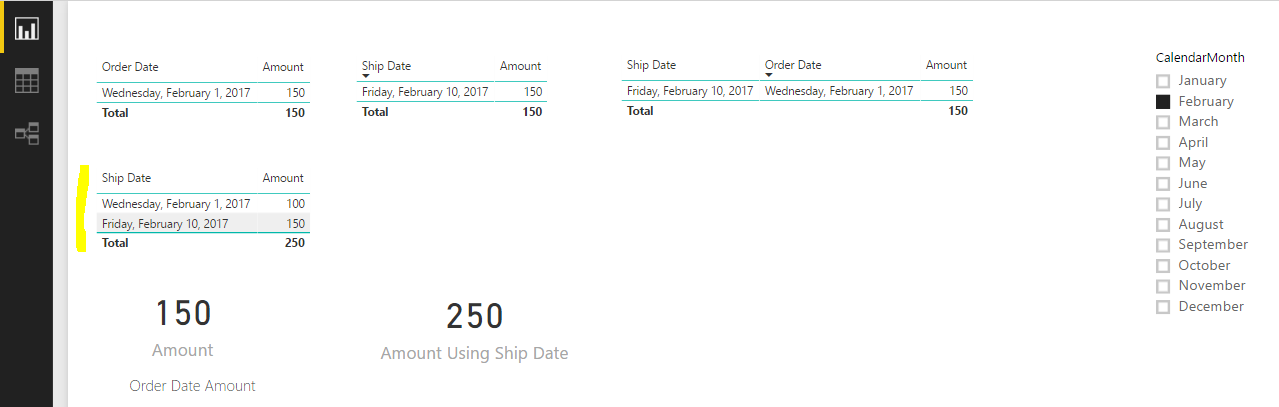
Now, drag out new field onto the form and filter by the month of February. In this month the amount by ship date is $250, different from the amount by order date:
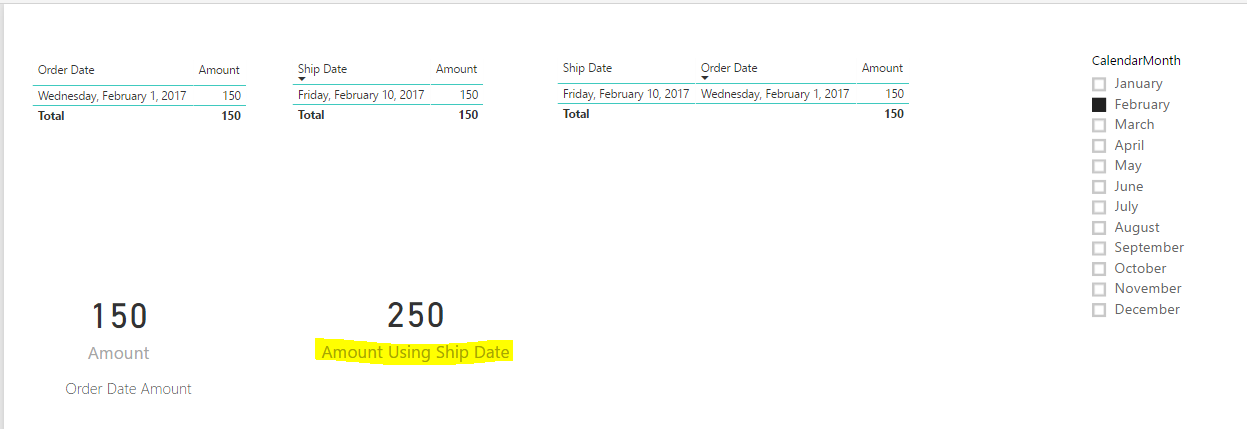
Now, we can see above that the measure works well, but our table charts are still running off the order date relationship.
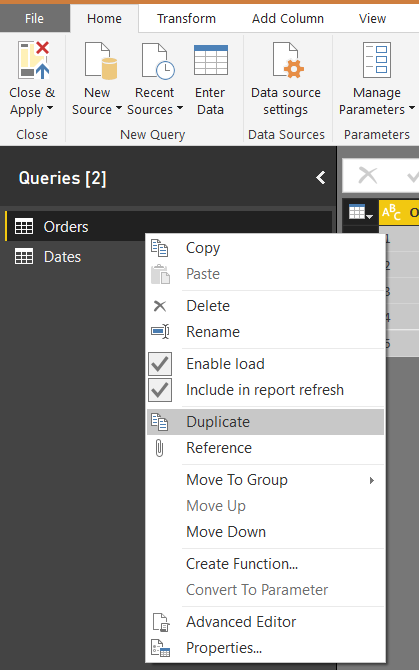
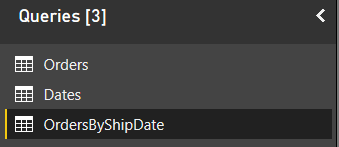
One way to fix this is to make a new copy of the orders table. In the query editor, right click the data source and click Duplicate:
Rename to OrderByShipDate, and Close and Apply:
Now in Manage Relationships, add a Many to One relationship between the OrderByShipDate table and the Dates table using the Ship Date key:
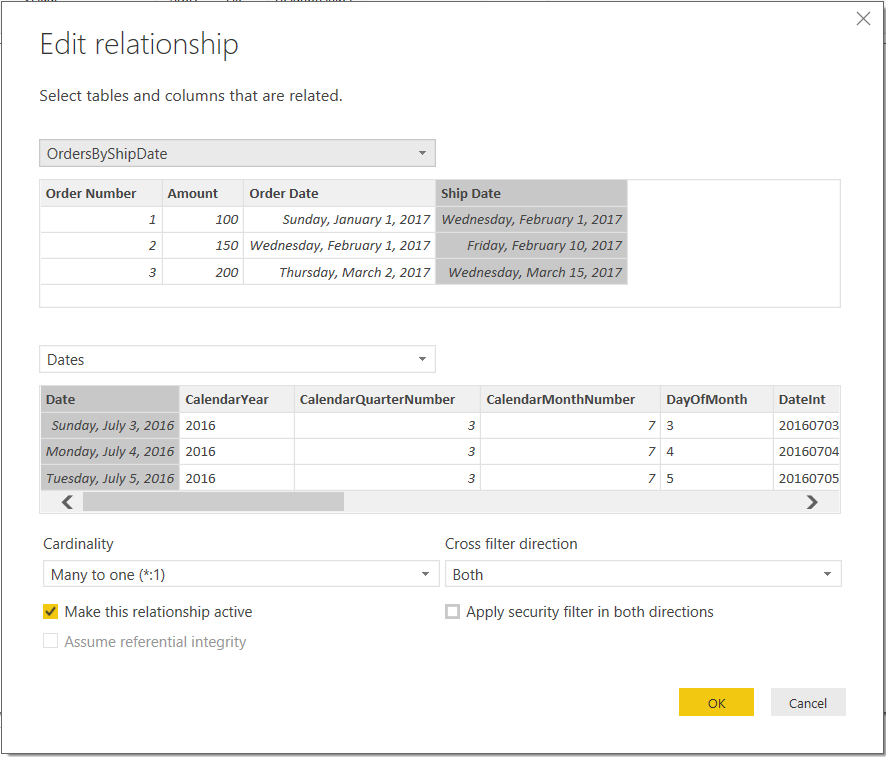
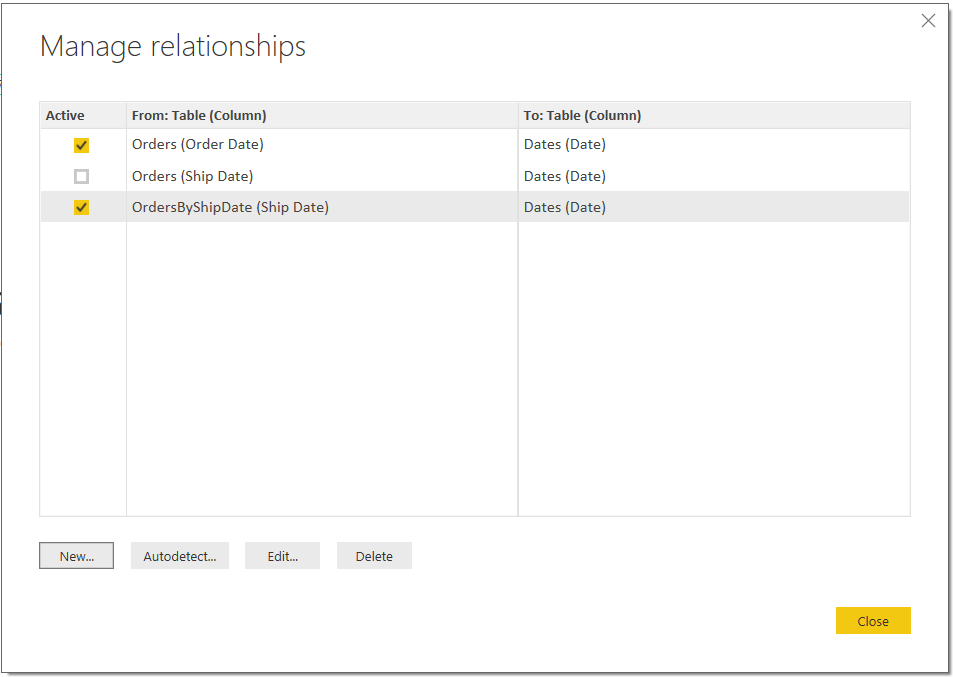
Your relationships should now look like:
Now let’s add this new table to our report. Add the fields Ship Date and Amount in a table view. You can now see the Ship Date lines displayed:
I AM SPENDING MORE TIME THESE DAYS CREATING YOUTUBE VIDEOS TO HELP PEOPLE LEARN THE MICROSOFT POWER PLATFORM.
IF YOU WOULD LIKE TO SEE HOW I BUILD APPS, OR FIND SOMETHING USEFUL READING MY BLOG, I WOULD REALLY APPRECIATE YOU SUBSCRIBING TO MY YOUTUBE CHANNEL.
THANK YOU, AND LET'S KEEP LEARNING TOGETHER.
CARL

Carl, I’m so glad I found this article as it is the closest one that I have found that references a problem similar to mine. Assuming my data looks similar to your (as it does) but Order date is Date Booked and Ship date is Night Stayed. I work in the vacation rental industry…
I’m trying to find a way to compare my sales by the night stayed YOY. BUT, taking into consideration that when looking at last year I don’t want to see the end total of reservations or sum of sales, rather, How many reservations and the sum of sales were “on the books” up to this date.
So If I was running the report today using your terms I would want to be able to choose a Ship Date or range and see a count of orders made and the sum of sales by the Order Date for 2018 and 2017.
Or if this helps, How can I filter my Order Date in 2017 to exclude dates that haven’t happened in 2018.
<TODAY()-365
Thanks in Advance
Mike
Hi Mike,
Check out this post. You can use sameperiodlastyear. Hope this helps.
https://carldesouza.com/power-bi-year-over-year-using-sameperiodlastyear/
Hi Carl – before I create a huge post that goes into a lot of detail, I thought I would ask what may be a simple question related to this article.
In the example above, you have order date and ship date in the same row. Order date is the primary map to the Date table.
I am only working in BI Desktop (do not know if that matters) and attempting to create a calculated measure that is based on the date slider of the report page selected. Using the terminology above, my measure is
Delta =
IF(MIN(Dates[Date]) > = MAX(Orders[Order Date]) && MAX(Orders[Ship Date]) >= MAX(Dates[Date]),DATEDIFF(MIN(Dates[Date]) ,MAX(Dates[Date]), DAY), 99999)
MIN(Dates[Date]) returns the min of the date slider in the report (this returns correctly)
MAX(Dates[Date]) returns the max of the date slider in the report (this returns correctly)
MAX(Orders[Order Date]) returns the Order date of the product in the row (this returns correctly)
MAX(Orders[Ship Date]) is supposed to return the Ship date of the product in the row (this returns when evaluated alone, causes the expression to return 99999)
I actually have several conditions that need to be nested, but this is the first condition. The component comparing Orders[Ship Date] is working, however every attempt I have made with the Orders[Ship Date] only returns the 99999. I’ve tried using a separate table with just the effective product key and the ship date, but I need to map the product keys … power bi will only let me use a non-active relationship (like the original issue with the second date) thus it’s not mapping the correct order/ship dates to a specific product.
Is there something simple that I am missing? (I am extremely new to Power BI) or is this a complex problem? It seems like it should be something that comes up often but I have scoured the help and support examples and have not found anything that resolved this issue.
Warm Regards,
Nancy P
Sorry – one correction, I meant The component comparing Orders[Order Date] is working,
Hi Nancy,
The question here would be, in your given DAX query, what is the end result you are looking for? I’m looking at the logic but maybe the question you are asking of the data is something that can be done with a different approach as you mentioned.
Hi Carl,
Just wondering how to add two date columns for same slicer?
I’ve two calculated columns and slicer date I’m using one date column.
Issue is when I select date range only one date column is displayed correctly other some dates are missing.
Any idea how to display combined dates graph using one slicer
Hi Savio,
In addition to Carl’s solution, if we want to display/filter two different date columns from the same date dimension/column, we need relationships like this:
1. Date dimension (Date) -> Fact Table 1 (order date)
2. Date dimension (Date) -> Fact Table 2 (ship date)
3. Fact Table 1 (bidirectional relationship with) Fact Table 2
Hi Carl,
Sorry if my question looks silly. But after created a duplicate table use-relationship function not needed for the calculations correct? a direct relationship between OrderByshipdate and Dates will do the thing?
Hey Carl,
Thanks for the post! Always nice to see visual representation of the processes taking place. Adding to this – would be awesome to see the model view for a visual understanding of what active/inactive relationships look like; and, how the tables are related. Hope some updates are in the pipeline 🙂
Thanks again!