In Power BI, we may want to compare periods with our data to create reports such as year over year comparisons. Power BI offers several DAX time intelligence functions. In this post we will look at SAMEPERIODLASTYEAR.
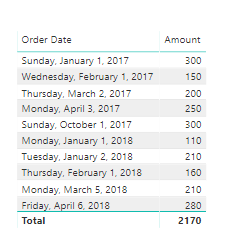
Let’s say we have an Orders table that contains orders for the last 2 years. The table contains an Order Date and a Ship Date:
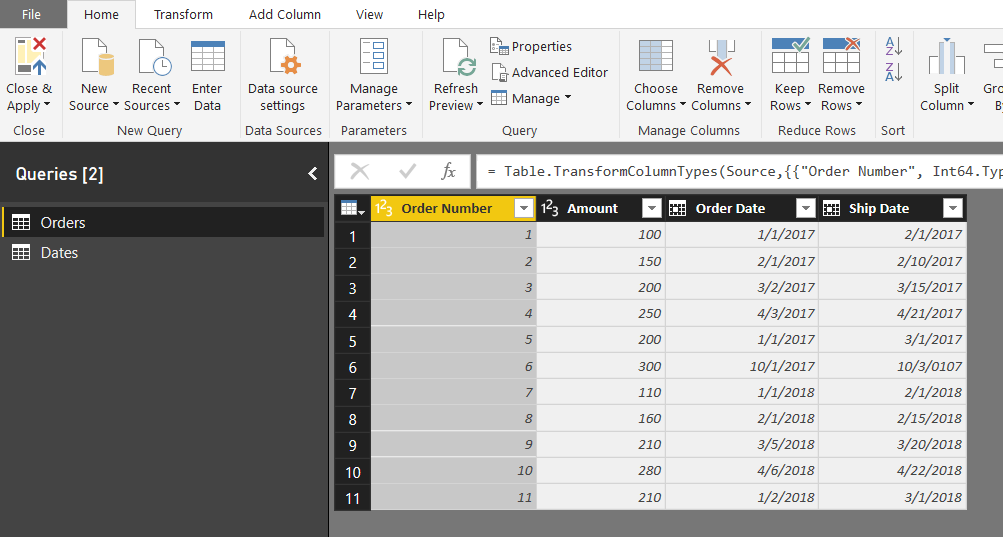
We also have a standard Dates table.
Now let’s say we want to compare this year’s sales to last year’s sales.
First, create a measure for the total sales:
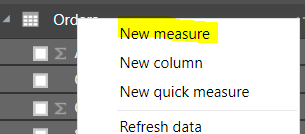
Formula:
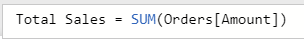
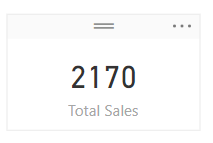
Total Sales = SUM('Orders'[Amount])We can see, the total sales amount is 2170:
Now let’s use SAMEPERIODLASTYEAR to create a new measure. This will be based on the measure we just created, Total Sales, and we will use the SAMEPERIODLASTYEAR function based on dates:
![]()
Total Sales Last Year = CALCULATE([Total Sales], SAMEPERIODLASTYEAR(Dates[Date]))
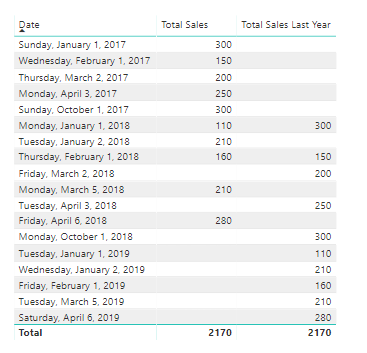
Now let’s drag across the Date from the date table, with the Total Sales and Total Sales Last Year measures. You can see we are comparing each day’s current year and previous year, for example, on February 1st, there was an amount of 160 this year and 150 last year:
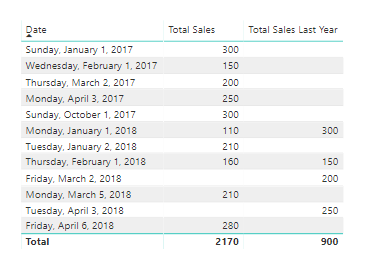
Now, if we want to filter this so that it only shows results before today, we can use:
Total Sales Last Year = CALCULATE(CALCULATE([Total Sales], SAMEPERIODLASTYEAR(Dates[Date])), FILTER(Dates, Dates[Date] < TODAY()))
and
Total Sales = CALCULATE(SUM(Orders[Amount]), FILTER(Dates, Dates[Date] < TODAY()))
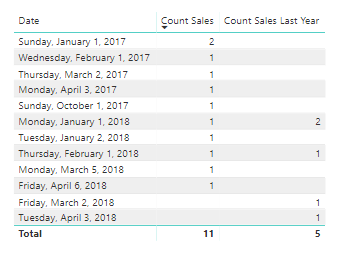
We can create count measures to see the comparisons as well:
Count Sales = CALCULATE(COUNT(Orders[Order Number]), FILTER(Dates, Dates[Date] < TODAY()))
And:
Count Sales Last Year = CALCULATE(CALCULATE([Count Sales], SAMEPERIODLASTYEAR(Dates[Date])), FILTER(Dates, Dates[Date] < TODAY()))
Produces below. You can see on January 1st 2018, there was 1 sale, and 2 in the previous period (January 1st, 2017):
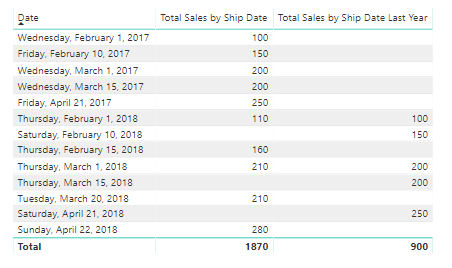
If you want to compare additional date relationships, you can do the following. For example, we can add a new field called Total Sales by Ship Date, which uses the field Ship Date:
Total Sales by Ship Date = CALCULATE(CALCULATE (
    SUM ( Orders[Amount] ),
    USERELATIONSHIP (
        Orders[Ship Date],
        Dates[Date]
    )
)
, FILTER(Dates, Dates[Date] < TODAY()))
And add a Total Sales by Ship Date Last Year using SAMEPERIODLASTYEAR:
Total Sales by Ship Date Last Year = CALCULATE(CALCULATE([Total Sales by Ship Date], SAMEPERIODLASTYEAR(Dates[Date])), FILTER(Dates, Dates[Date] < TODAY()))
This produces:
If you would like to replace the blanks with 0, you can use the ISBLANK() DAX function.
I AM SPENDING MORE TIME THESE DAYS CREATING YOUTUBE VIDEOS TO HELP PEOPLE LEARN THE MICROSOFT POWER PLATFORM.
IF YOU WOULD LIKE TO SEE HOW I BUILD APPS, OR FIND SOMETHING USEFUL READING MY BLOG, I WOULD REALLY APPRECIATE YOU SUBSCRIBING TO MY YOUTUBE CHANNEL.
THANK YOU, AND LET'S KEEP LEARNING TOGETHER.
CARL

Carl this phenomenal! I cannot tell you how long that I’ve been wrapped up in trying to figure this out! Thank you, thank you, thank you!
Great Mike! Good luck with your project.
Hi Carl,
I have a similar question but with a different data set, where the data is in vertical format and can’t be changed/ transposed as I have created charts using the same format. I need to calculate YoY % change for each KPI. I was wondering if this could be done using DAX formula:
Customer KPI unit Period Value
Verizon Total revenue USD million Q1/2016 29029
Verizon Total revenue USD million Q1/2017 27959
Verizon Capex USD million Q1/2016 10029
Verizon Capex USD million Q1/2017 8959
Bharti Total revenue USD million Q1/2016 34567
Bharti Total revenue USD million Q1/2017 33000
Bharti Capex USD million Q1/2016 15222
Bharti Capex USD million Q1/2017 13655
Please help me out if you can. Appreciate your time and help.
Thanks,
Sometimes someone just has the ability to explain something simply. I wasted 30 minutes on Youtube videos and 15 minutes on other posts.
And then this! Fantastic.. So well explained!
Thanks Nic, I appreciate it!
Hi Carl,
Please can you help me with Year on Year (%) Change DAX Formula in Power BI.
I am trying to calculate (%) Change Year on Year, say Year 2013 – Year 2019.
Thanks.
Eghosa
Hi Eghosa,
Please see this link – https://carldesouza.com/power-bi-year-over-year-using-sameperiodlastyear/
Thanks,
Carl
Hi
How can i show trend in last couple of years, may be stupid question, but i am new to power BI,
Say i want to show 2017 June, 2018 June and 2019 June in one chart, ability to change the month
Dear Carl,
This has been very helpful!, do you have any tutorial for the YoY% comparing this year vs last year?
This is the order i need to appear in power bi, however, the YoY% repeats twice in the table, i only want it in the last column comparing those periods.
Example:
This Year Last Year %Variation
1,000 500 50%
Thank you in advance!
Hi,
You have to create 2 measures for TotalSales & LY Sales. and then YOY%
YOY% = DIVIDE(([TotalSales]-[LY sales]),[LY sales])
Thanks
Hi Carl, this is quite simple when you have one value for each date, but as soon as I have broken my data by country, and by week, region and so many other columns so that the same date is 100x repeated, how do I manage to pull the same info for the same period that belongs to the same region, Q, etc…
take this as a base
FY Q Quarter Date Dollars Country Wk
FY18 Q1 Q118 31/01/2018 1 US 1
FY18 Q2 Q218 30/04/2018 2 US 1
FY18 Q3 Q318 31/07/2018 3 US 1
FY18 Q4 Q418 31/10/2018 4 US 1
FY19 Q1 Q119 31/01/2019 5 US 1
FY19 Q2 Q219 30/04/2019 6 US 1
FY19 Q3 Q319 31/07/2019 7 US 1
FY19 Q4 Q419 31/10/2019 8 US 1
FY20 Q1 Q120 31/01/2020 9 US 1
FY20 Q2 Q220 30/04/2020 10 US 1
FY20 Q3 Q320 31/07/2020 11 US 1
FY20 Q4 Q420 31/10/2020 12 US 1
FY21 Q1 Q121 31/01/2121 13 US 1
FY21 Q2 Q221 30/04/2121 14 US 1
FY21 Q3 Q321 31/07/2121 15 US 1
FY21 Q4 Q421 31/10/2121 16 US 1
FY18 Q1 Q118 31/01/2018 1 US 2
FY18 Q2 Q218 30/04/2018 2 US 2
FY18 Q3 Q318 31/07/2018 3 US 2
FY18 Q4 Q418 31/10/2018 4 US 2
FY19 Q1 Q119 31/01/2019 5 US 2
FY19 Q2 Q219 30/04/2019 6 US 2
FY19 Q3 Q319 31/07/2019 7 US 2
FY19 Q4 Q419 31/10/2019 8 US 2
FY20 Q1 Q120 31/01/2020 9 US 2
FY20 Q2 Q220 30/04/2020 10 US 2
FY20 Q3 Q320 31/07/2020 11 US 2
FY20 Q4 Q420 31/10/2020 12 US 2
FY21 Q1 Q121 31/01/2121 13 US 2
FY21 Q2 Q221 30/04/2121 14 US 2
FY21 Q3 Q321 31/07/2121 15 US 2
FY21 Q4 Q421 31/10/2121 16 US 2
FY18 Q1 Q118 31/01/2018 1 Canada 1
FY18 Q2 Q218 30/04/2018 2 Canada 1
FY18 Q3 Q318 31/07/2018 3 Canada 1
FY18 Q4 Q418 31/10/2018 4 Canada 1
FY19 Q1 Q119 31/01/2019 5 Canada 1
FY19 Q2 Q219 30/04/2019 6 Canada 1
FY19 Q3 Q319 31/07/2019 7 Canada 1
FY19 Q4 Q419 31/10/2019 8 Canada 1
FY20 Q1 Q120 31/01/2020 9 Canada 1
FY20 Q2 Q220 30/04/2020 10 Canada 1
FY20 Q3 Q320 31/07/2020 11 Canada 1
FY20 Q4 Q420 31/10/2020 12 Canada 1
FY21 Q1 Q121 31/01/2121 13 Canada 1
FY21 Q2 Q221 30/04/2121 14 Canada 1
FY21 Q3 Q321 31/07/2121 15 Canada 1
FY21 Q4 Q421 31/10/2121 16 Canada 1
FY18 Q1 Q118 31/01/2018 1 Canada 2
FY18 Q2 Q218 30/04/2018 2 Canada 2
FY18 Q3 Q318 31/07/2018 3 Canada 2
FY18 Q4 Q418 31/10/2018 4 Canada 2
FY19 Q1 Q119 31/01/2019 5 Canada 2
FY19 Q2 Q219 30/04/2019 6 Canada 2
FY19 Q3 Q319 31/07/2019 7 Canada 2
FY19 Q4 Q419 31/10/2019 8 Canada 2
FY20 Q1 Q120 31/01/2020 9 Canada 2
FY20 Q2 Q220 30/04/2020 10 Canada 2
FY20 Q3 Q320 31/07/2020 11 Canada 2
FY20 Q4 Q420 31/10/2020 12 Canada 2
FY21 Q1 Q121 31/01/2121 13 Canada 2
FY21 Q2 Q221 30/04/2121 14 Canada 2
FY21 Q3 Q321 31/07/2121 15 Canada 2
FY21 Q4 Q421 31/10/2121 16 Canada 2
Thanks!
superb Carl
It is not getting,
While i am using this
Total Sales Last Year = CALCULATE([Total Sales], SAMEPERIODLASTYEAR(Dates[Date]))
function it is getting the error.
Hi Teja,
Make sure you are using date from Dim-Date table.
If you still face issue, mention what error it is showing.
Thanks
Hi Carl
I want to calculate YOY SALES
Years are 2013 and 2012
I am using two measures to calculate this year and last years
Last Year Sales = CALCULATE(SUM(‘Sales Data'[TotalSalesAmount]),DISTINCT(‘Sales Data'[DateKey].[Year]))
this Year Sales = CALCULATE(SUM(‘Sales Data'[TotalSalesAmount]),DISTINCT(‘Sales Data'[DateKey].[Year]))
YOY Sales = DIVIDE([This Year Sales],[Last Year Sales])-1
BUT I AM GETTIONG 0 VALUE
MY Question is how my measures read years like 2013,2012
Hi, I want to calculate YoY sales but using the corresponding week number of the previous year rather than just the date. How do I go about this?
hi carl,
i have a doubt
yoy % in power bi scenario