In Power BI, a common requirement is to display progress towards meeting a goal. For example, if you want to track monthly progress of salespeople vs their targets.
To do this, first create a new Power BI report. In our example, we have 2 tables:
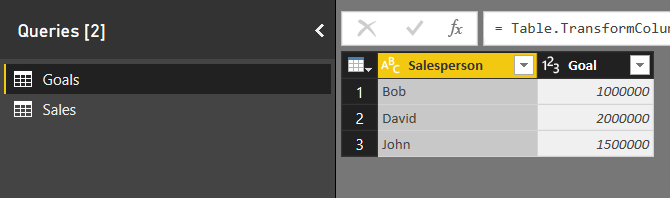
- Goals – which holds the targets for each salesperson
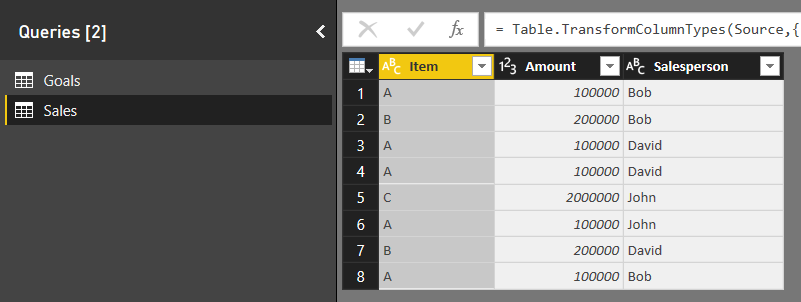
- Sales – which holds sales transaction records
We will keep this simple and not use dates. The tables have the following data. Each salesperson has different goals:
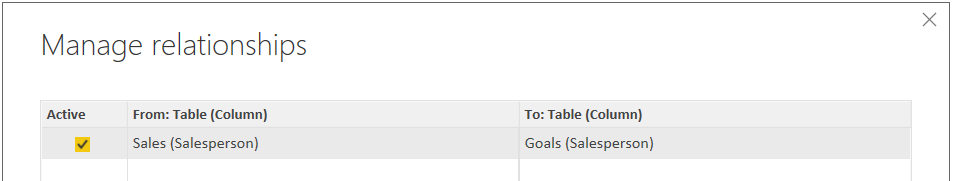
We will now add a relationship between the 2 tables:
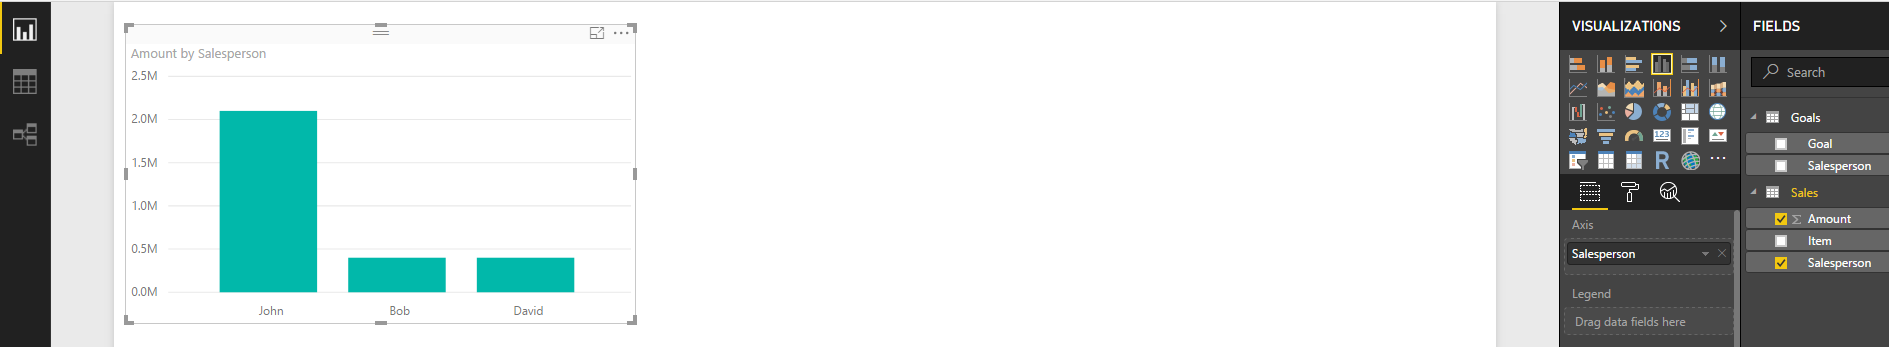
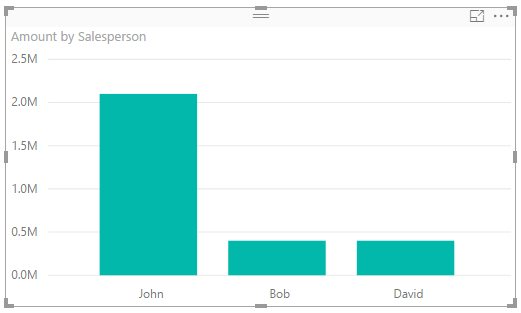
Now, if we add Salesperson and Amount to a column chart, we can see each Salesperson’s total amount. However, this does not show us how they are doing against their goal:
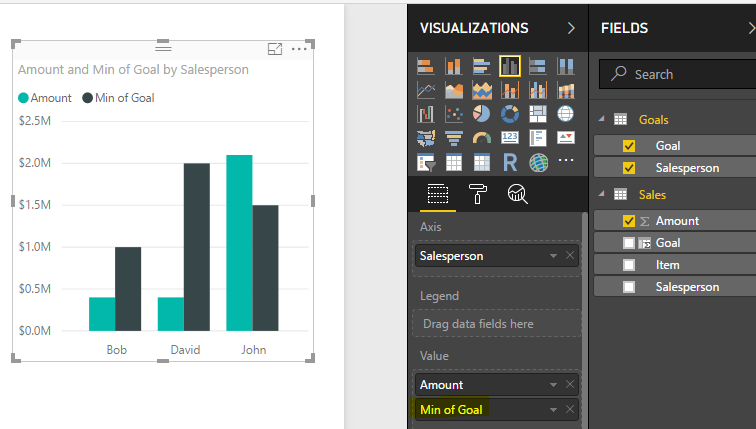
If we add the Goal field and set it to display the Min value, this displays our goals for each salesperson alongside their current progress:
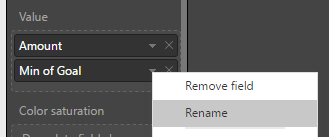
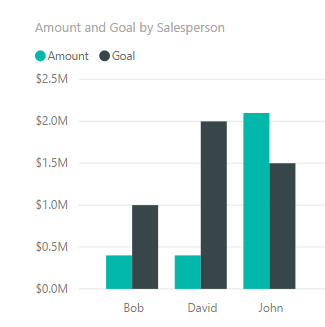
Which we can then rename to Goal:
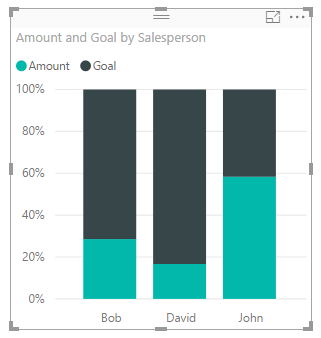
If we wanted to see how they are progressing as a percentage we can change this to a 100% Stacked Column chart:
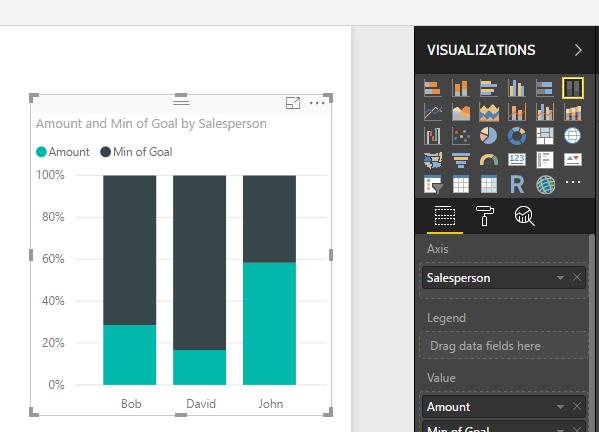
Renamed:
Note this example does not deal with dates, which I will cover in another post.
I AM SPENDING MORE TIME THESE DAYS CREATING YOUTUBE VIDEOS TO HELP PEOPLE LEARN THE MICROSOFT POWER PLATFORM.
IF YOU WOULD LIKE TO SEE HOW I BUILD APPS, OR FIND SOMETHING USEFUL READING MY BLOG, I WOULD REALLY APPRECIATE YOU SUBSCRIBING TO MY YOUTUBE CHANNEL.
THANK YOU, AND LET'S KEEP LEARNING TOGETHER.
CARL

How to do it when dates are involved?
Hi mate
You mentioned doing a follow up with dates? Has this been published at all?