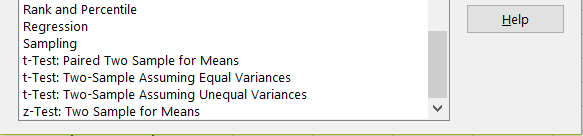
There is lots of functionality in the Excel Analysis ToolPak.
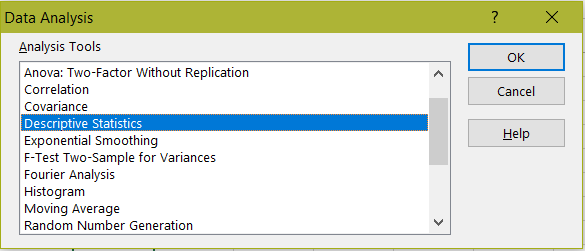
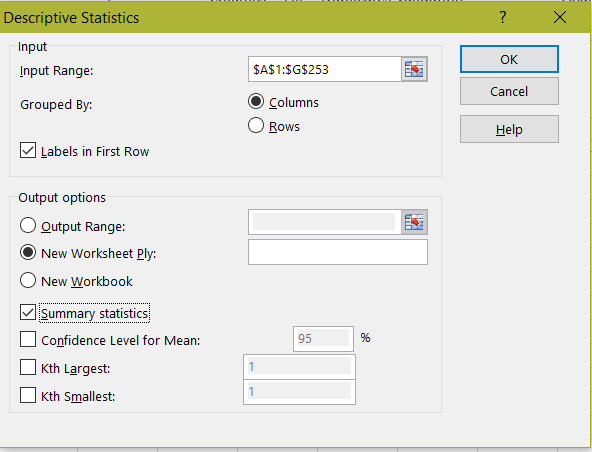
Let’s take a look at Descriptive Statistics. Let’s apply this to my data, which is MSFT stock prices over 2016. Select the input range and check labels in first row. Check summary statistics. This will go into a new tab on the worksheet.
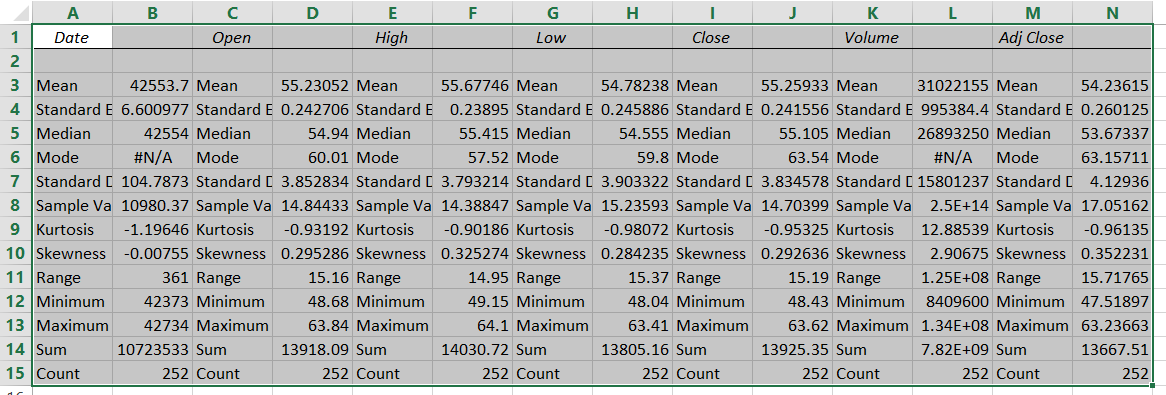
Excel has now generated the Descriptive Statistics:
THANKS FOR READING. BEFORE YOU LEAVE, I NEED YOUR HELP.
I AM SPENDING MORE TIME THESE DAYS CREATING YOUTUBE VIDEOS TO HELP PEOPLE LEARN THE MICROSOFT POWER PLATFORM.
IF YOU WOULD LIKE TO SEE HOW I BUILD APPS, OR FIND SOMETHING USEFUL READING MY BLOG, I WOULD REALLY APPRECIATE YOU SUBSCRIBING TO MY YOUTUBE CHANNEL.
THANK YOU, AND LET'S KEEP LEARNING TOGETHER.
CARL
