Power BI visualizations can be displayed inside Power Apps Portals using Liquid tags. In this post we will show how to set up Power Apps portals to enable the Power BI liquid tag to be used to embed Power BI visualizations inside Power Apps portals.
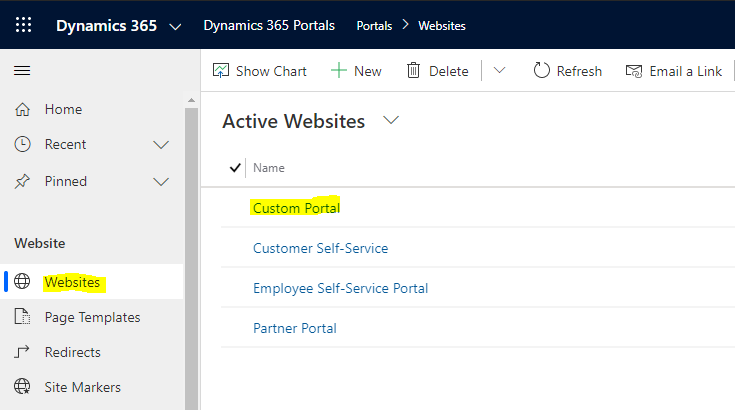
We will do this with a blank custom portal we created earlier. Let’s start on the Power BI side.
Power BI
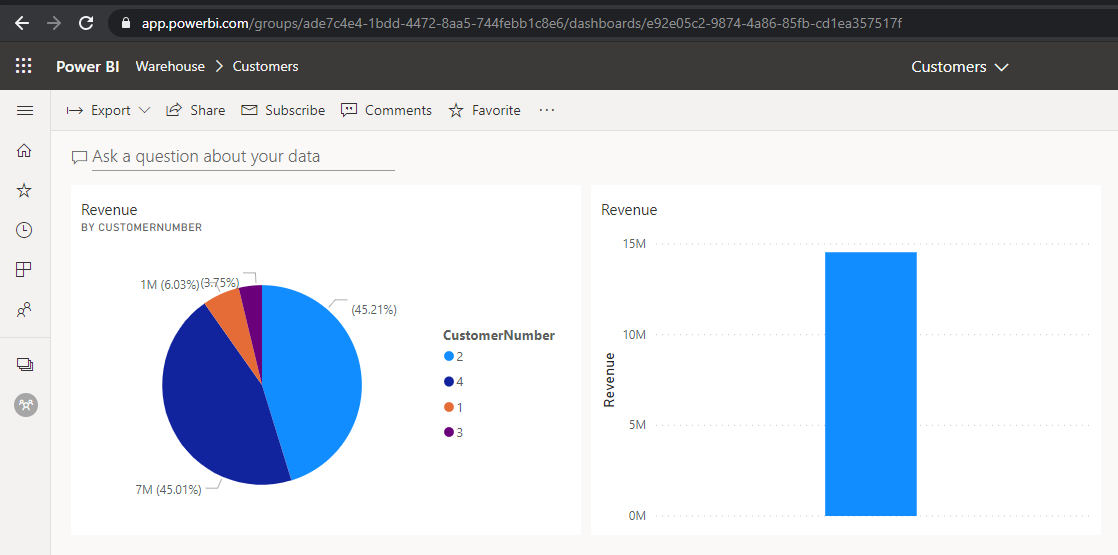
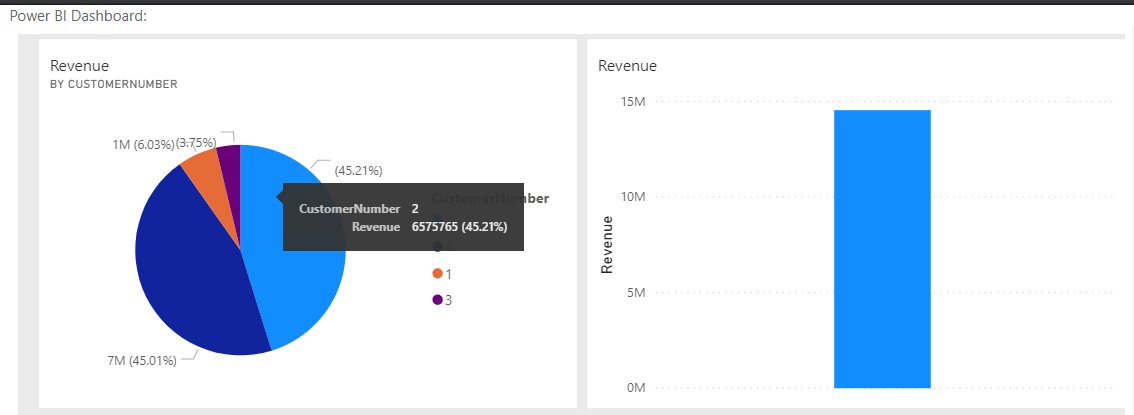
We have a Customers Dashboard in a Workspace that looks like below with the URL https://app.powerbi.com/groups/ade7c4e4-1bdd-4472-8aa5-744febb1c8e6/dashboards/e92e05c2-9874-4a86-85fb-cd1ea357517f. Note the URL in your case as we will use this later:
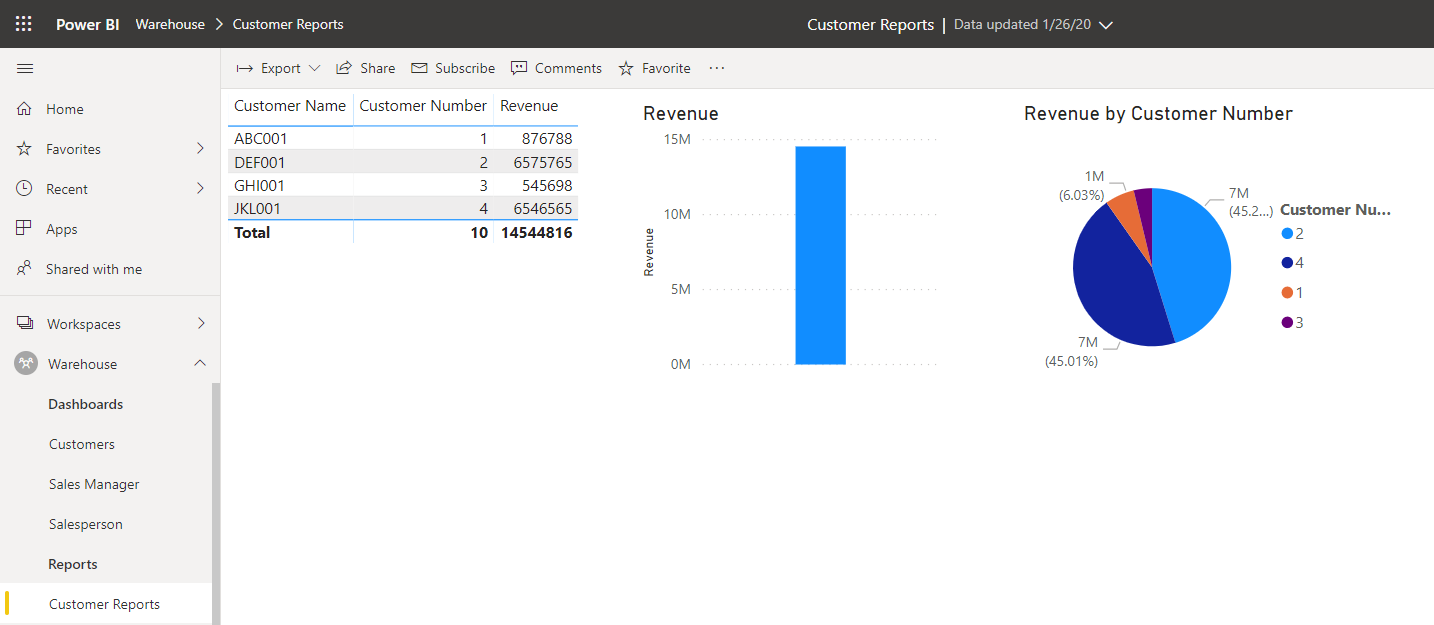
And a report with the URL https://app.powerbi.com/groups/ade7c4e4-1bdd-4472-8aa5-744febb1c8e6/reports/f979c710-1977-4598-9db2-74b5c801290c/ReportSection:
Power Apps Portals Setup
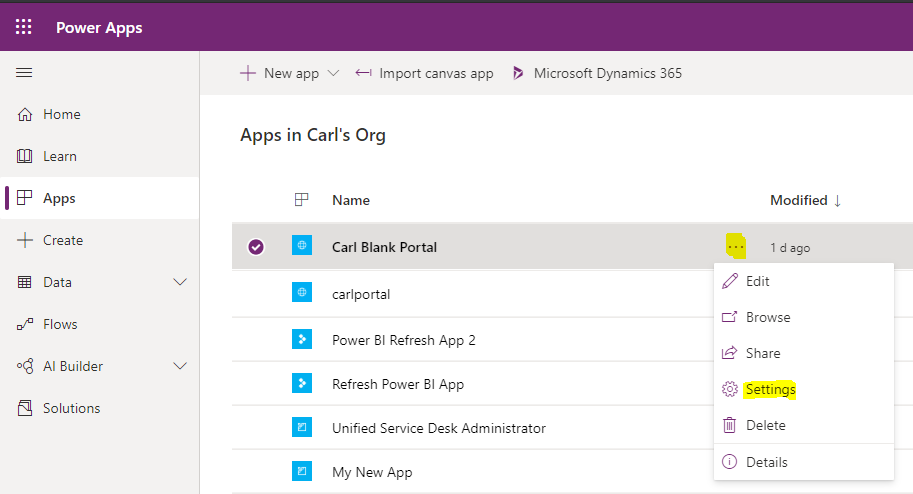
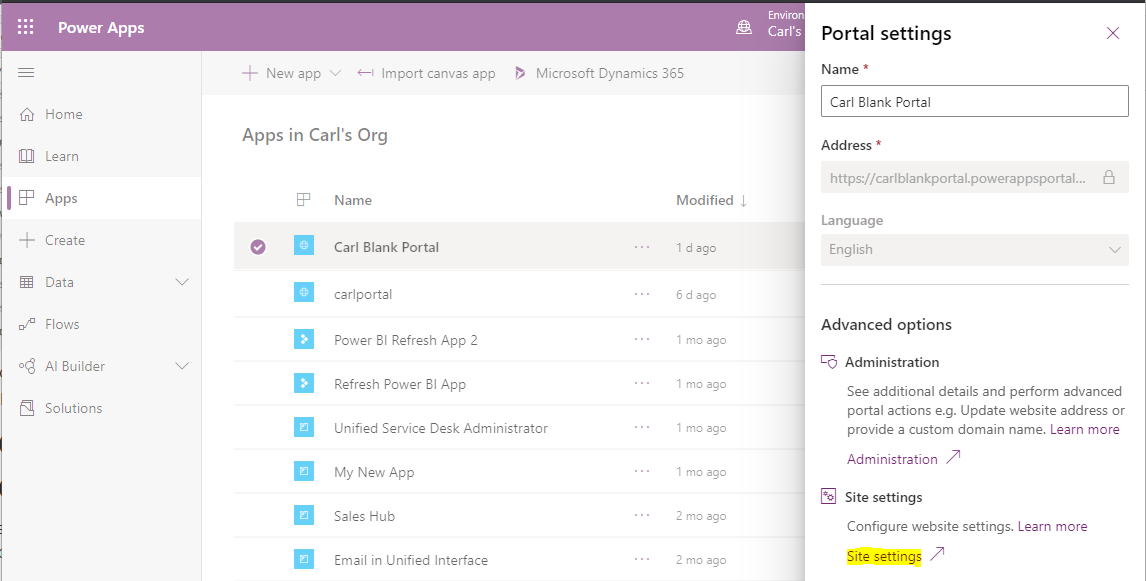
Go to the PowerApps Portals admin center by logging into https://make.powerapps.com/ and selecting your Portal app and clicking Settings:
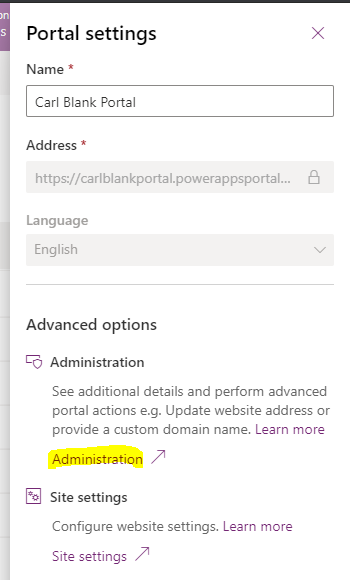
Then select Administration:
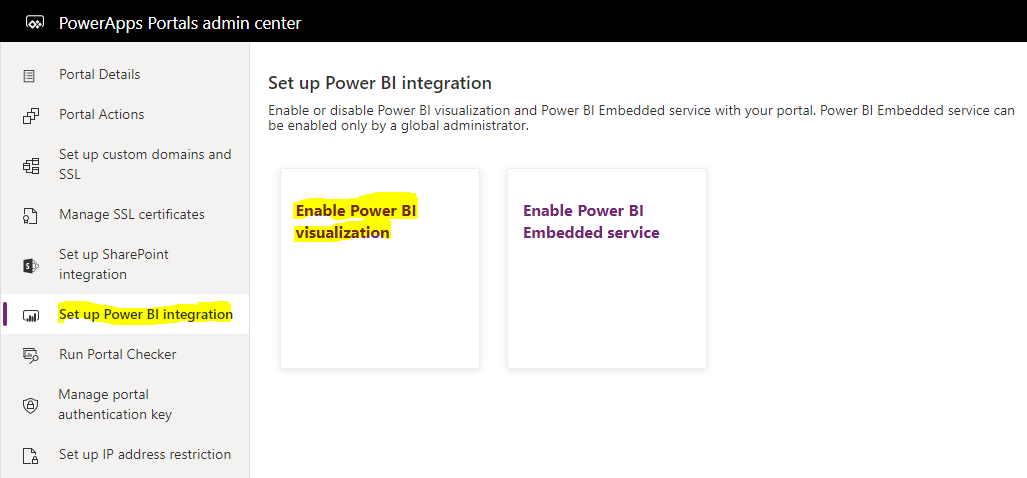
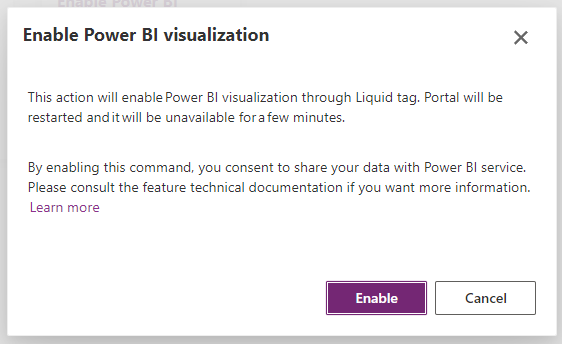
On the left, select Set up Power BI integration, then Enable Power BI visualization and click Enable:
Note the Learn more link takes you to https://docs.microsoft.com/en-us/powerapps/maker/portals/admin/set-up-power-bi-integration#privacy-notice:
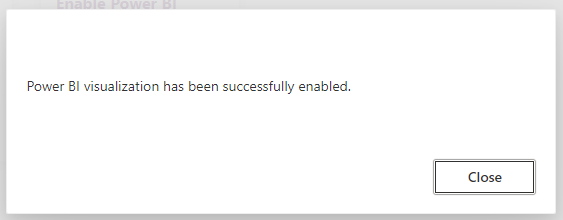
Power BI visualization has been successfully enabled.
Adding a Page in the Power Apps Portal
Let’s add a new menu item to the navigation in our Power Apps Portal, and then a page we will create that will display the embedded reports and dashboards.
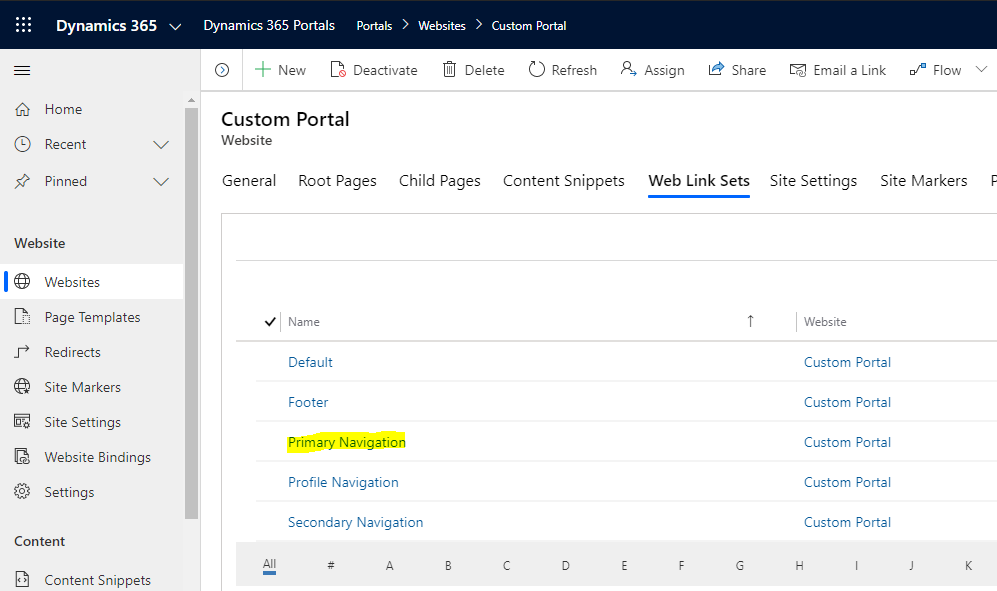
Go to Site Settings:
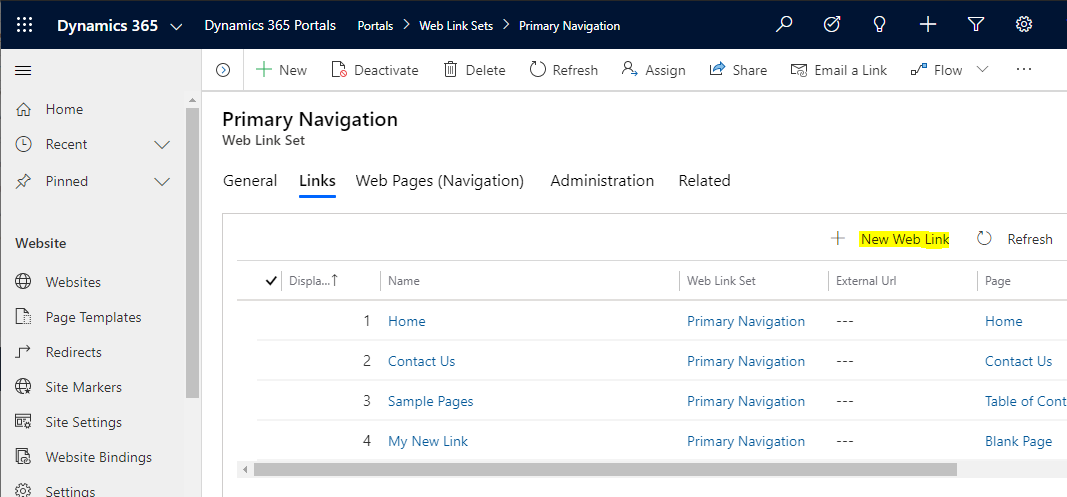
New Web Link:
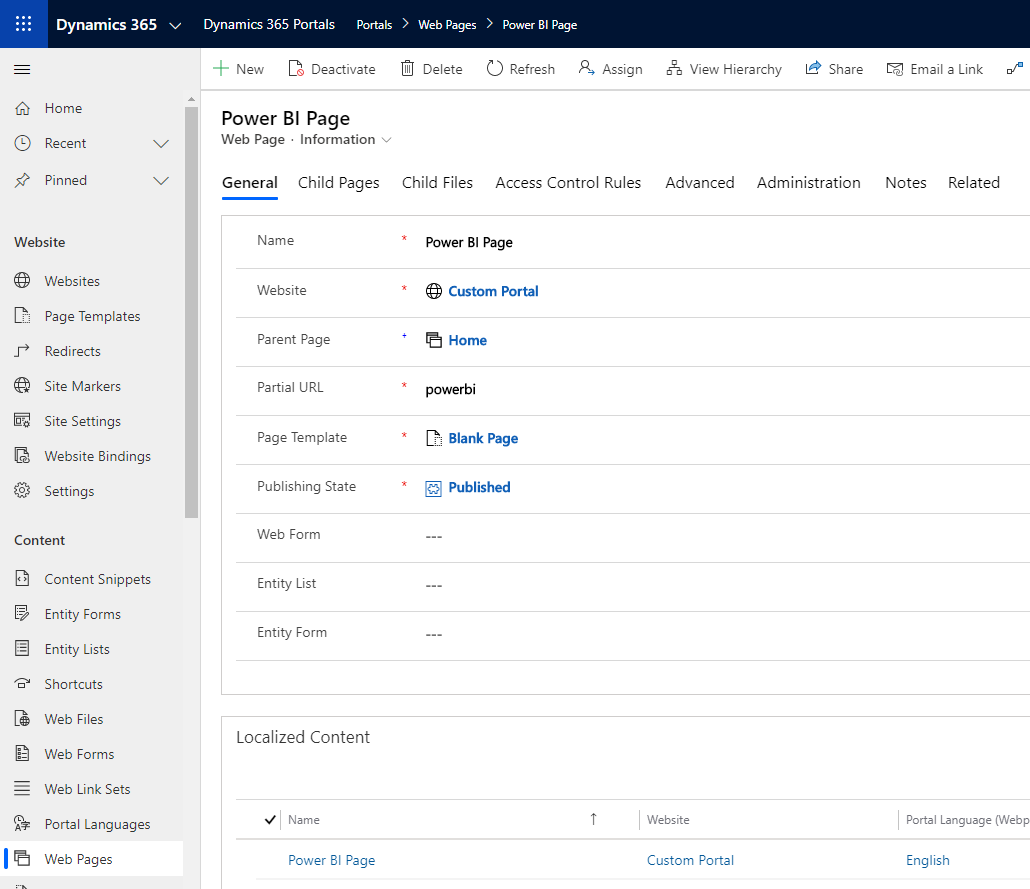
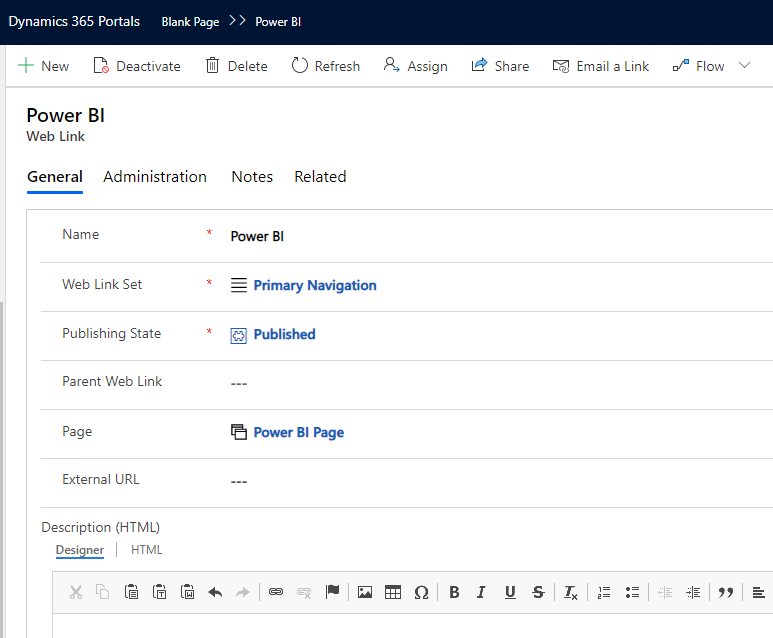
Create a new Web Link called Power BI, and we will set the Page to a New Web Page:
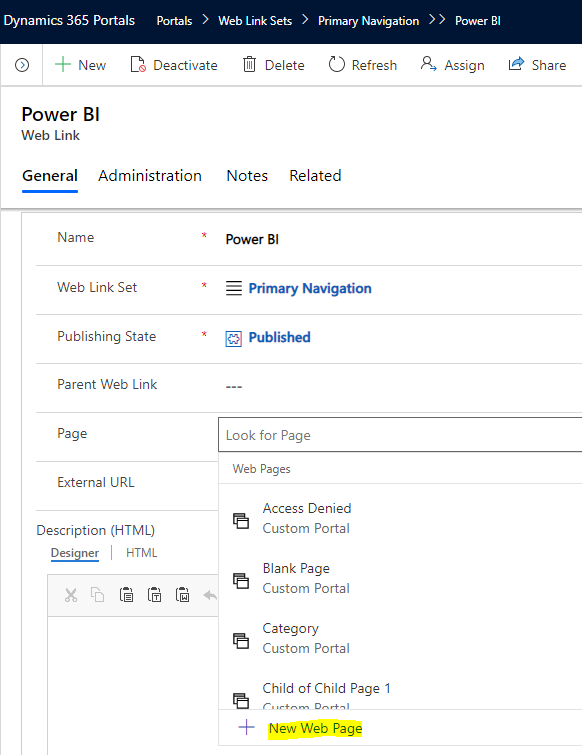
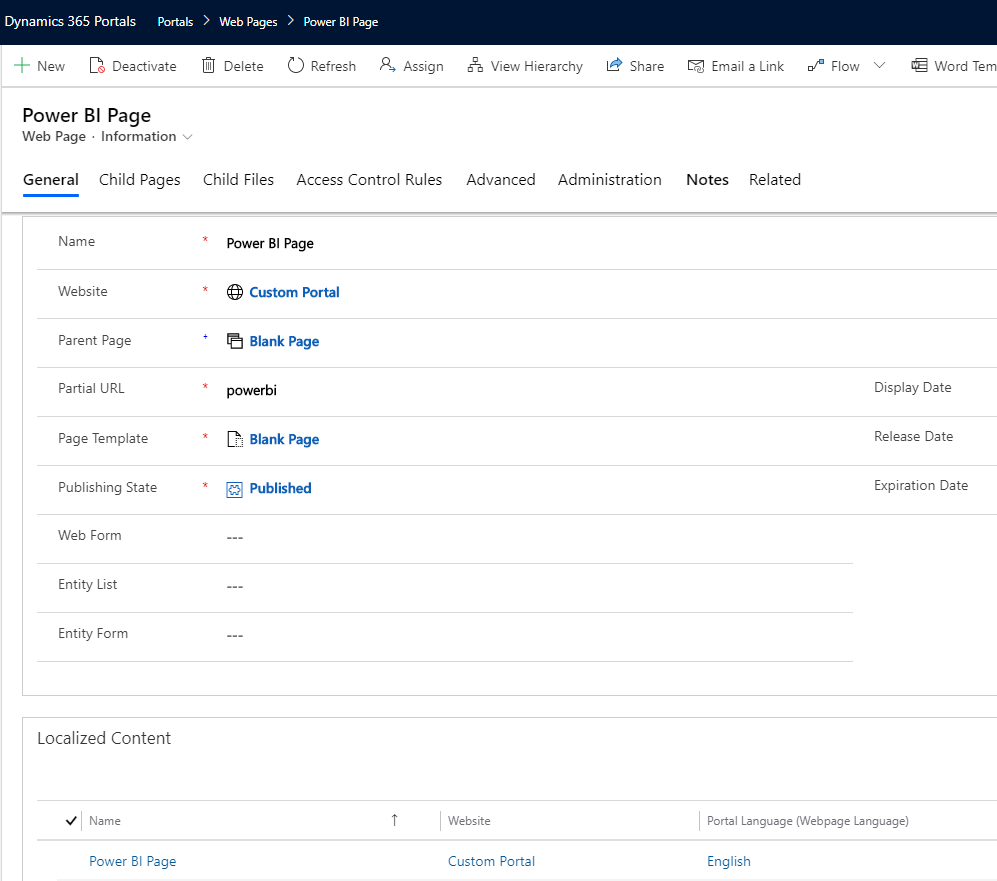
Create a New Web Page like below and Save it:
Save to enable localized content, then modify the created localized content:
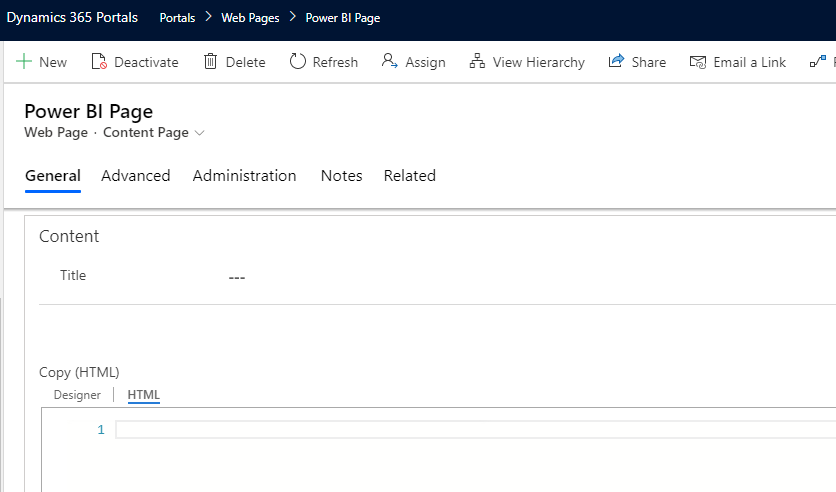
Open the Localized Content and select the HTML copy:
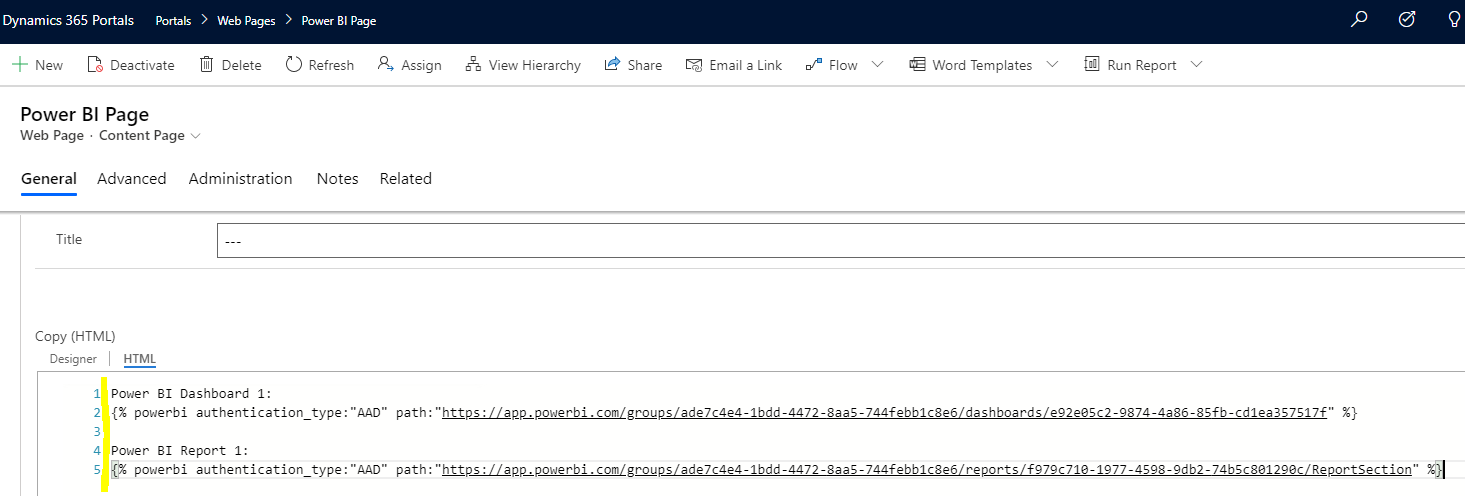
The liquid tag is in the format below, with the authentication type as aad (other types available are powerbiemdedded and anonymous). We will embed a dashboard and report:
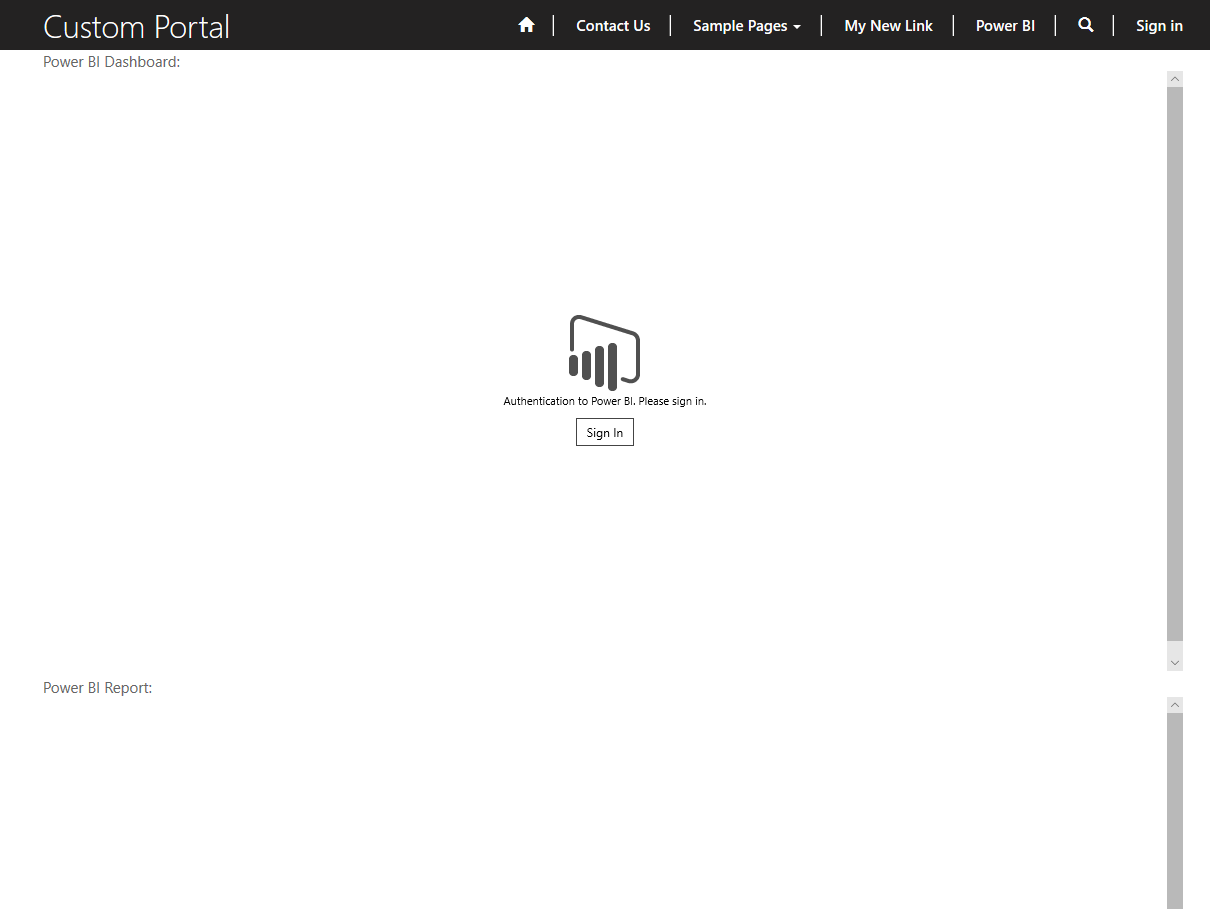
Power BI Dashboard:
{% powerbi authentication_type:"AAD" path:"https://app.powerbi.com/groups/ade7c4e4-1bdd-4472-8aa5-744febb1c8e6/dashboards/e92e05c2-9874-4a86-85fb-cd1ea357517f" %}

Power BI Report:
{% powerbi authentication_type:"AAD" path:"https://app.powerbi.com/groups/ade7c4e4-1bdd-4472-8aa5-744febb1c8e6/reports/f979c710-1977-4598-9db2-74b5c801290c/ReportSection" %}
Click Save. Ensure the Web Link uses the new Power BI Page type:
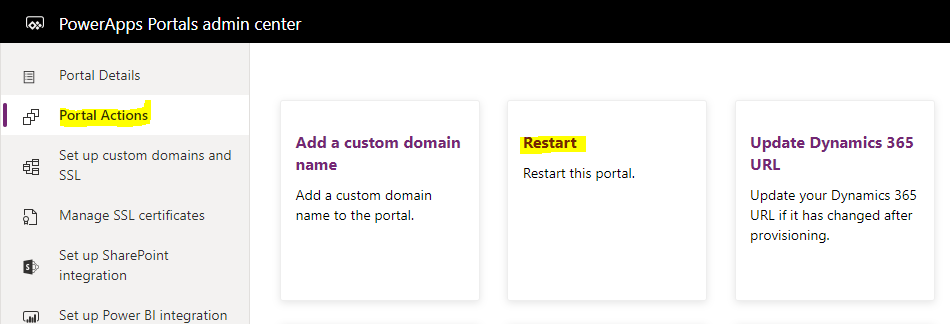
Restart the Portal and wait for the portal to come back up:
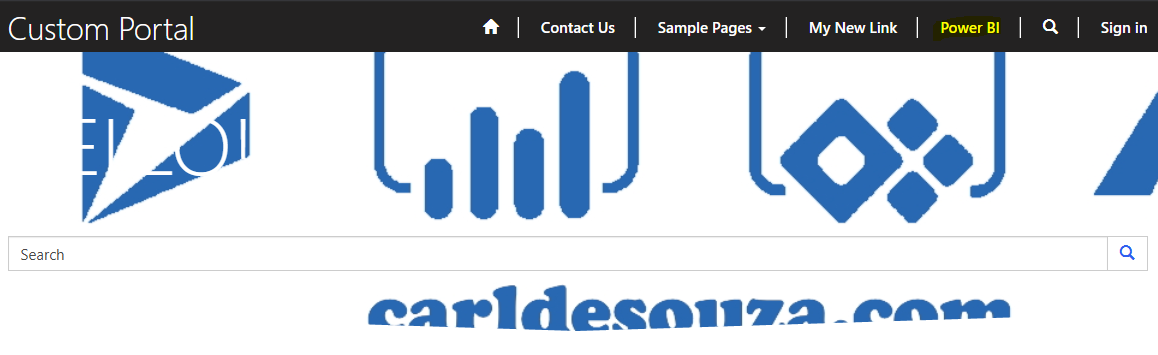
Once complete, you will see the new Power BI link in the upper right primary navigation.
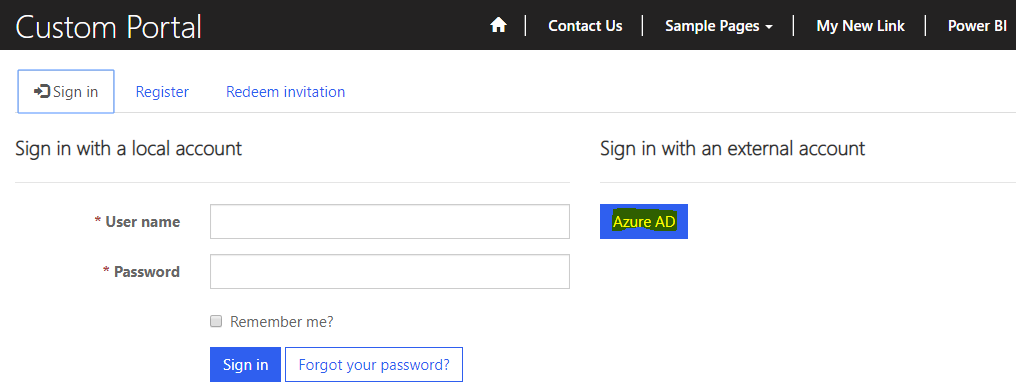
We see the Power BI icons in the page, with the message to Sign In to Power BI:
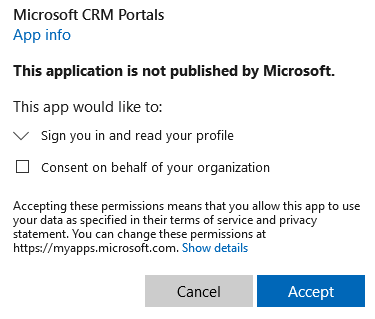
Let’s sign into the Portal first and authenticate with Azure AD:
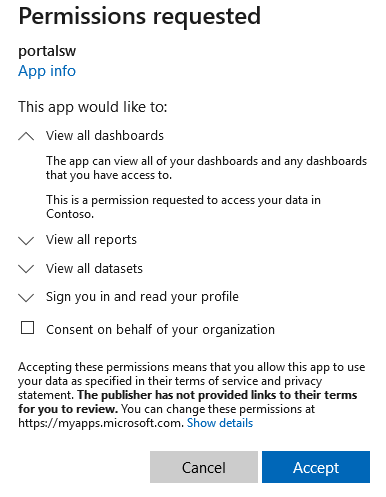
You may need to grant permissions:
And:
We now see our dashboards and reports displayed in the Power Apps portal through our Liquid tag:
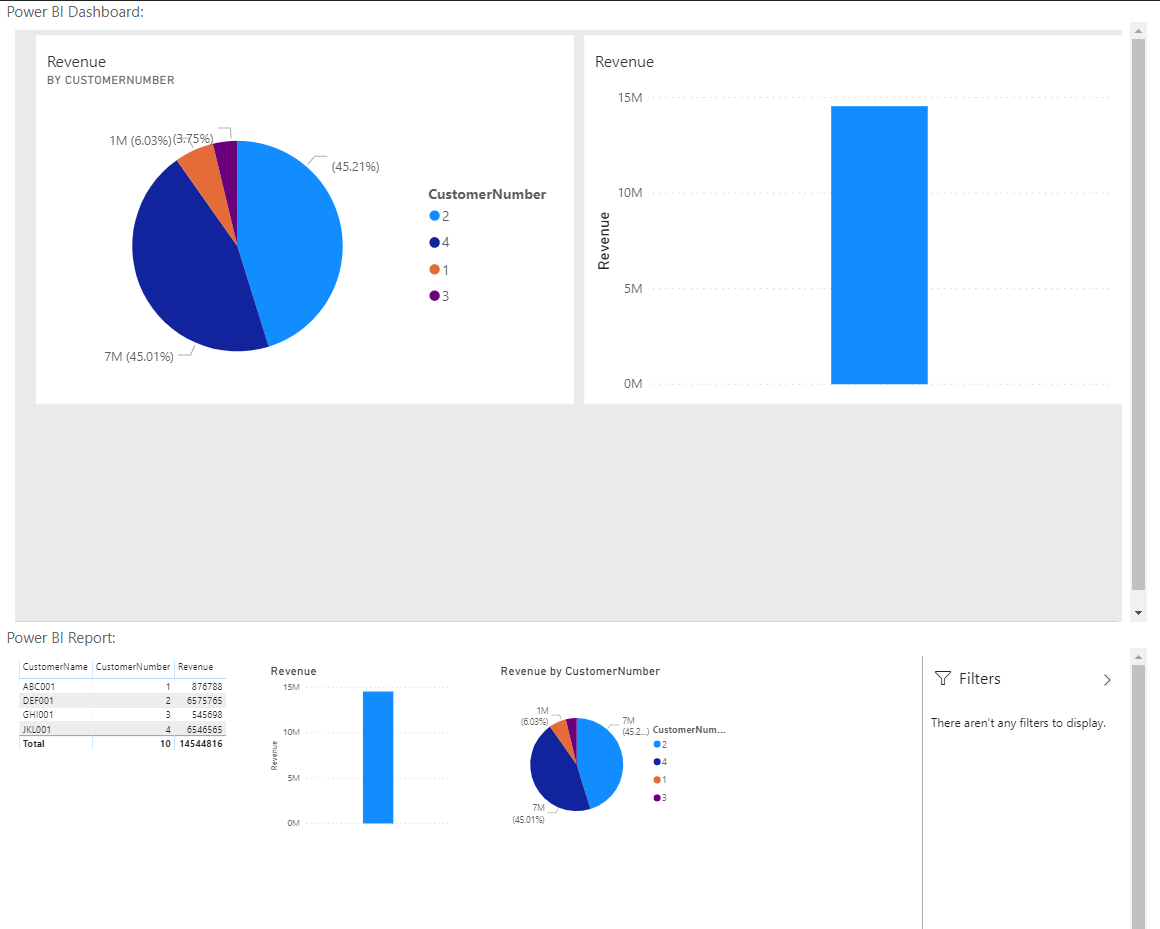
With the Dashboard we can zoom over the data to get more information, but we cannot click on the visuals:
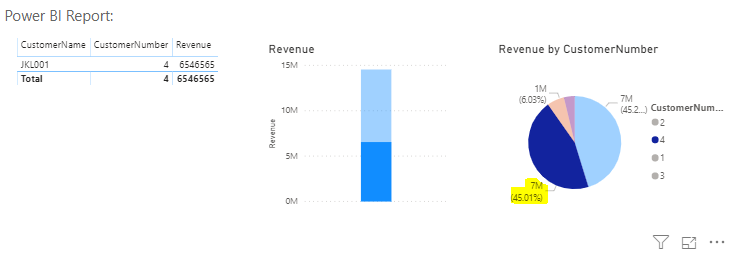
With the Reports, we can apply filtering:
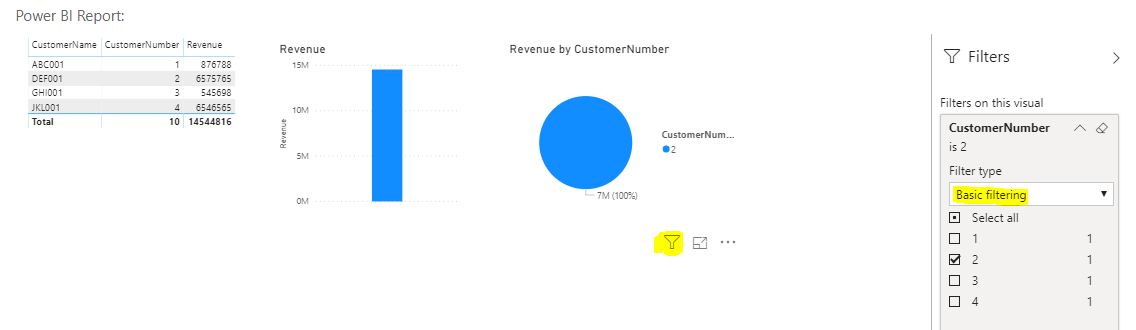
And click on data to filter other visuals:
I AM SPENDING MORE TIME THESE DAYS CREATING YOUTUBE VIDEOS TO HELP PEOPLE LEARN THE MICROSOFT POWER PLATFORM.
IF YOU WOULD LIKE TO SEE HOW I BUILD APPS, OR FIND SOMETHING USEFUL READING MY BLOG, I WOULD REALLY APPRECIATE YOU SUBSCRIBING TO MY YOUTUBE CHANNEL.
THANK YOU, AND LET'S KEEP LEARNING TOGETHER.
CARL

How do you pass for example the CRM account linked of the logged user as filter to Power BI report?
Thanks for your insightful post! Do you know how we can hide the page panel at the bottom of the embedded report?
Did you find a solution to this? I have the same issue.
Hello, do you know of any workaround to click on the visuals of a Dashboard so it drills into the related reports?