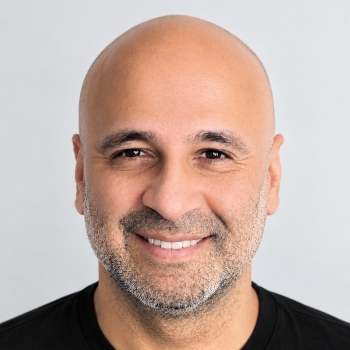
To debug TypeScript using Visual Studio Code, install the Debugger for Chrome, located at: https://marketplace.visualstudio.com/items?itemName=msjsdiag.debugger-for-chrome:
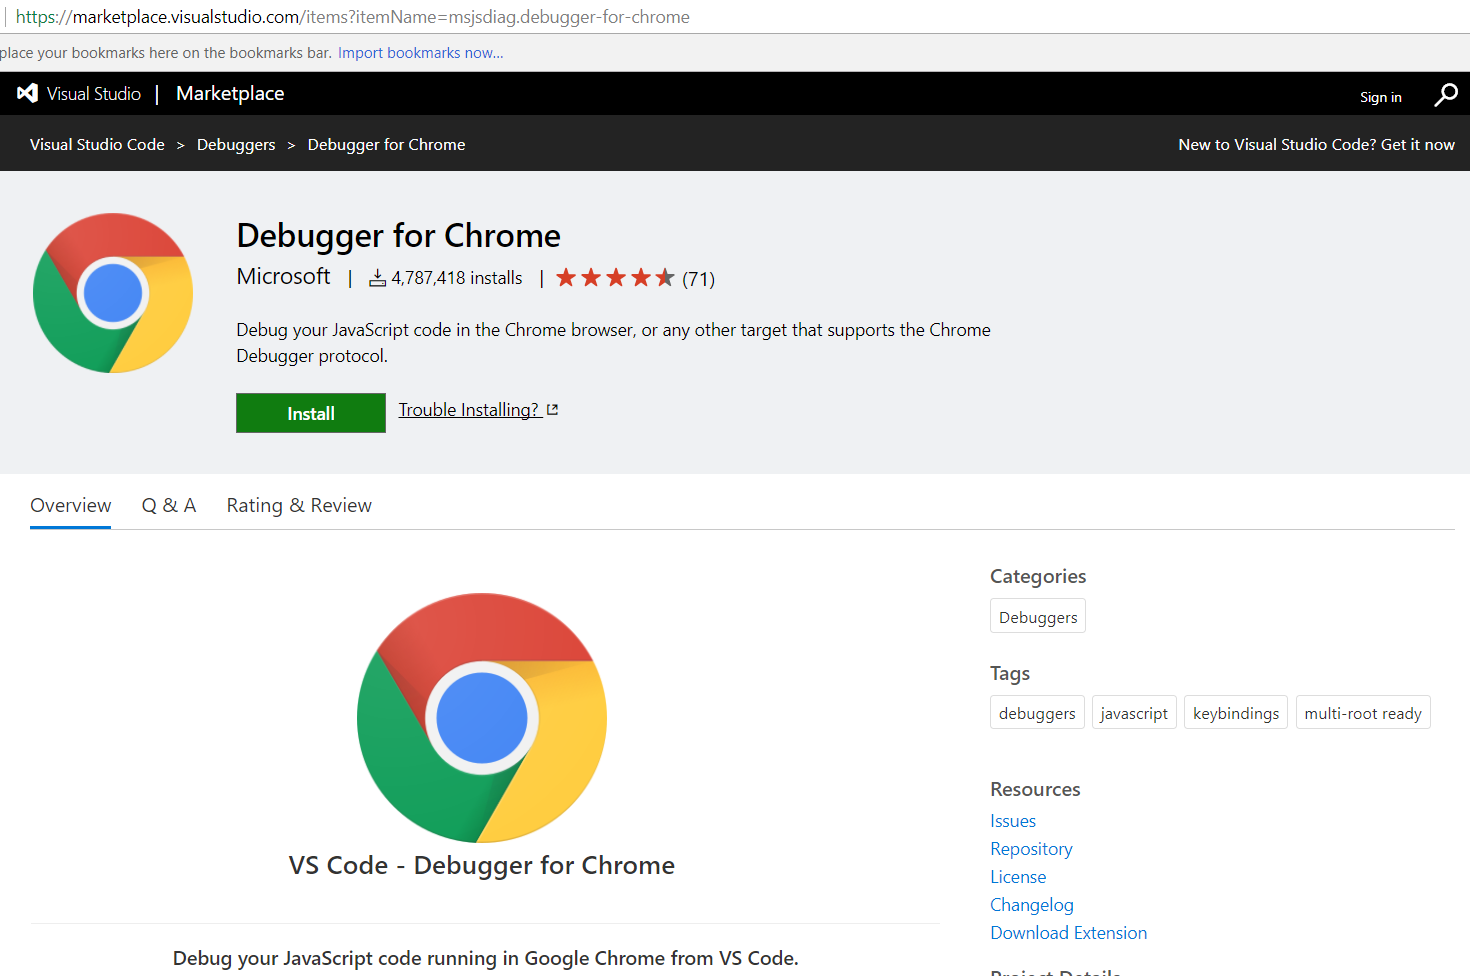
You will see the message:

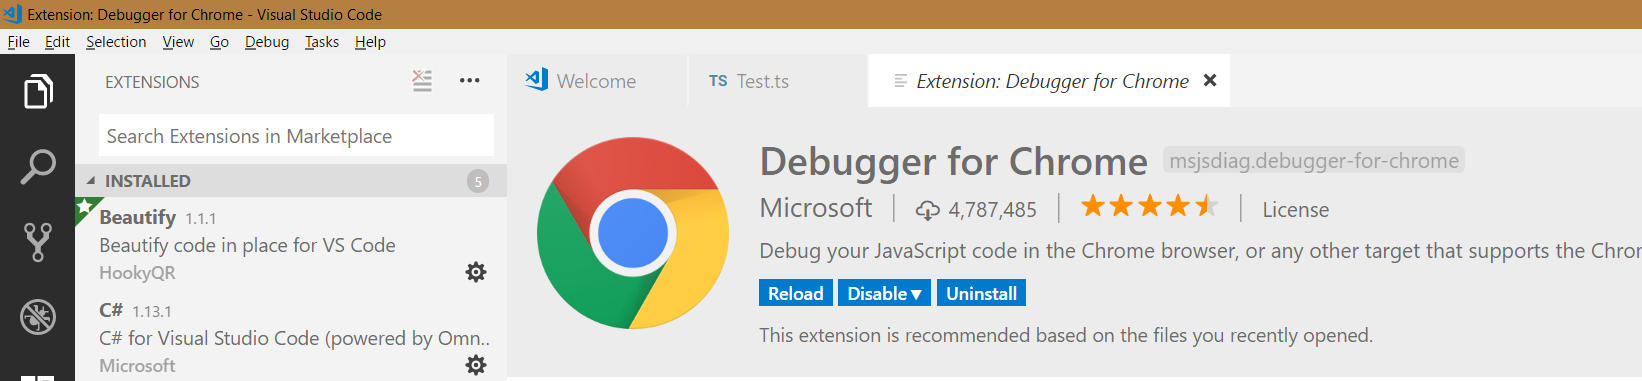
The debugger will now be installed:
Let’s say in our environment we have:
- A folder called TS with TypeScript files
- A TS file called HelloWorld.ts
Like below:
[sourcecode language=”javascript”] class Greeter {greeting: string;
constructor(message: string) {
this.greeting = message;
}
greet() {
return "Hello, " + this.greeting;
}
}
let greeter = new Greeter("world");
debugger;
let button = document.createElement(‘button’);
button.textContent = "Say Hello";
button.onclick = function() {
alert(greeter.greet());
}
document.body.appendChild(button);
[/sourcecode]
And we have an index.html page which calls the HelloWorld.ts file:
[sourcecode language=”html”] <html><head>
<title>Testing TypeScript</title>
</head>
<body>
<script src="HelloWorld.js"></script>
</body>
</html> [/sourcecode]
Now, update your tsconfig.json file like below:
[sourcecode language=”xml”] {"compilerOptions": {
"target": "es5",
"module": "commonjs",
"sourceMap": true,
"outFile": "${workspaceRoot}/Hello.js",
"outDir": "${workspaceRoot}"
}
}
[/sourcecode]
And the launch.json file:
[sourcecode language=”xml”] {// Use IntelliSense to learn about possible attributes.
// Hover to view descriptions of existing attributes.
// For more information, visit: https://go.microsoft.com/fwlink/?linkid=830387
"version": "0.2.0",
"configurations": [
{
"type": "chrome",
"request": "launch",
"name": "Launch Chrome against localhost",
"url": "http://localhost:8080",
"webRoot": "${workspaceRoot}",
"sourceMaps": true
}
] }
[/sourcecode]
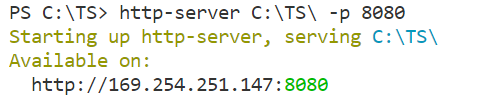
Now, if you are running Node and a web server, start the web server:
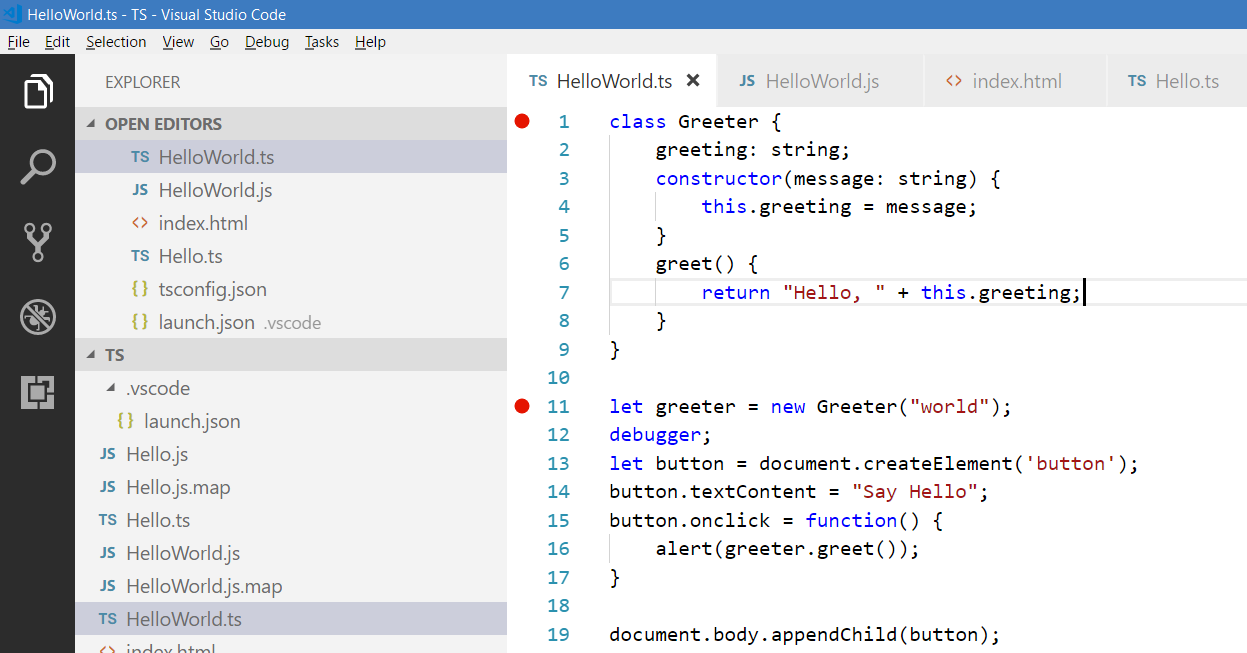
Set breakpoints in your HelloWorld.ts file:
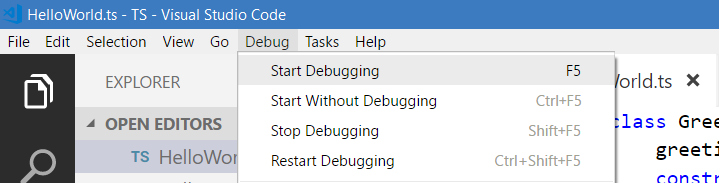
Now select Start->Debugging:
Chrome will open, with the message “Paused in Visual Studio Code”:

Note – if you do not see this, try to debug a second time.
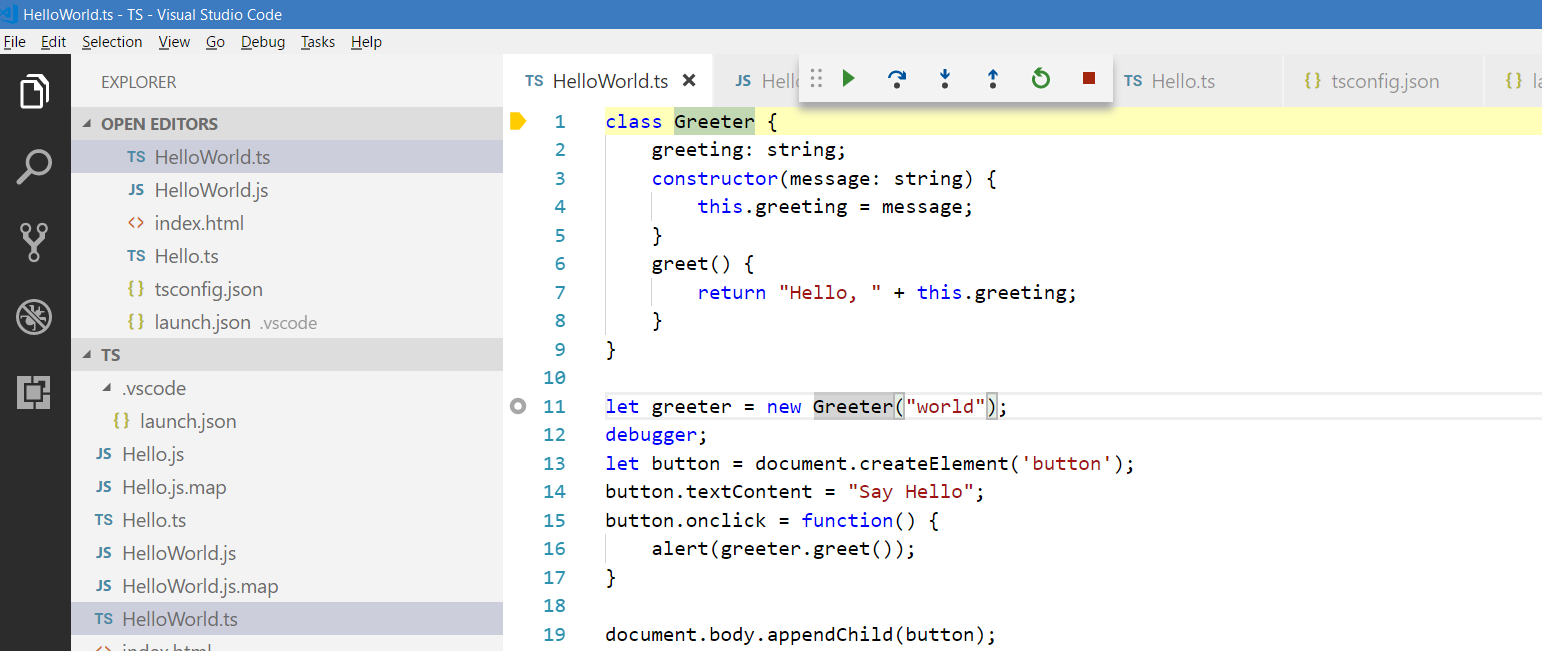
You can see the breakpoint has been hit in our TS file:

Explore AI, agents & Microsoft technology.
I share practical ideas, tutorials, and videos about AI, AI agents, Microsoft technologies, and the Power Platform.
Subscribe on YouTube →