In this post we will show how to debug JavaScript through the developer console. We will do this example in Chrome, and it works in similar ways for other browsers.
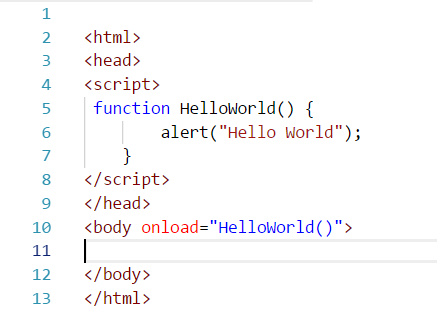
Consider the example where we have an HTML file with an embedded JavaScript function called HelloWorld():
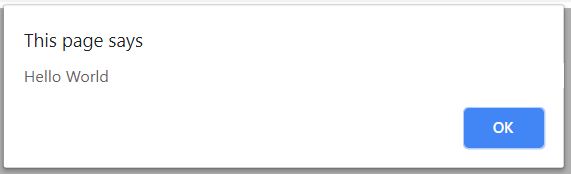
Running this simply produces an alert:
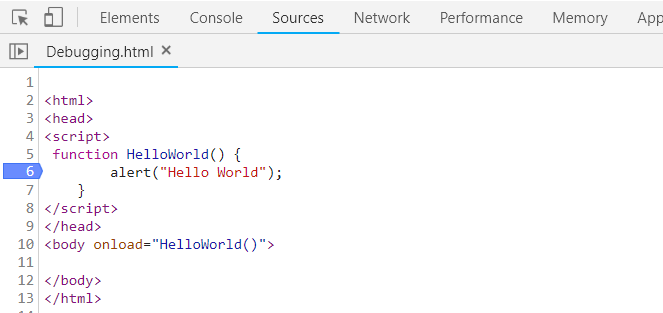
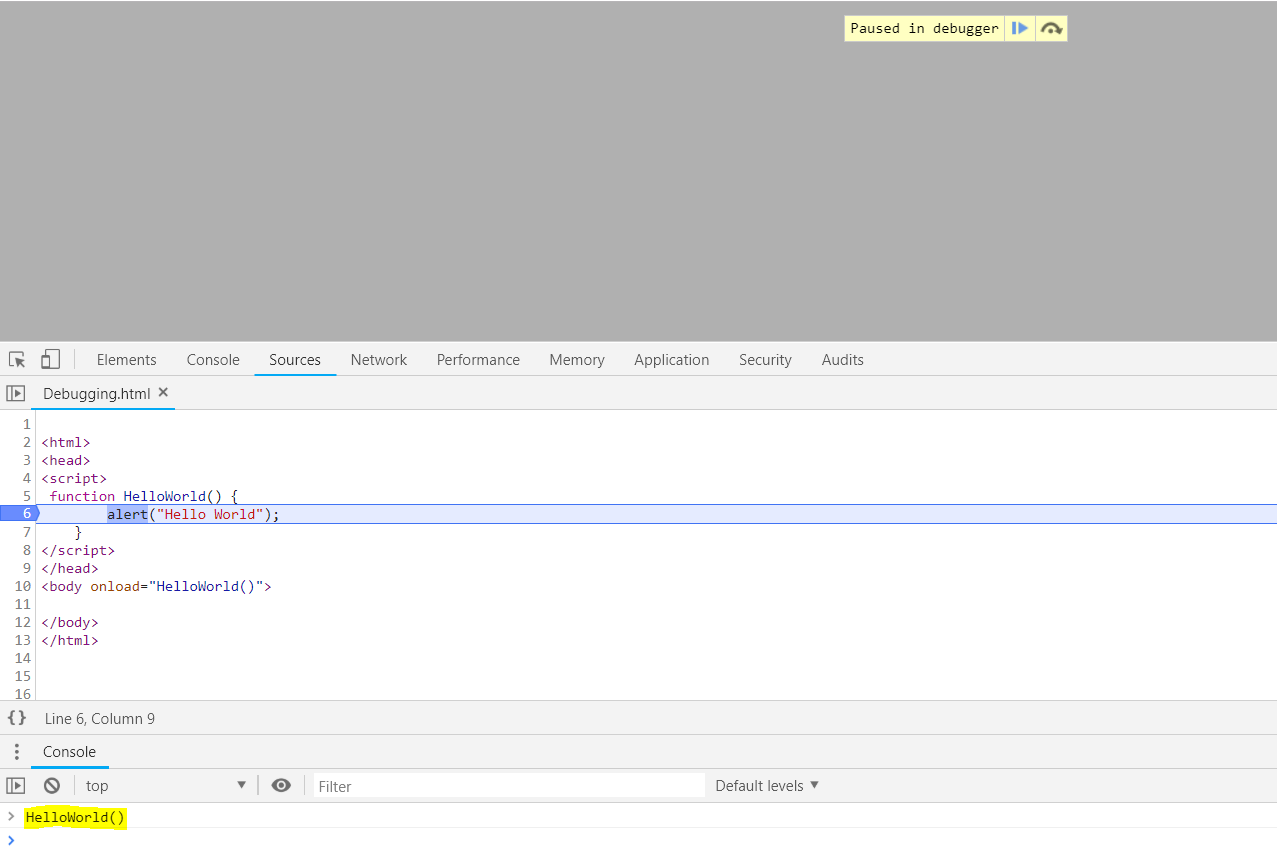
Now let’s open the debugger by pressing F12, and put a breakpoint on the code at line 6:
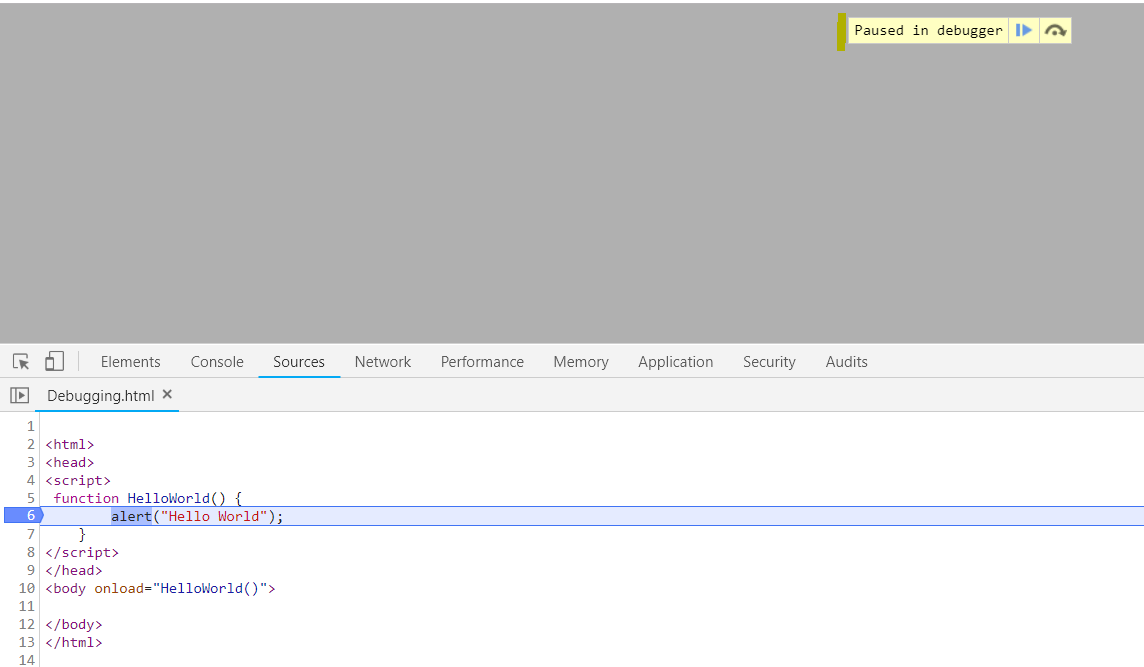
When we refresh the page, we can see our breakpoint is hit:
Press F8 to continue:

We can directly access our function from the console, which makes it useful for debugging. We can do this by typing the function name into the window:
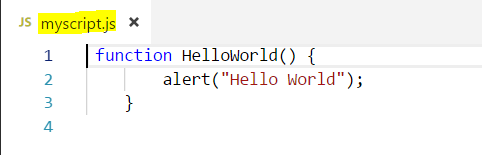
Now let’s save this function in a separate file called myscript.js to demonstrate calling functions in separate files.
Save as a separate file:
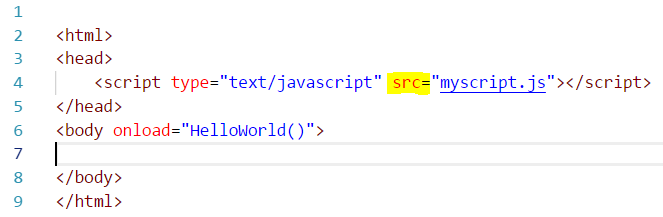
Let’s add a link to the new script, and keep the call to the function on loading:
On refreshing the page, we can see our breakpoint below is hit:
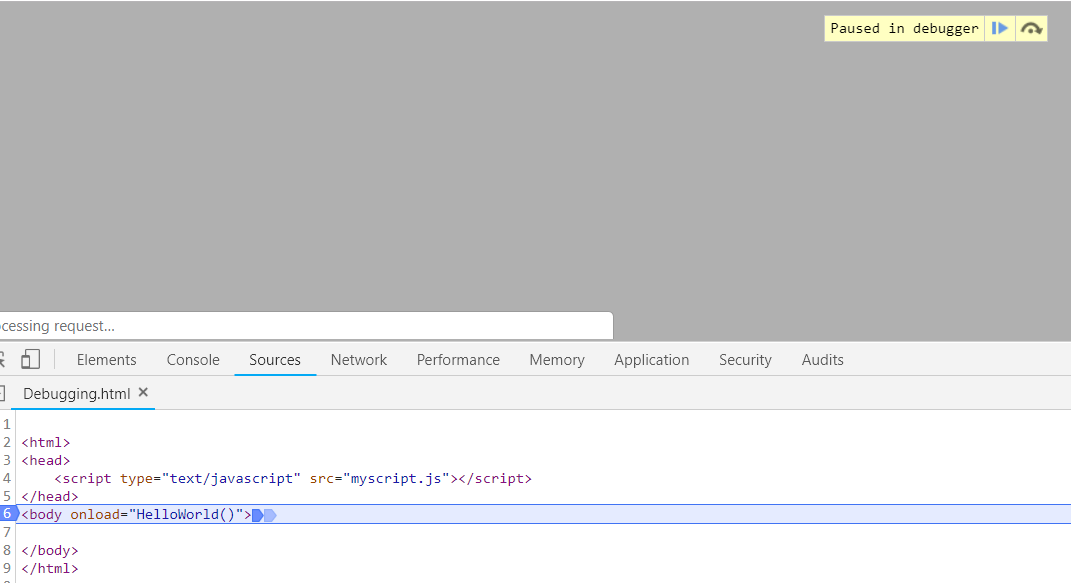
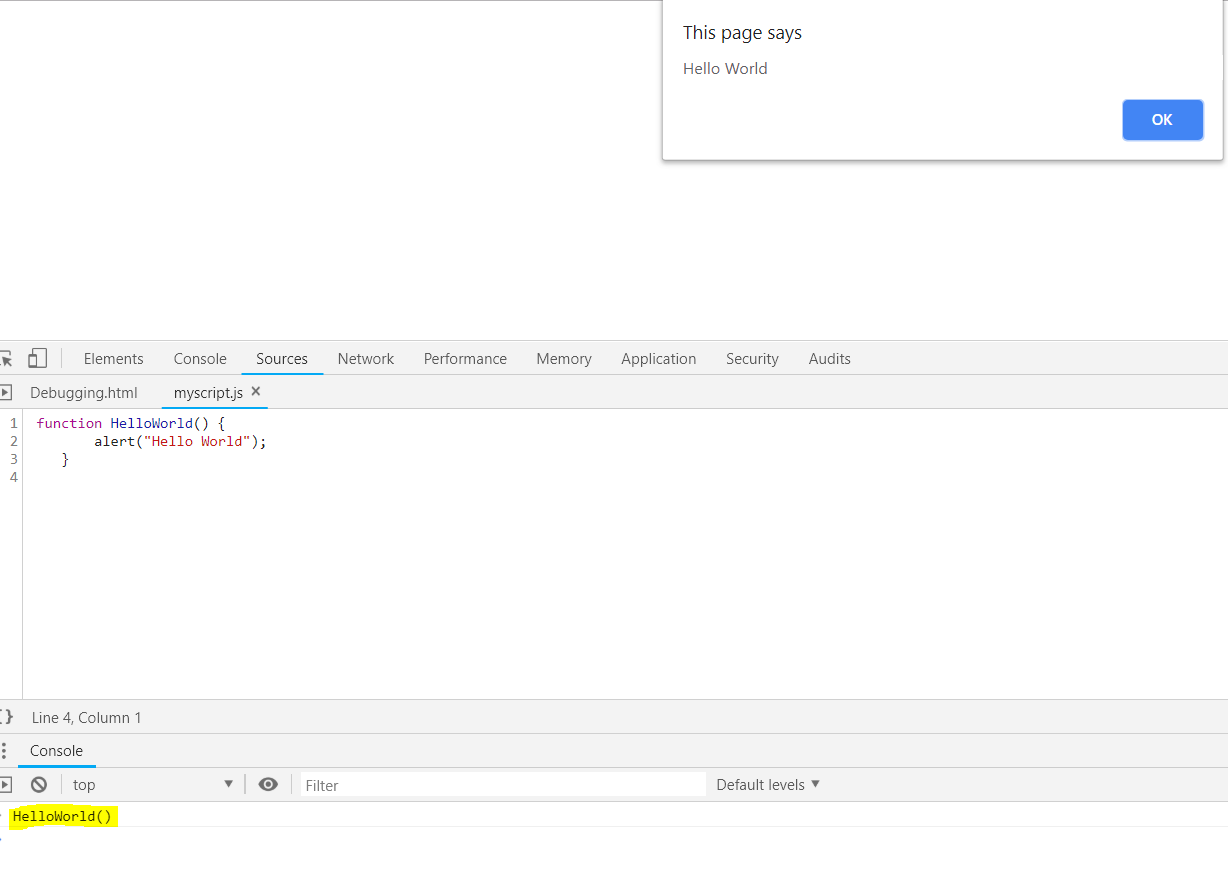
Press F11 to see the function called:
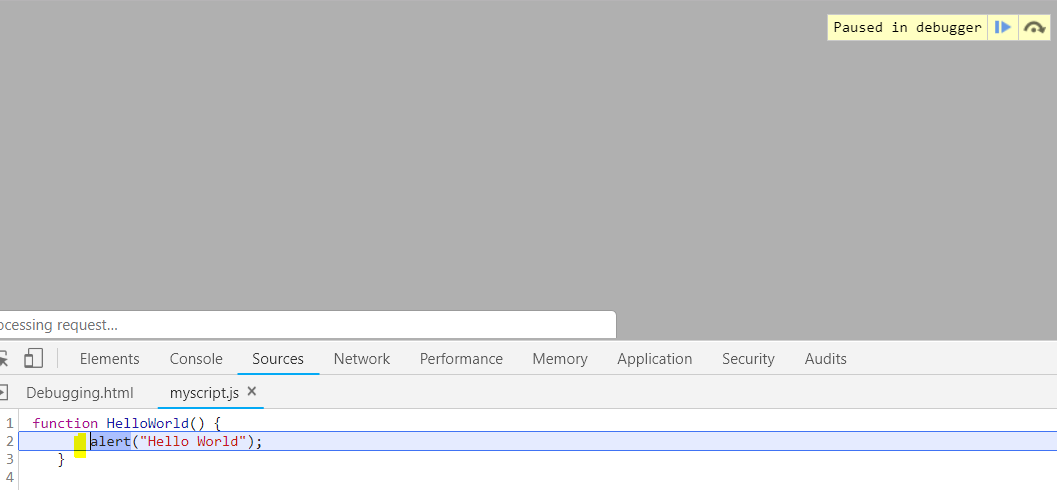
Now if we want to call the function directly from the console, we can reference it
I AM SPENDING MORE TIME THESE DAYS CREATING YOUTUBE VIDEOS TO HELP PEOPLE LEARN THE MICROSOFT POWER PLATFORM.
IF YOU WOULD LIKE TO SEE HOW I BUILD APPS, OR FIND SOMETHING USEFUL READING MY BLOG, I WOULD REALLY APPRECIATE YOU SUBSCRIBING TO MY YOUTUBE CHANNEL.
THANK YOU, AND LET'S KEEP LEARNING TOGETHER.
CARL
