In this post, we will go through creating a report in Power BI Report Server.
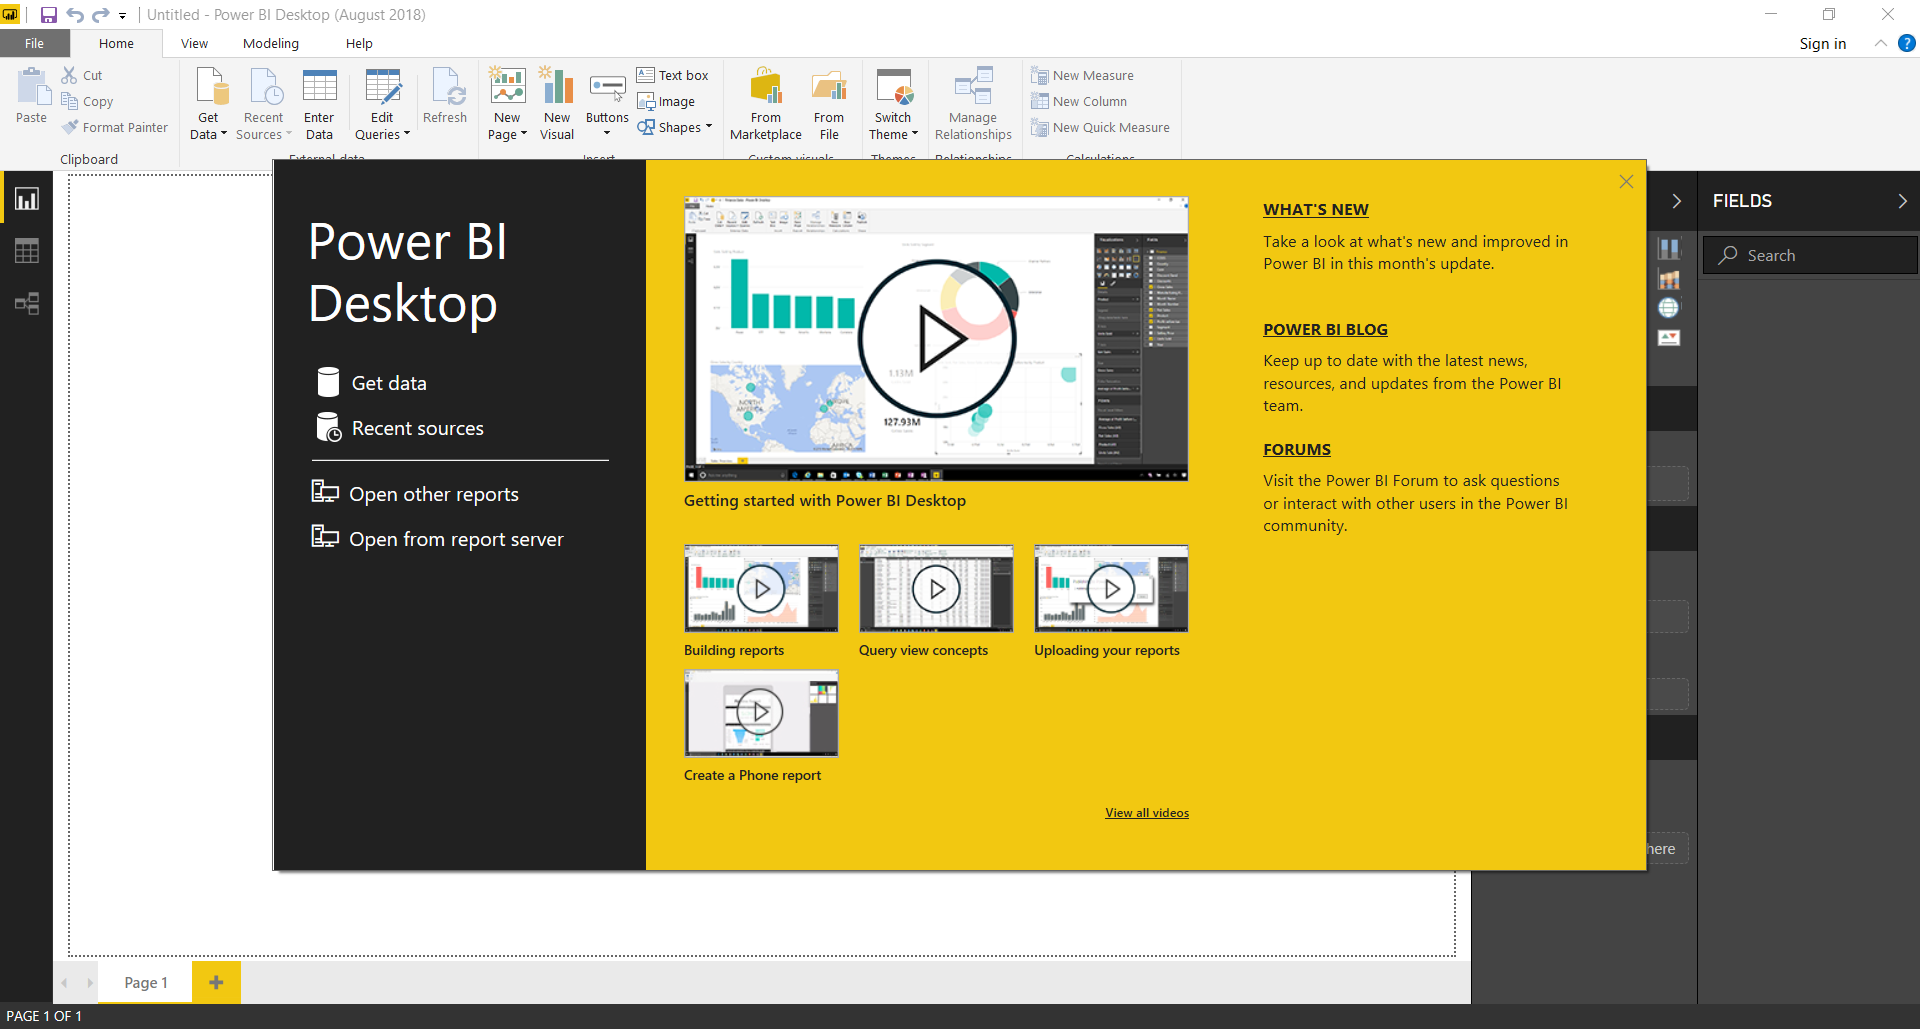
First, open Power BI Desktop for Report Server. Close the welcome window:
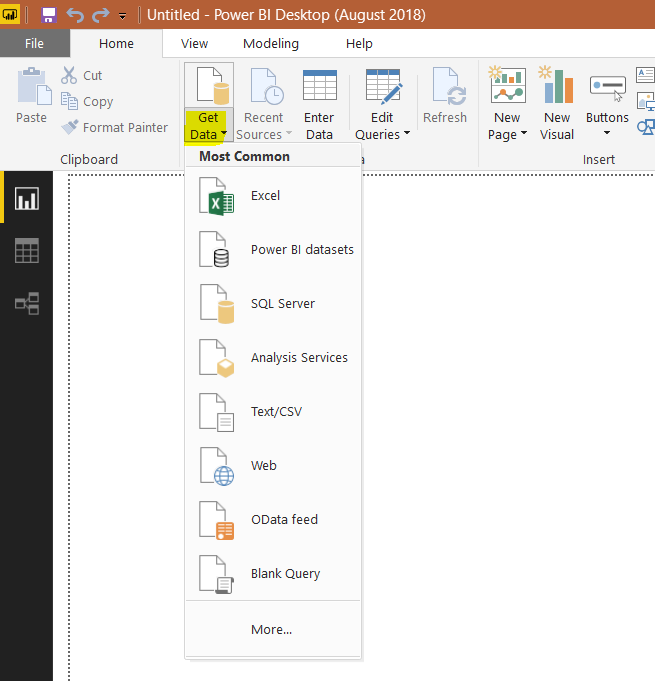
Select to Get Data. We will select SQL Server:
We will pull data from a localhost database:
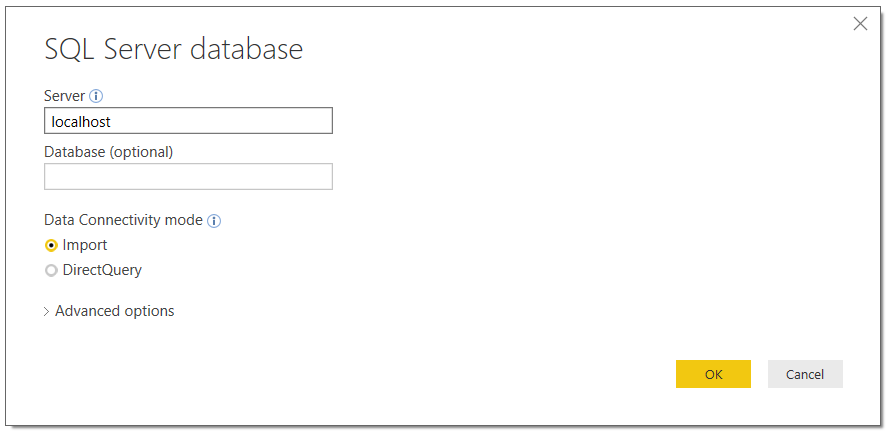
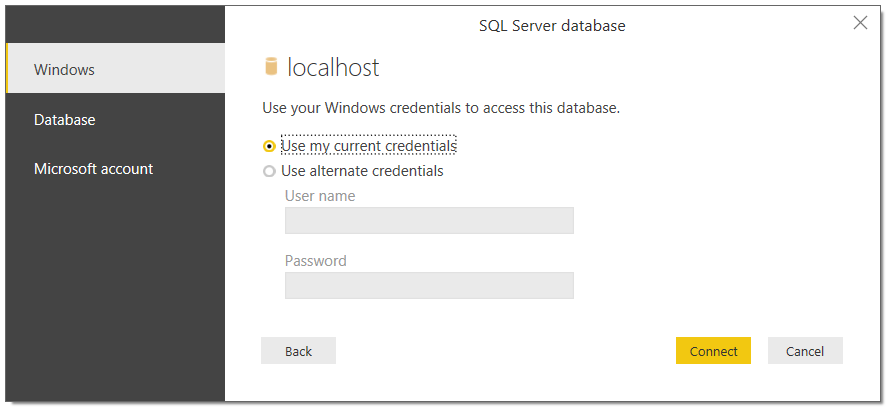
Click Connect:
Click Load to load to the data into Power BI:
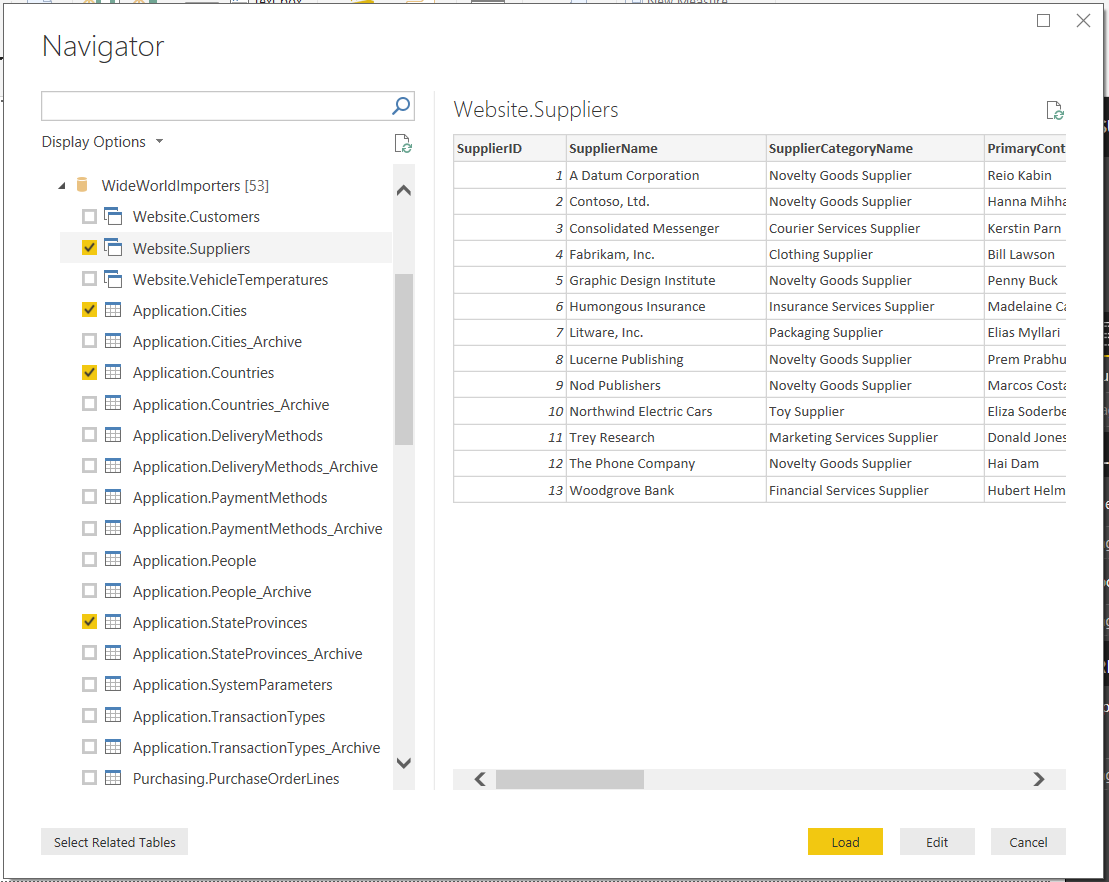
You will see:
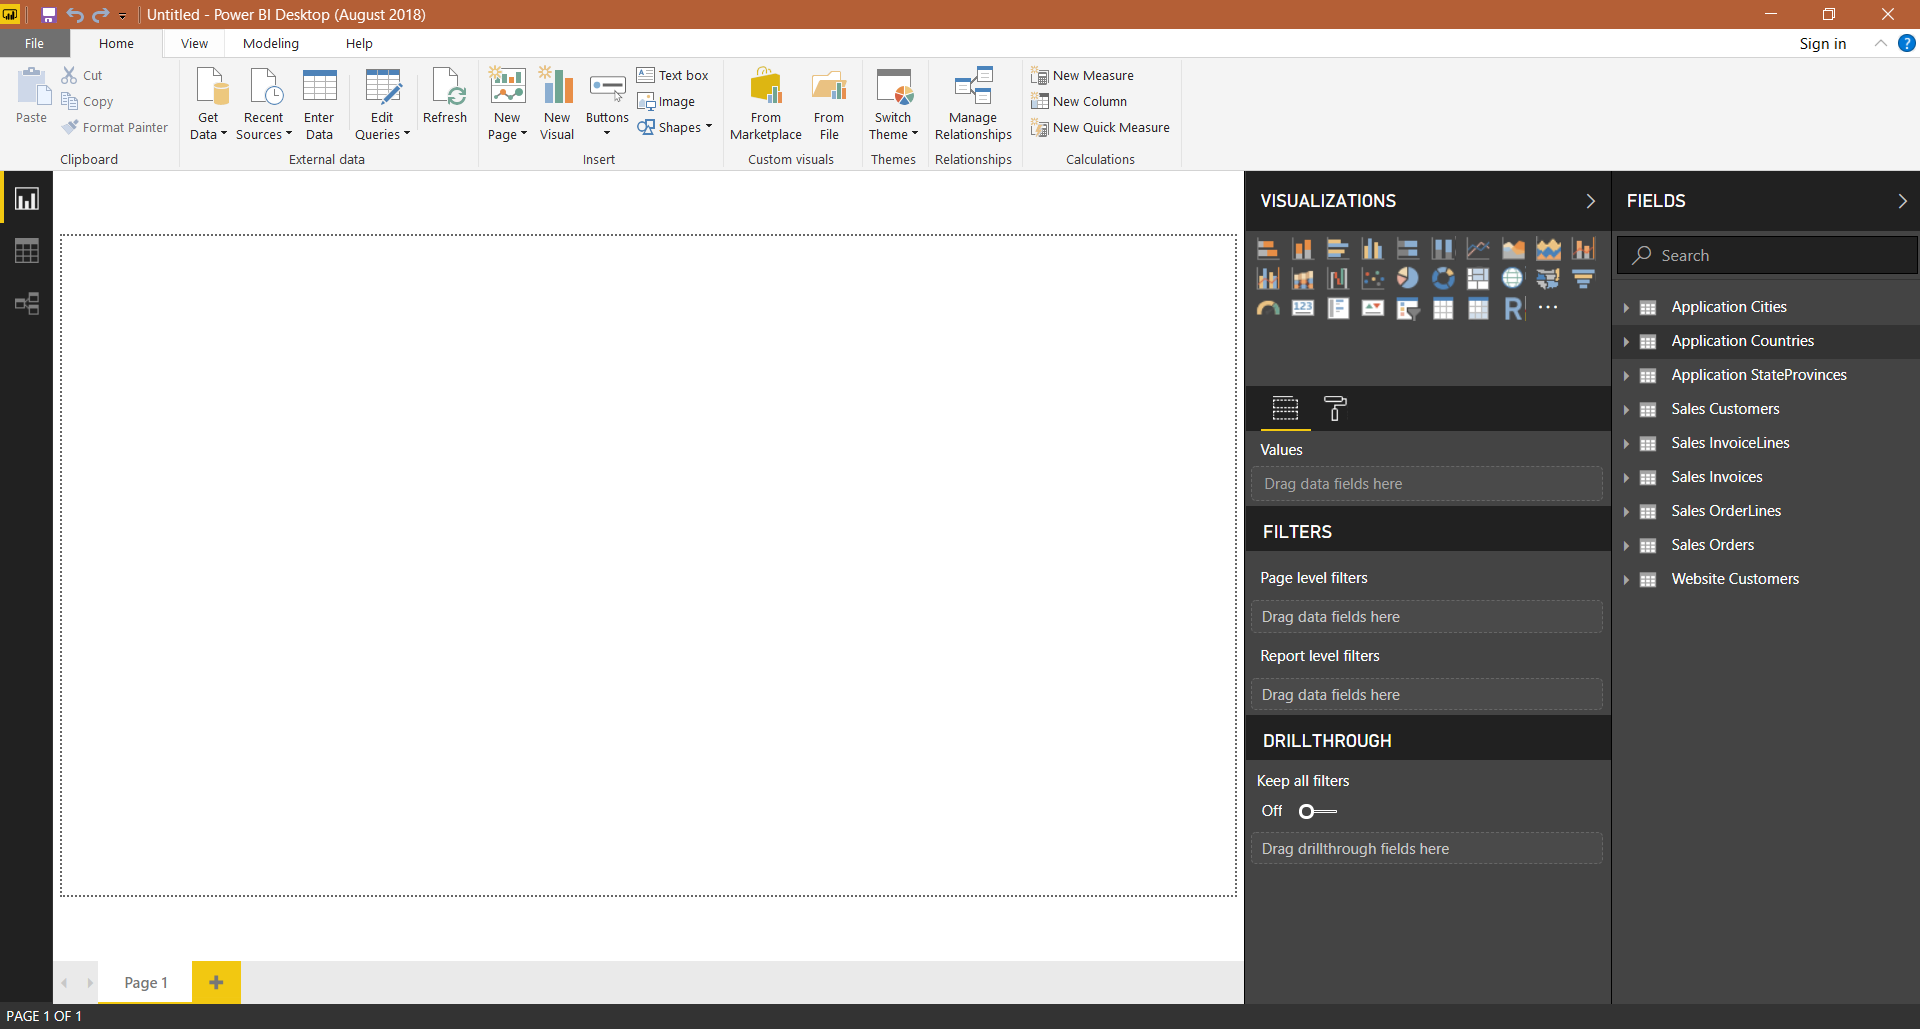
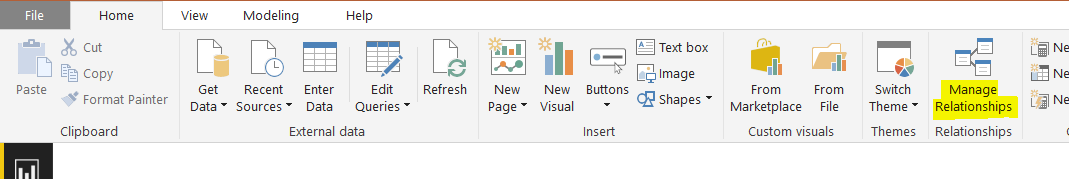
We now need to add relationships to our data. Click on Manage Relationships:
Add relationships or press Autodetect: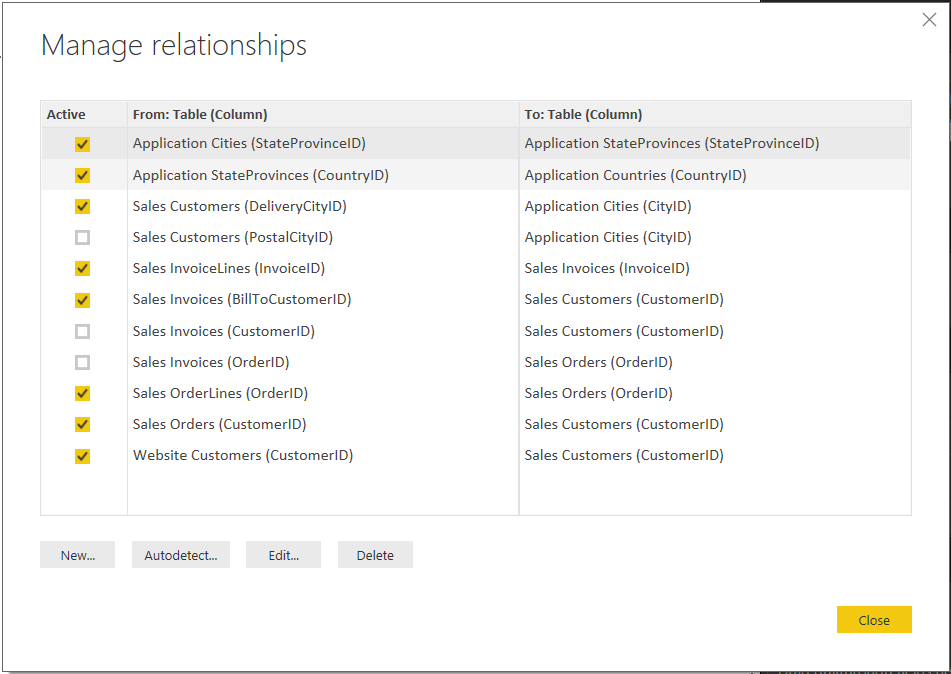
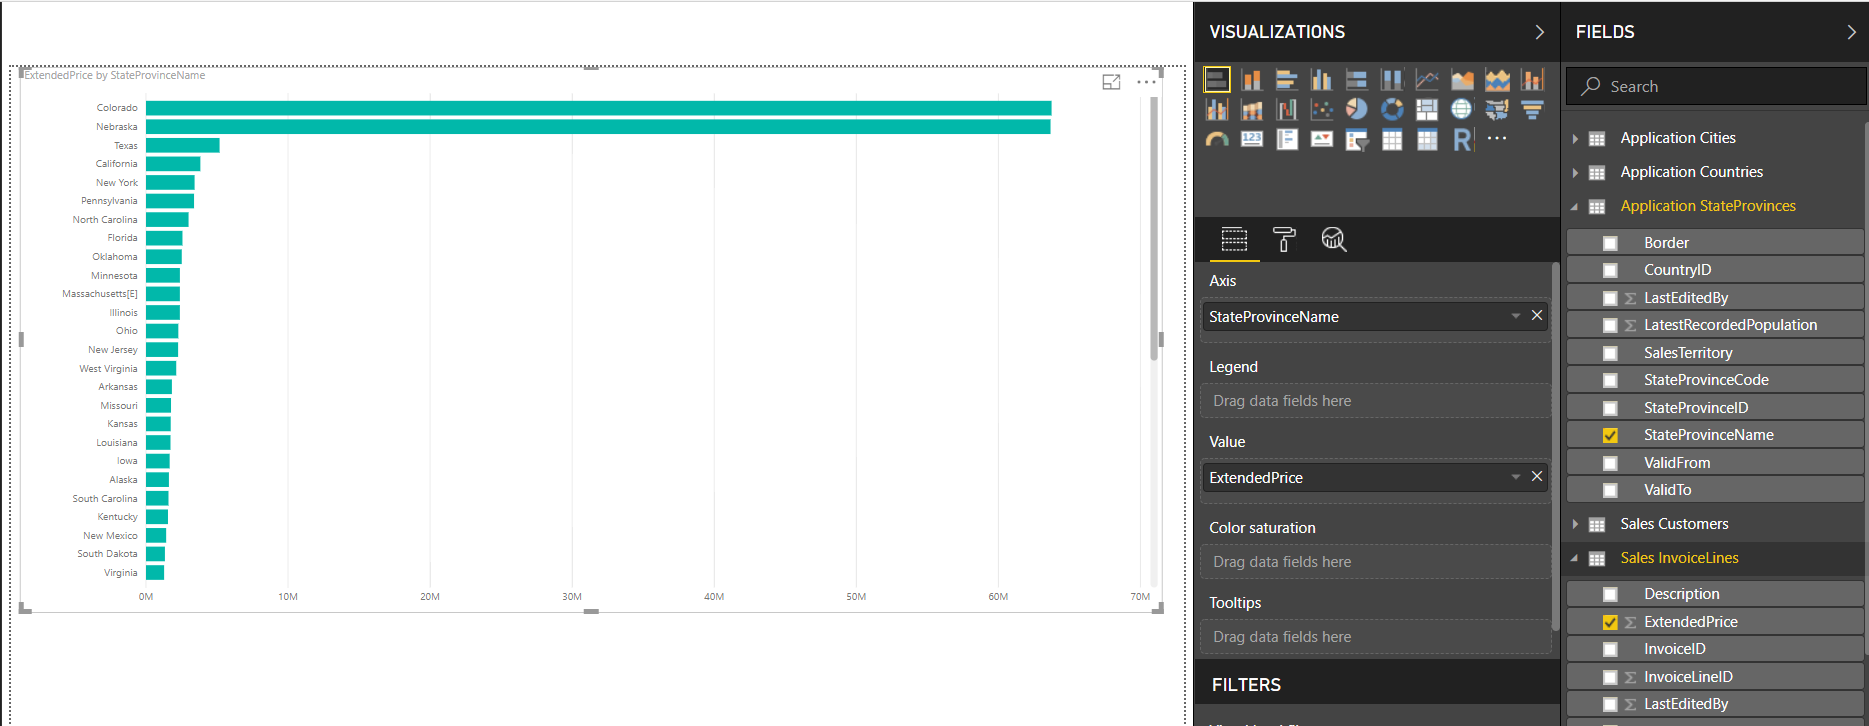
Add a new chart. e.g. Extended Price vs State:
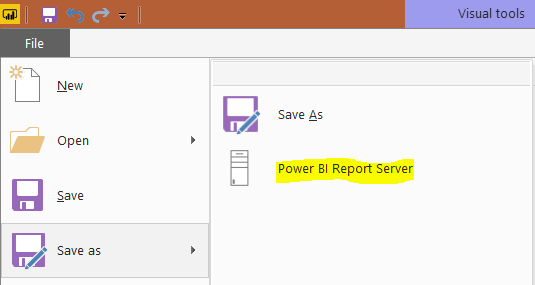
Click on Save->Power BI Report Server:
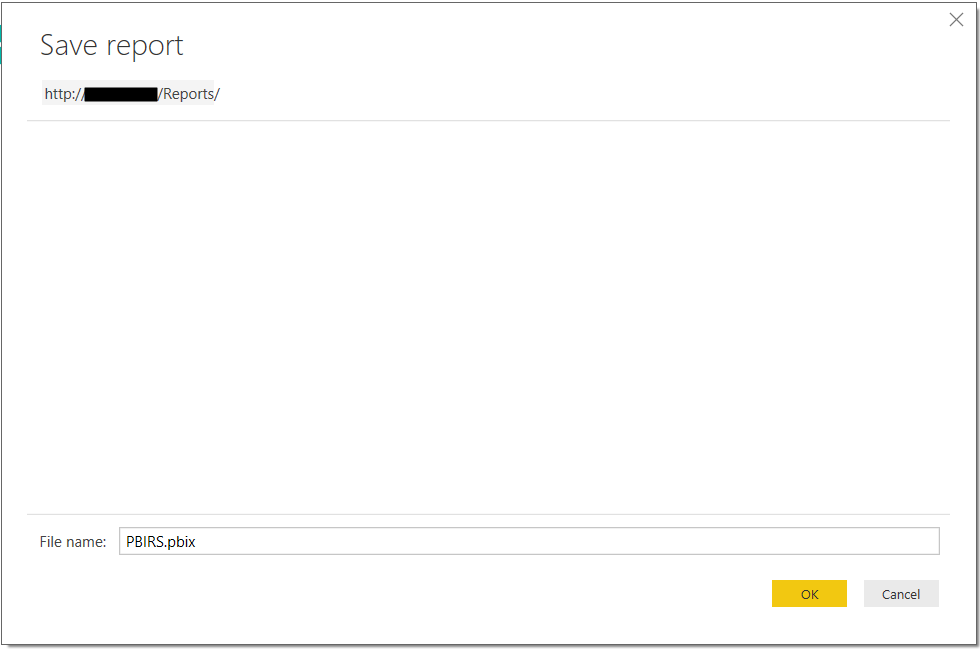
Provide a file name and click OK:
You will see the message:
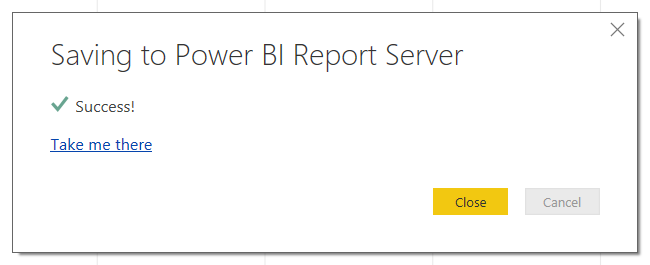
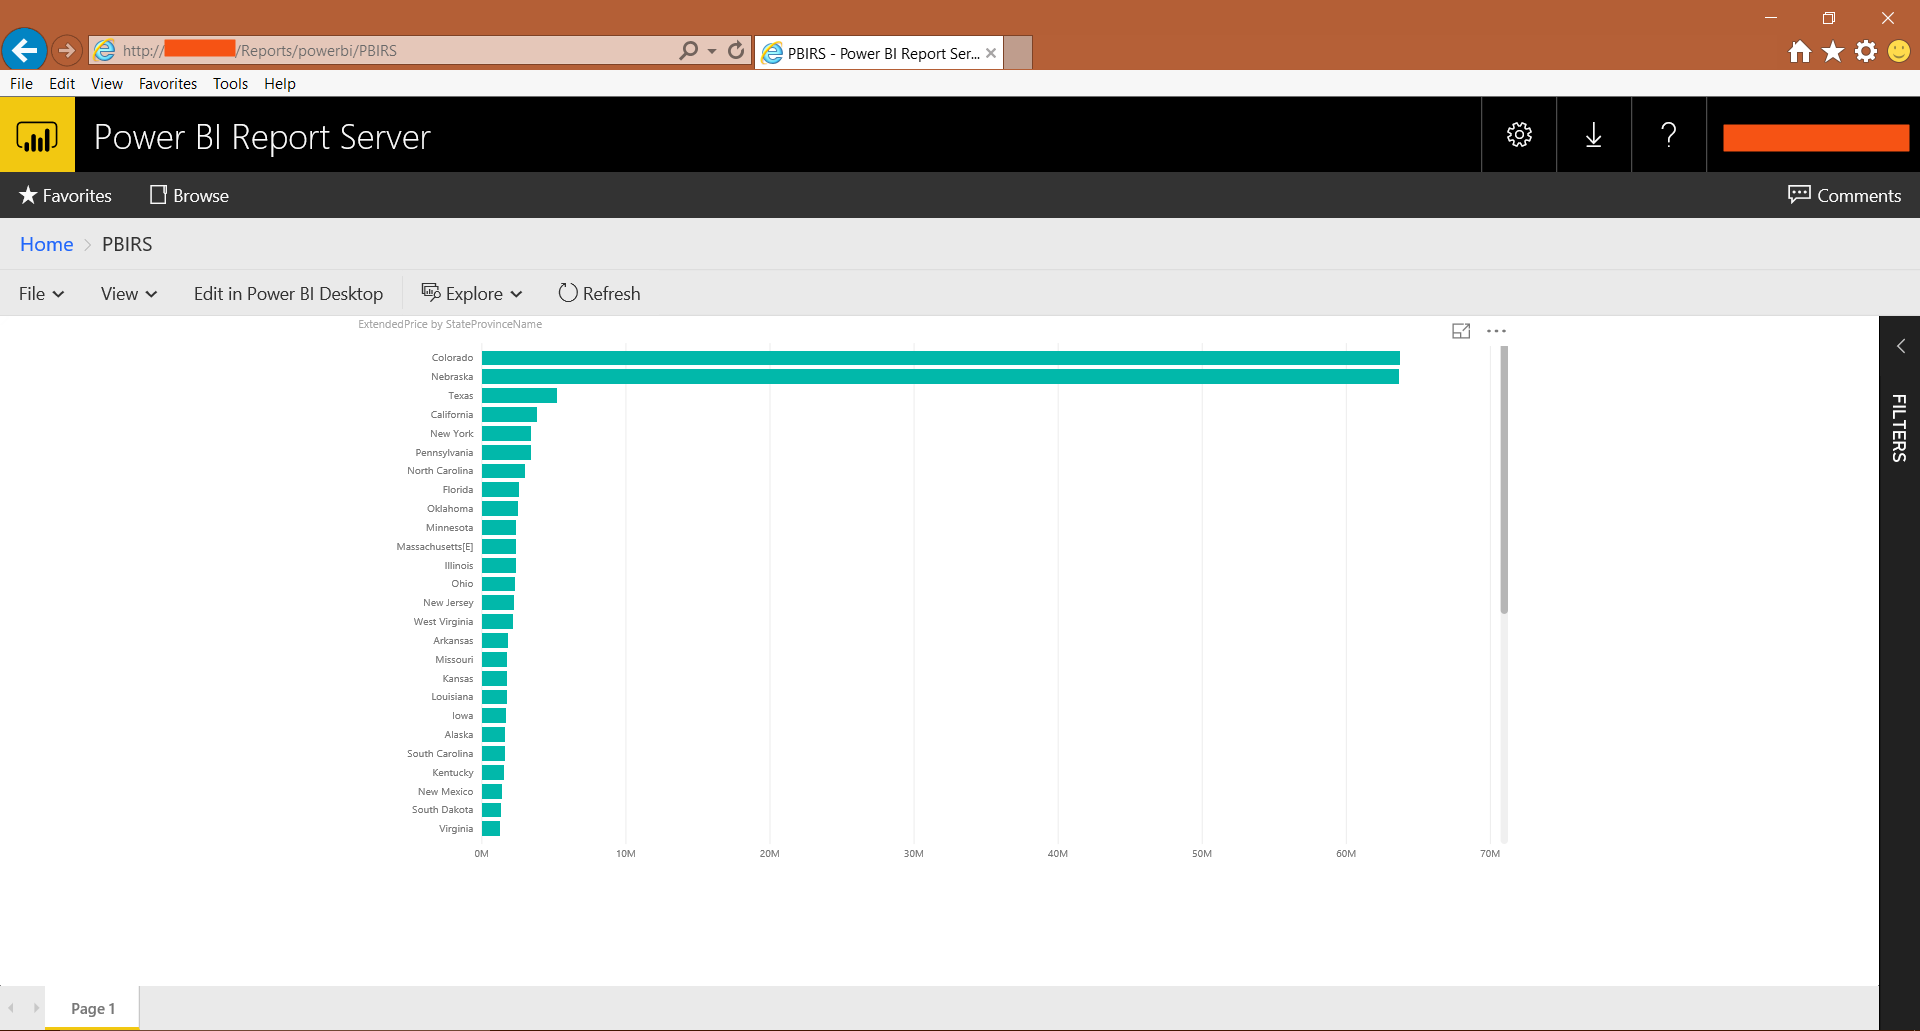
Clicking on the link will take you to the report in Power BI Report Server:
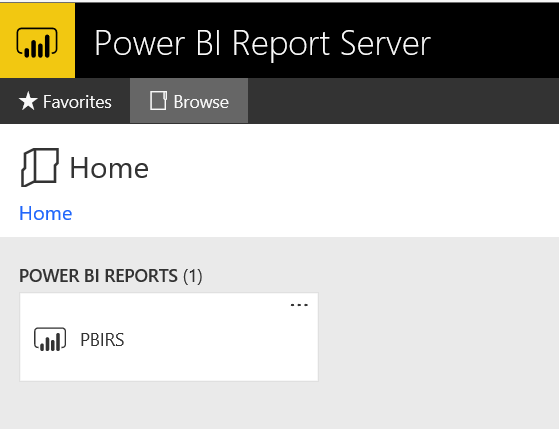
Which will also appear on the home page:
I AM SPENDING MORE TIME THESE DAYS CREATING YOUTUBE VIDEOS TO HELP PEOPLE LEARN THE MICROSOFT POWER PLATFORM.
IF YOU WOULD LIKE TO SEE HOW I BUILD APPS, OR FIND SOMETHING USEFUL READING MY BLOG, I WOULD REALLY APPRECIATE YOU SUBSCRIBING TO MY YOUTUBE CHANNEL.
THANK YOU, AND LET'S KEEP LEARNING TOGETHER.
CARL
