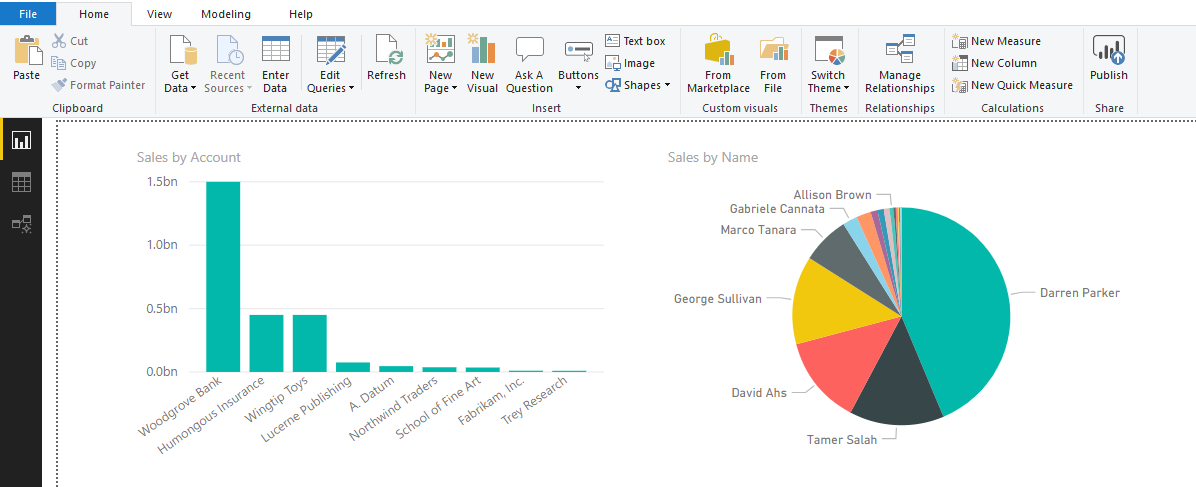
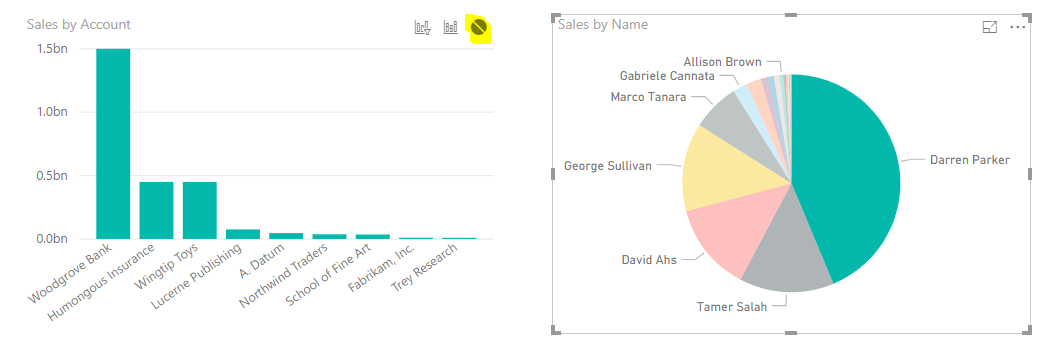
In Power BI, visualizations can interact with each other based on user selections. For example, let’s say we have 2 visualizations on a Power BI report, Sales by Account and Sales by Name:
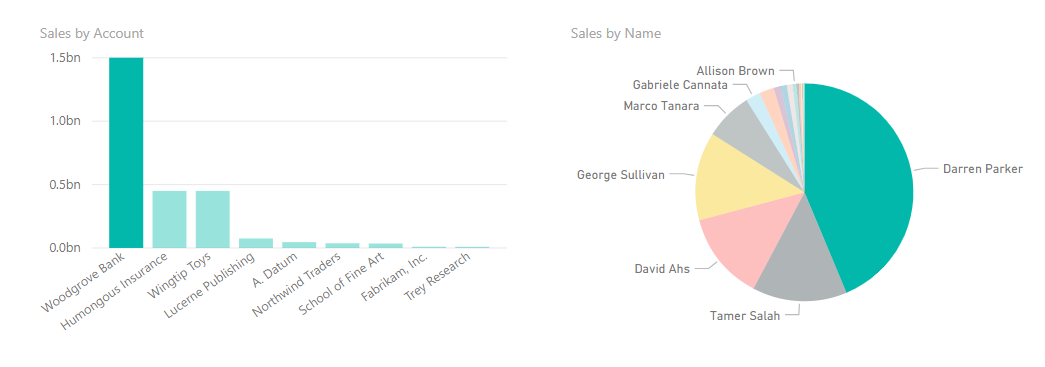
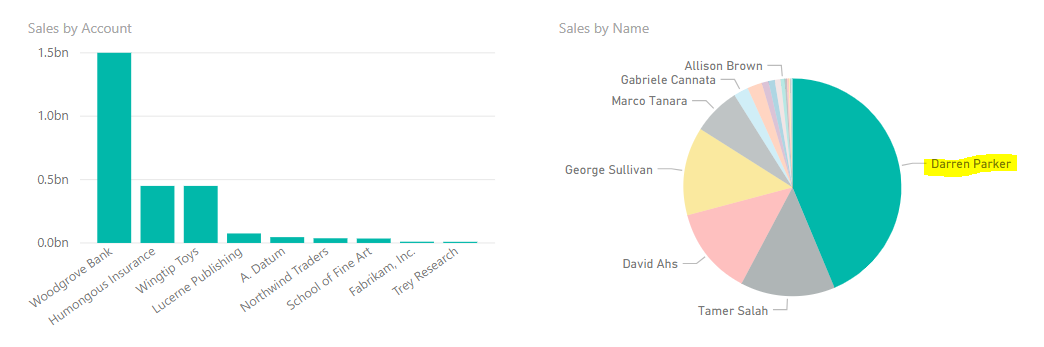
If a user selects a name on the right, it will filter the account on the left, as a user belongs to an account. Selecting Darren Parker filters the account to Woodgrove Bank:
Now let’s say we didn’t want this to happen. To change this behavior, click on the visual and select the Format menu, then Edit Interactions:
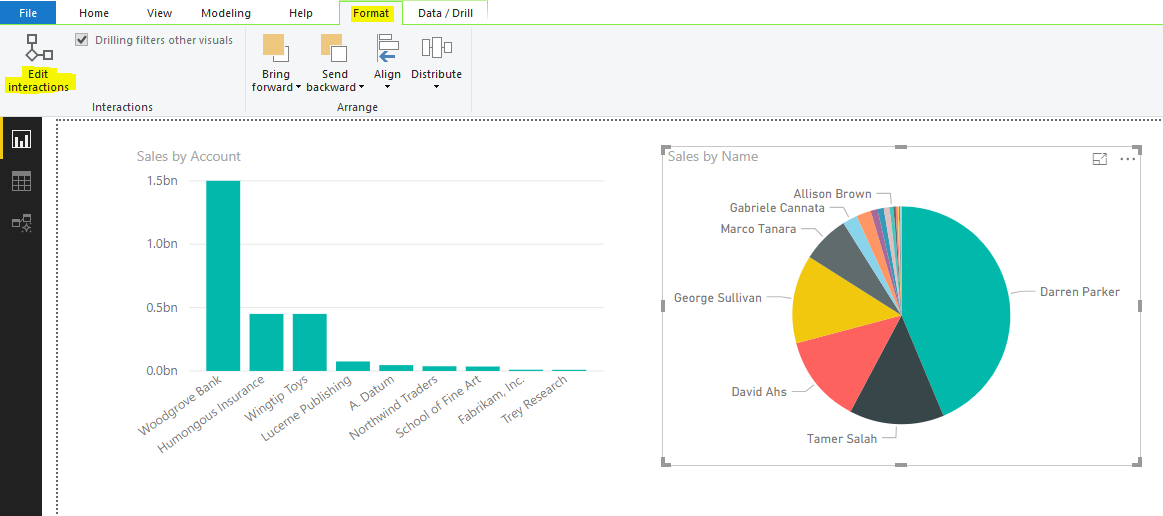
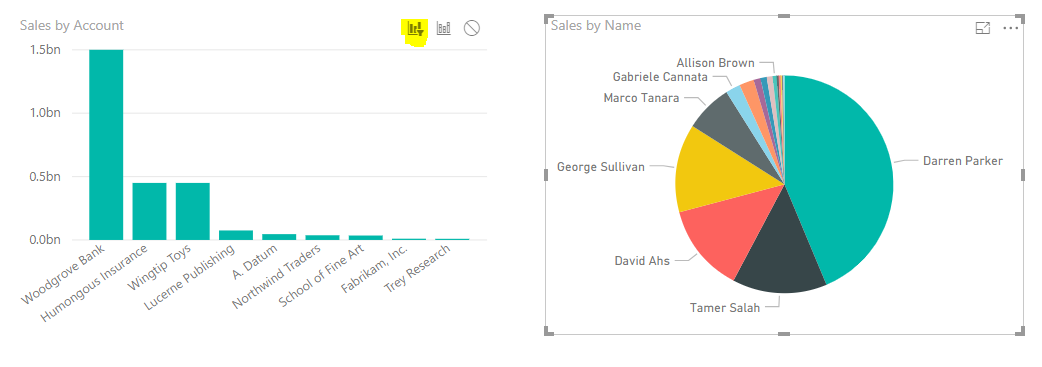
At this point, you will see new options appear above the Sales by Account visualization:
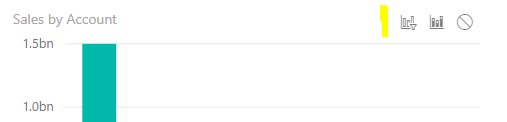
These options are (from left to right):
- Filter
- Highlight
- None
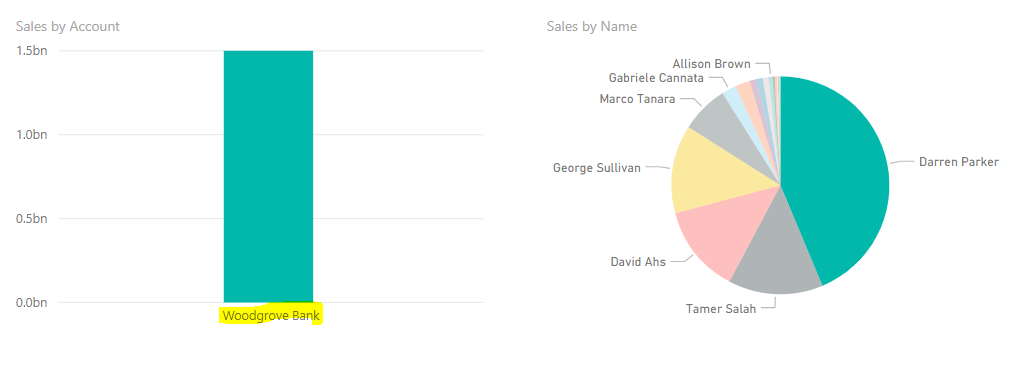
Let’s try each of these. First, filter:
After selecting this option, click on Darren Parker again. This time Sales by Account is completely filtered to Woodgrove Bank:
Now back to Edit Interactions, let’s select Highlight:
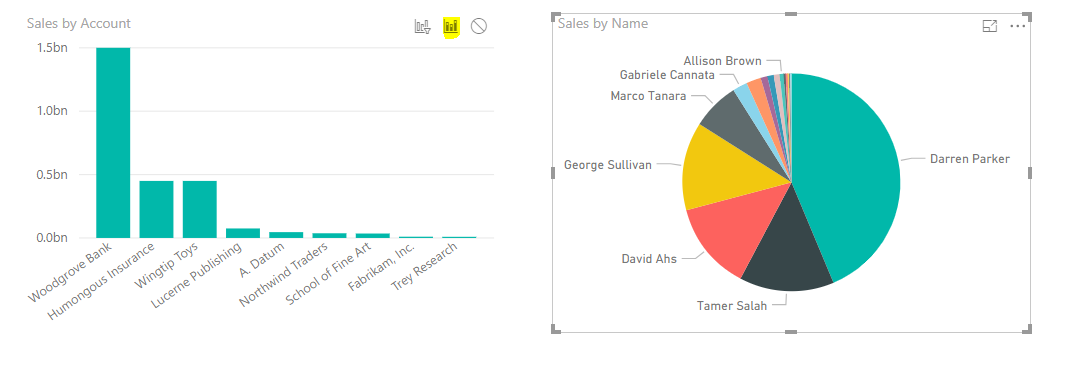
This will highlight the relevant record, which we saw as the default behavior:
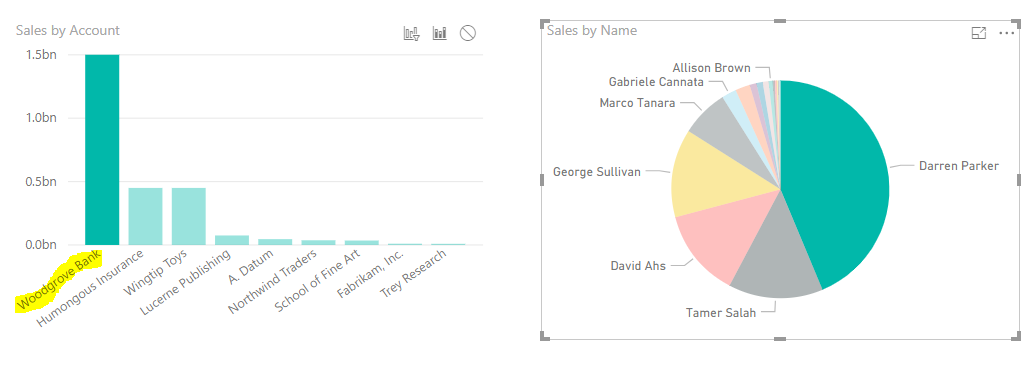
And finally, set it to None:
Here, Darren Parker is selected but the Sales By Account is unaffected:
This is useful if you do not want certain visualizations to interact with each other.
A useful Power BI feature to further refine your reports.
I AM SPENDING MORE TIME THESE DAYS CREATING YOUTUBE VIDEOS TO HELP PEOPLE LEARN THE MICROSOFT POWER PLATFORM.
IF YOU WOULD LIKE TO SEE HOW I BUILD APPS, OR FIND SOMETHING USEFUL READING MY BLOG, I WOULD REALLY APPRECIATE YOU SUBSCRIBING TO MY YOUTUBE CHANNEL.
THANK YOU, AND LET'S KEEP LEARNING TOGETHER.
CARL
