In this post, we will look at how to create an Income Prediction model in Azure ML. We will use samples from Microsoft Azure and follow the Azure ML learning example.
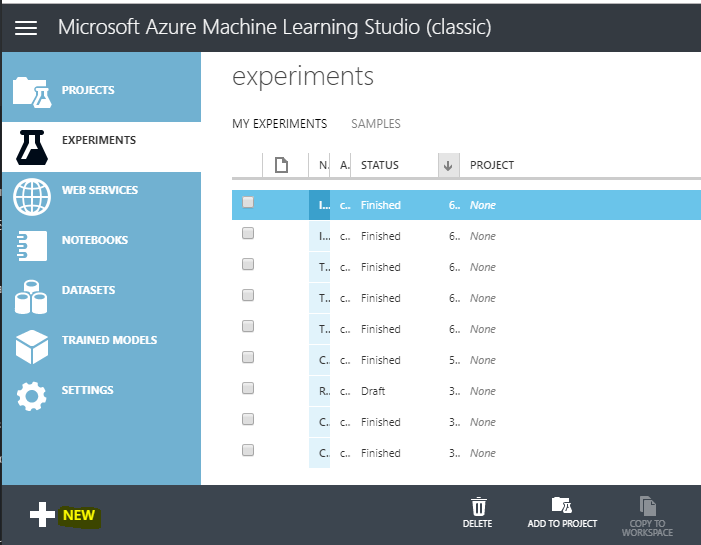
First, log into Azure ML Studio and select New to create a new Experiment:
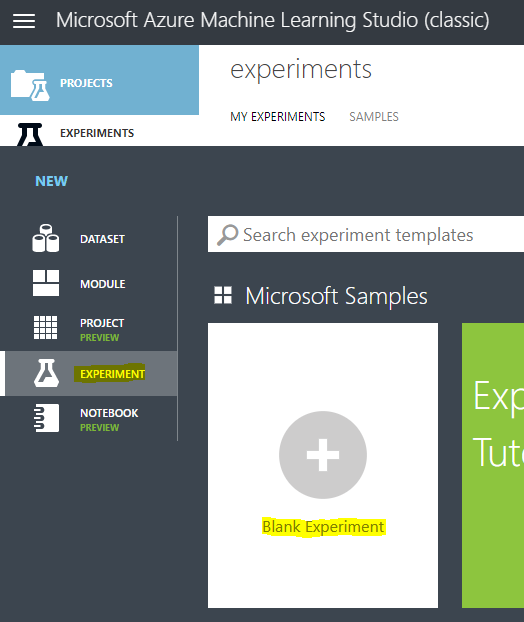
Go to Experiment and then Blank Experiment:
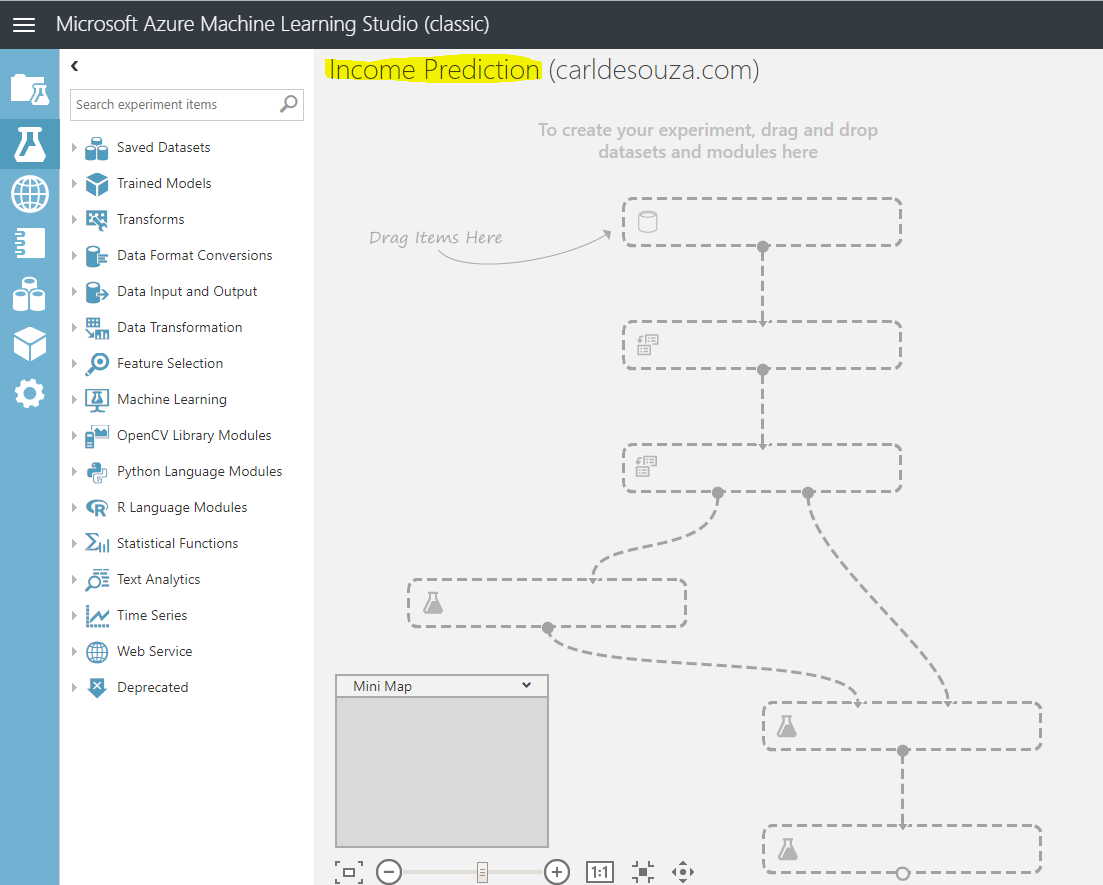
Give the experiment a name:
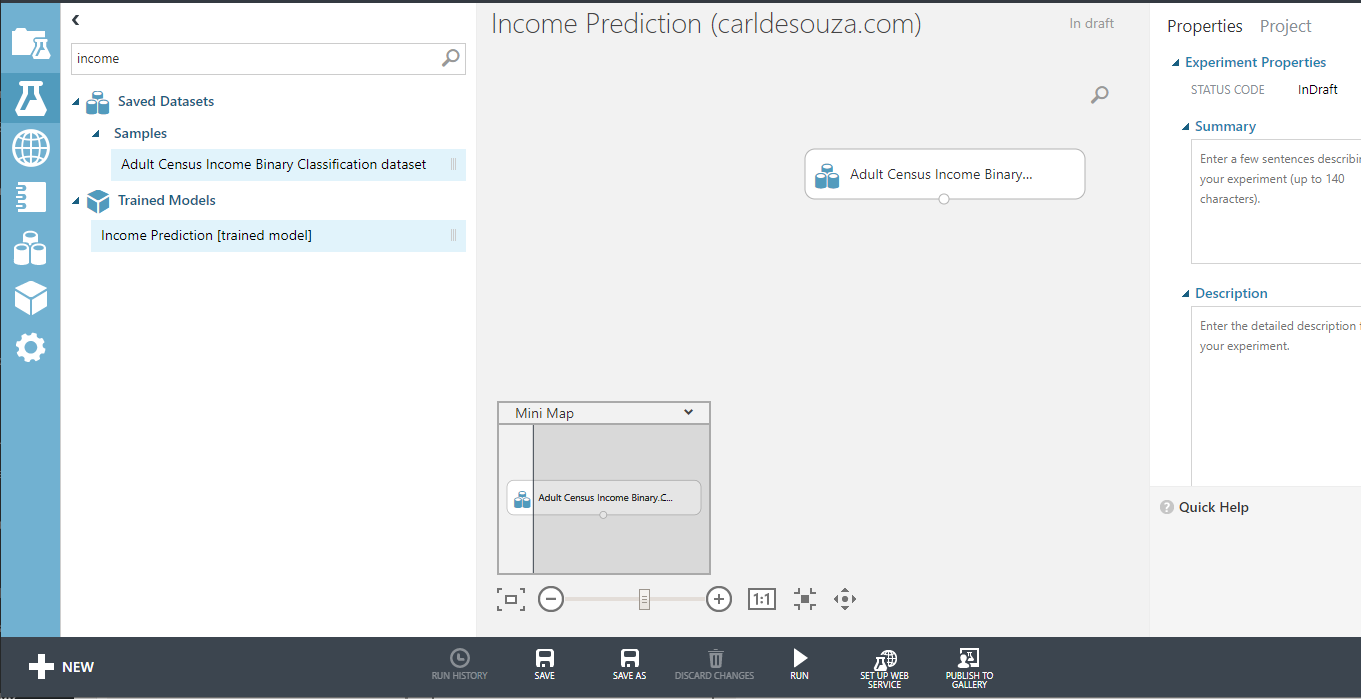
Next, we will need some data. In the search bar, type in “Income”, and select Adult Census Income Binary Classification dataset:
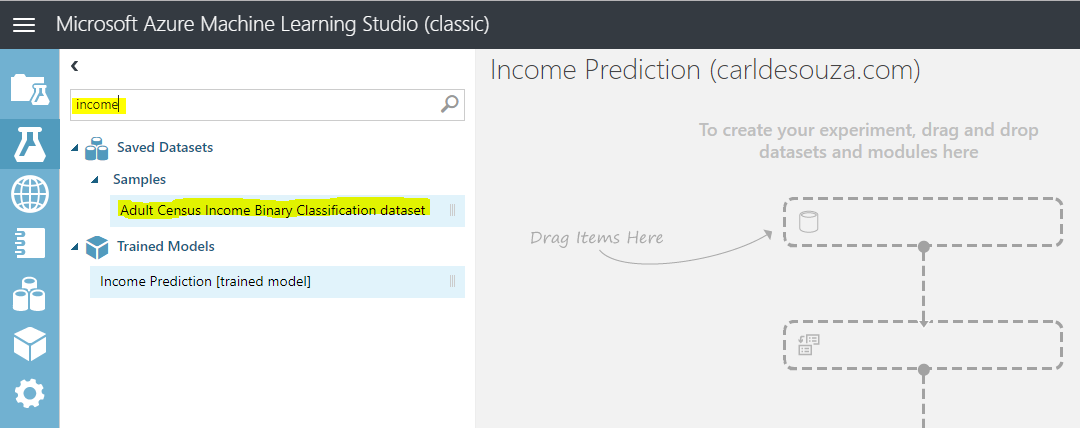
Drag it into where it says “Drag Items Here”:
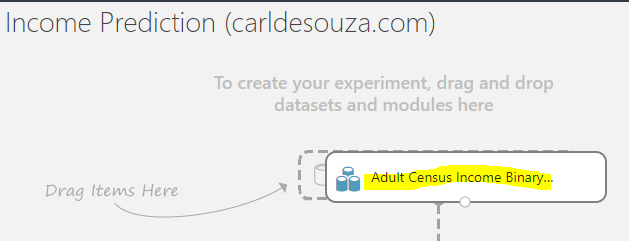
It should now look like below:
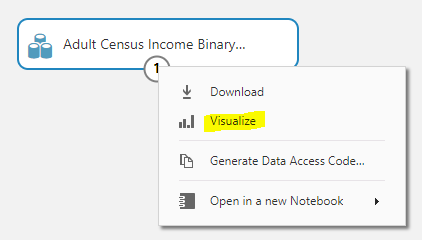
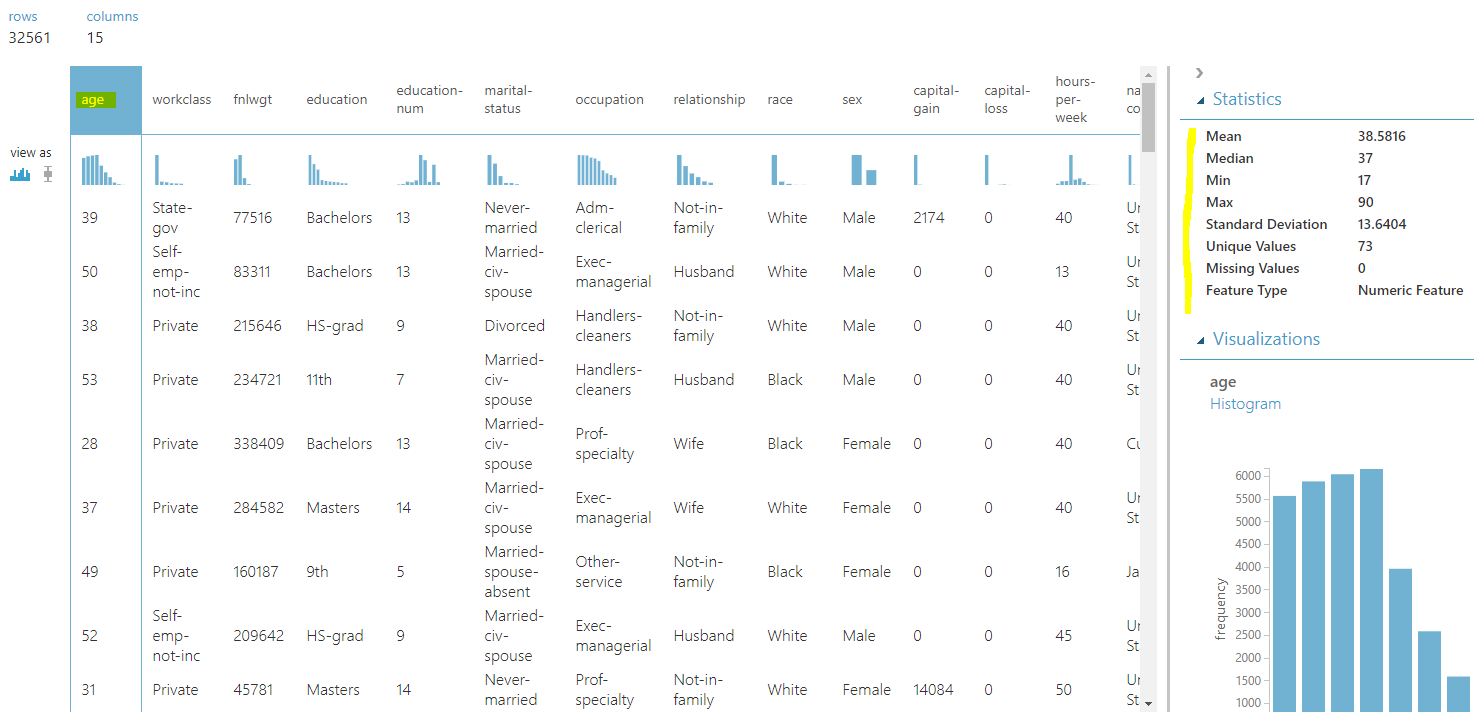
To see the data, click on it and select Visualize:
This gives us a good overall view of the data we’re dealing with. In our case, we have several fields that may be useful to determine the income of a particular individual:
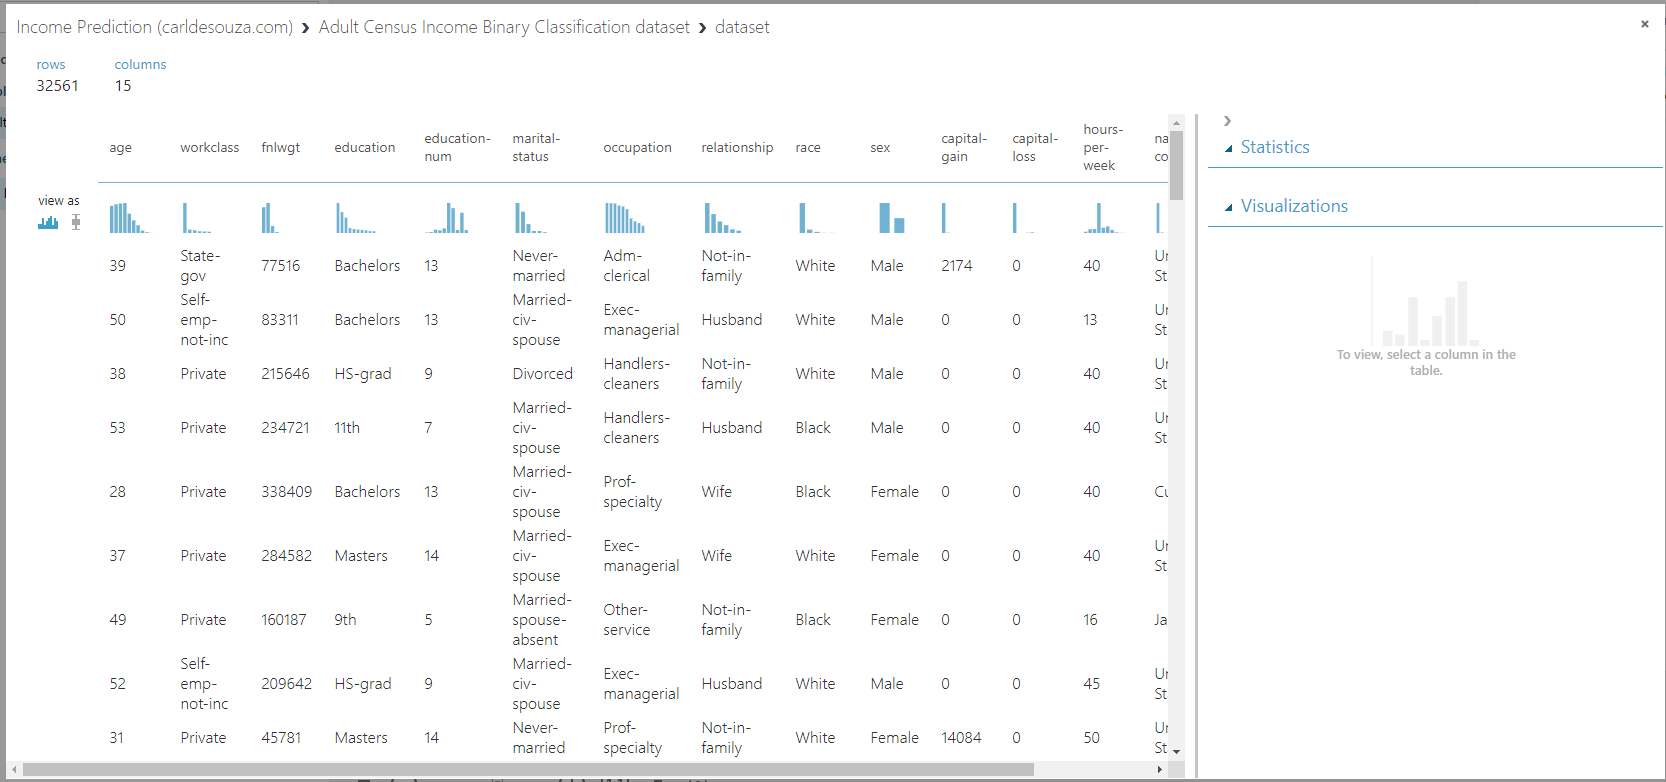
If we select Age, we see the mean age is 38, the median is 37 etc:
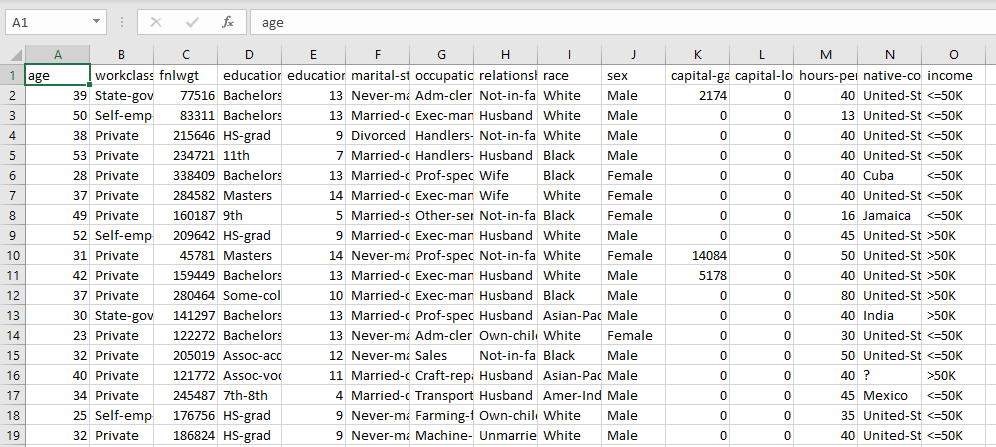
And if we chose to download the data, we get a CSV file:
![]()
Which is useful if we want to analyze the data in Excel:
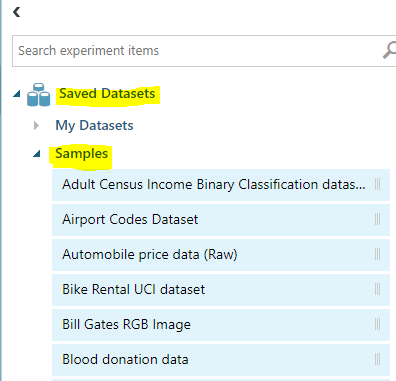
And if we want to use other datasets, we can easily find more samples under Saved Datasets->Samples:
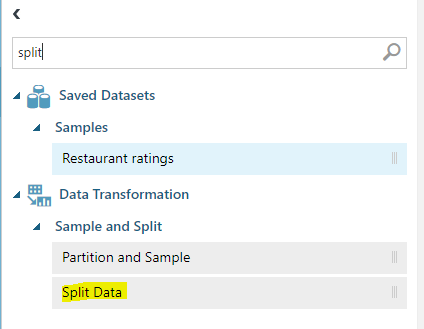
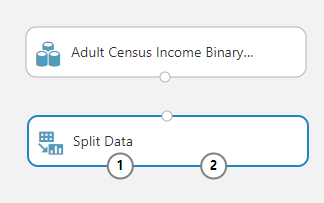
Back to our experiment, let’s now split the data to 70% training data and 30% test data. Search for split, and select Split Data, which is under Data Transformations:
We now have below:
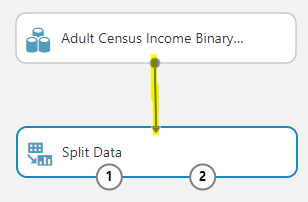
Connect the two:
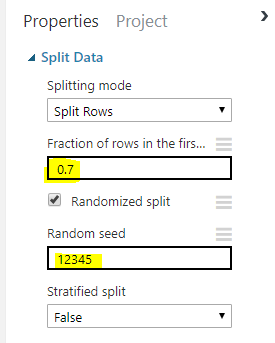
On the properties on the right, select the split percentage. We will use 0.7 as 70%, with a random seed of 12345:
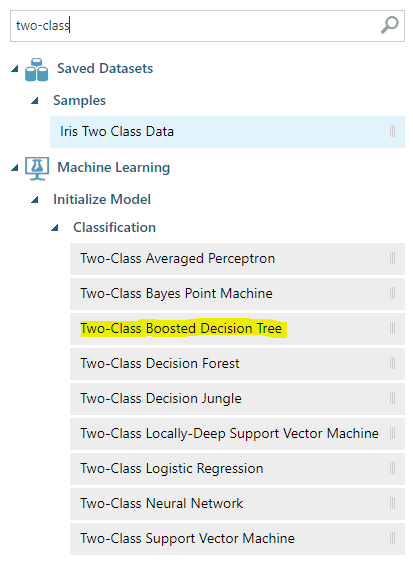
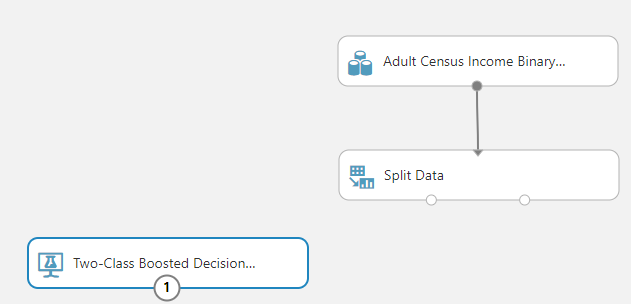
Now our data will split. Let’s add an algorithm to our experiment. We will use the Two-class Boosted Decision Tree algorithm. Search for Two-class and drag the algorithm onto the canvas:
The experiment should now look like below:
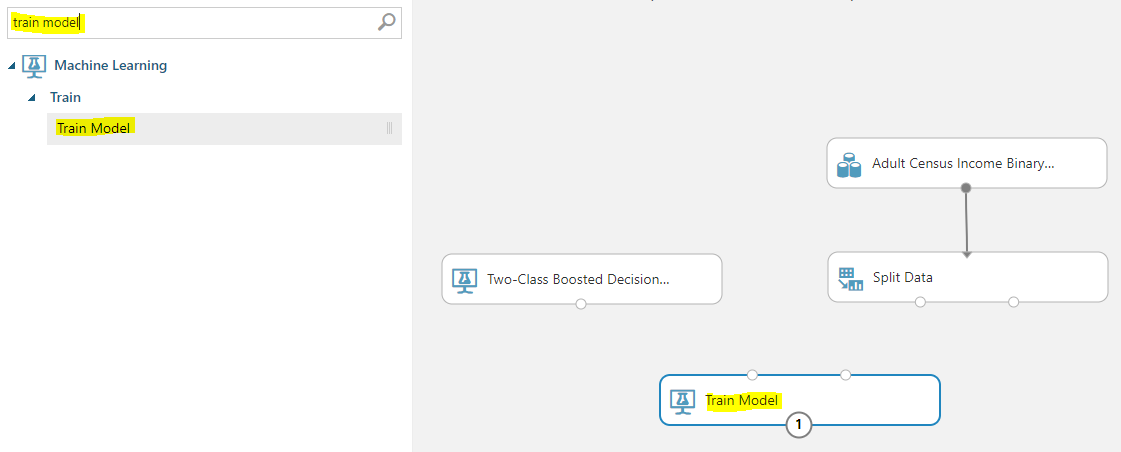
Search for Train model and drag it onto the canvas:
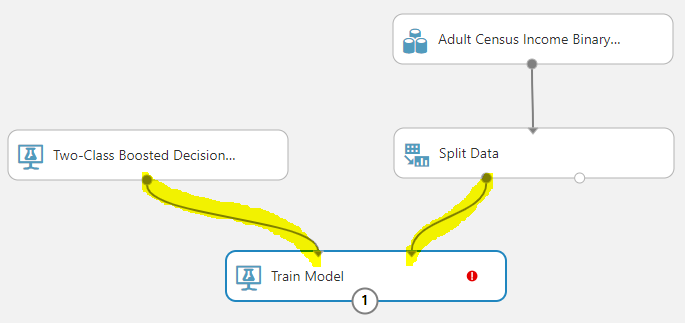
Connect the nodes like below:
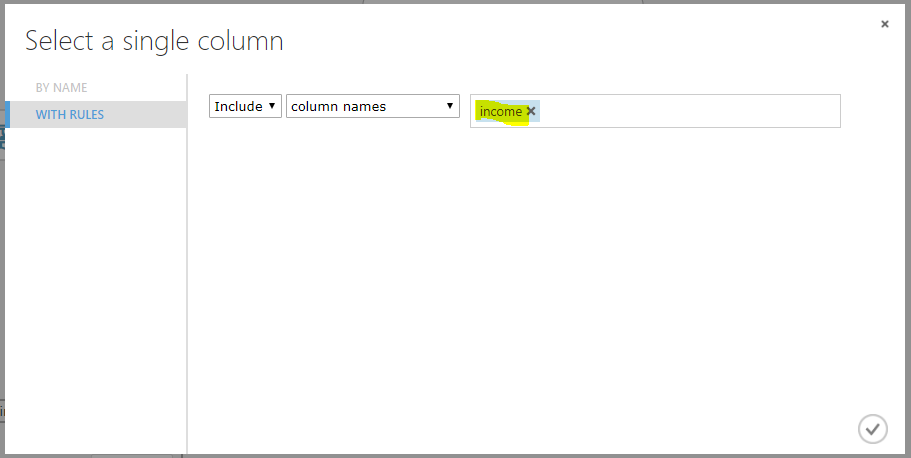
For the Train Model properties, select Launch Column Selector:
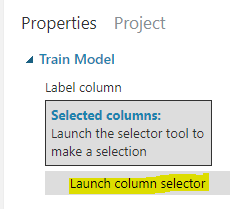
And enter income:
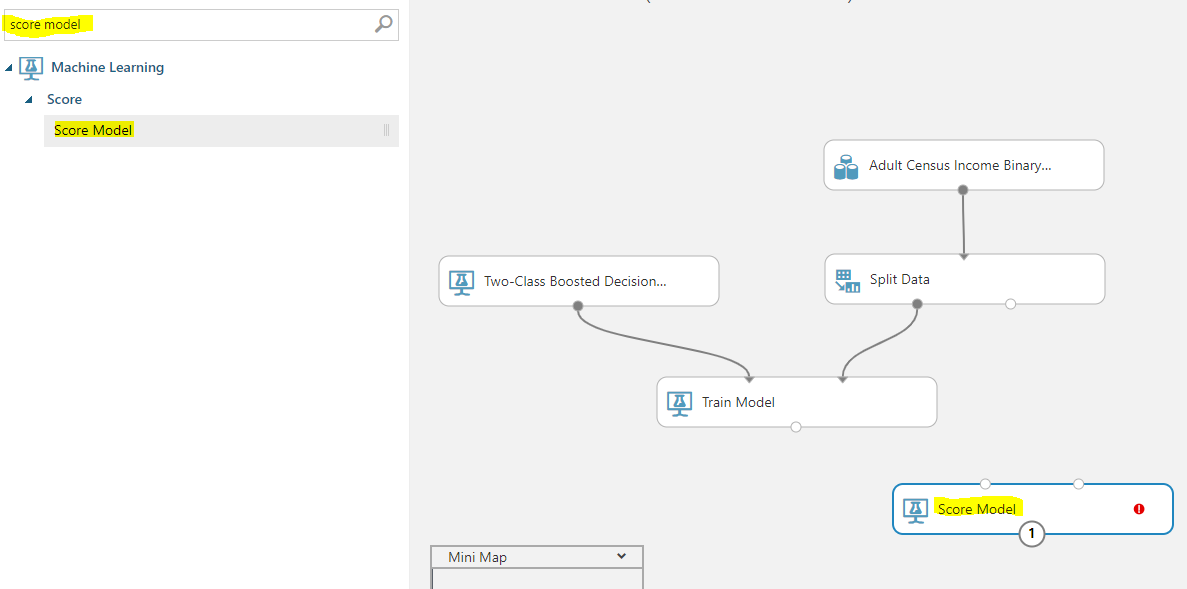
We’re now ready to set up the prediction. Add Score Model:
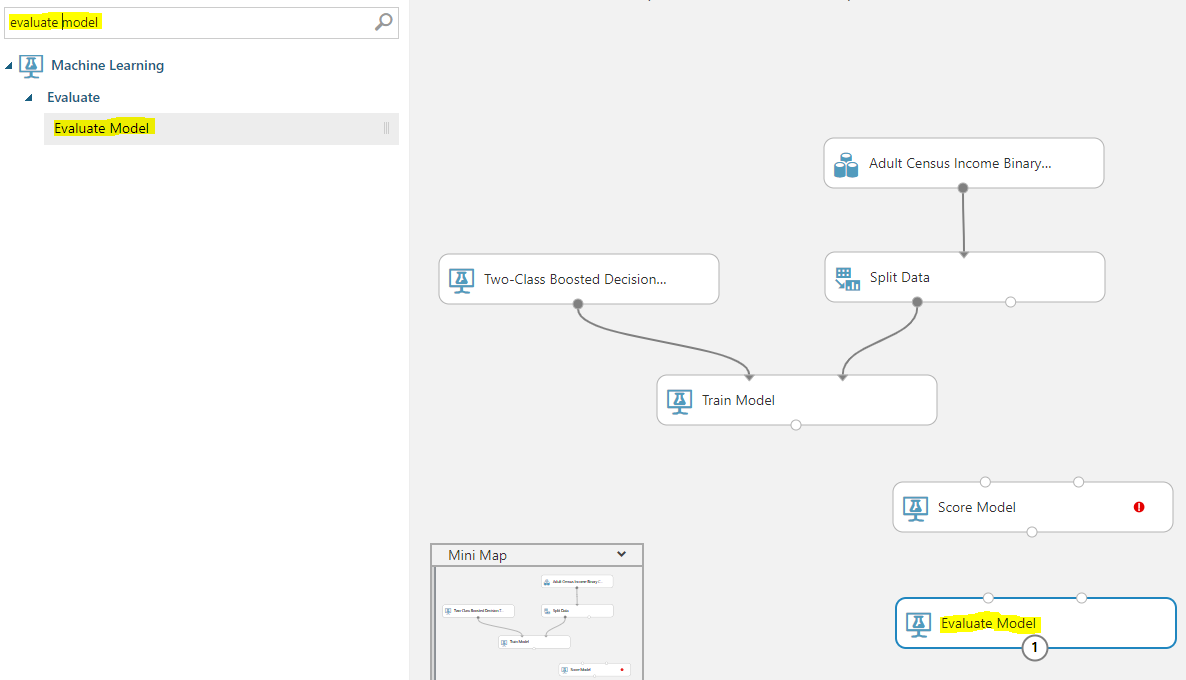
And Evaluate Model:
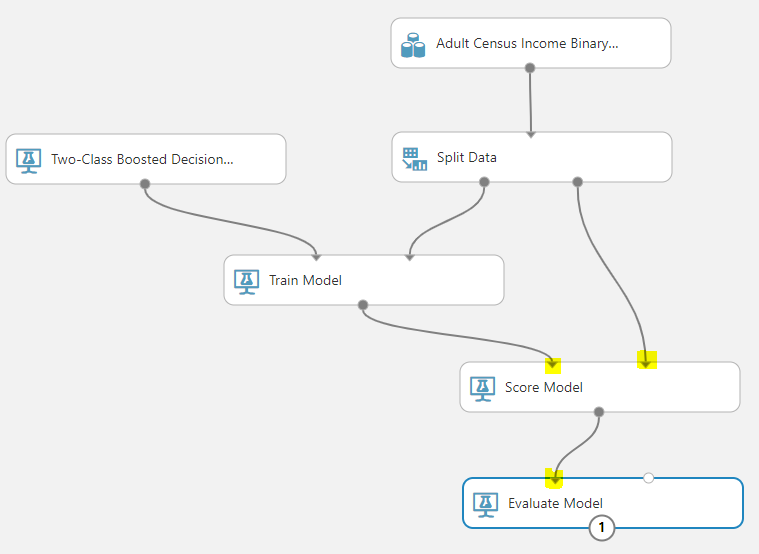
Score Model takes 2 inputs. We will use the Train Model and Split Data as inputs, and an output to the evaluate model:
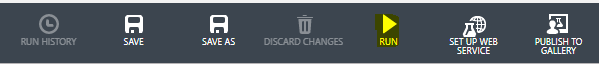
Now run the model. Click run in the bottom bar:
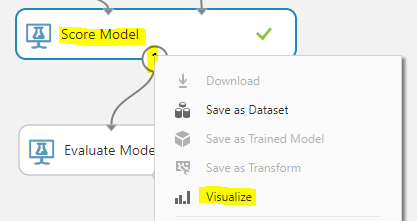
Click on Score Model->Visualize:
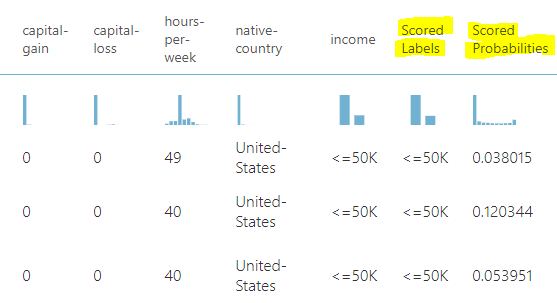
We see the scored labels and scored probabilities:
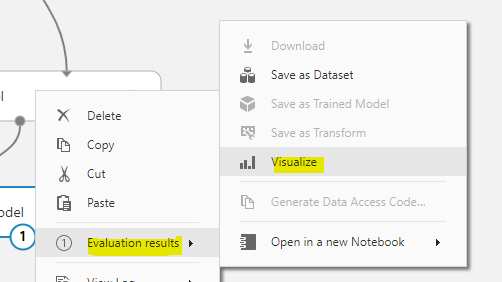
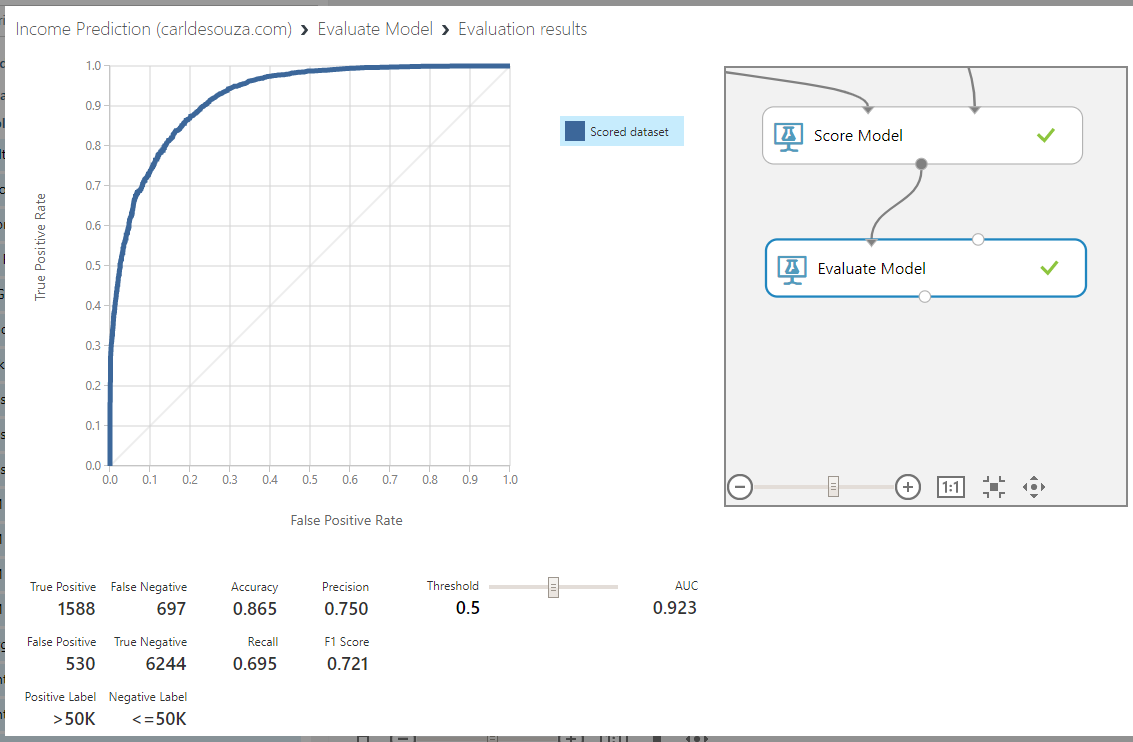
Click on Evaluate Model->Visualize:
We see information on how the model performed, true positives, accuracy, threshold etc:
Next, let’s look at how to deploy this to a web service.
I AM SPENDING MORE TIME THESE DAYS CREATING YOUTUBE VIDEOS TO HELP PEOPLE LEARN THE MICROSOFT POWER PLATFORM.
IF YOU WOULD LIKE TO SEE HOW I BUILD APPS, OR FIND SOMETHING USEFUL READING MY BLOG, I WOULD REALLY APPRECIATE YOU SUBSCRIBING TO MY YOUTUBE CHANNEL.
THANK YOU, AND LET'S KEEP LEARNING TOGETHER.
CARL
