In Dynamics 365, it is easy to create dashboards that users have access to that display critical information. In this post, we will look at how to build an Opportunity dashboard.
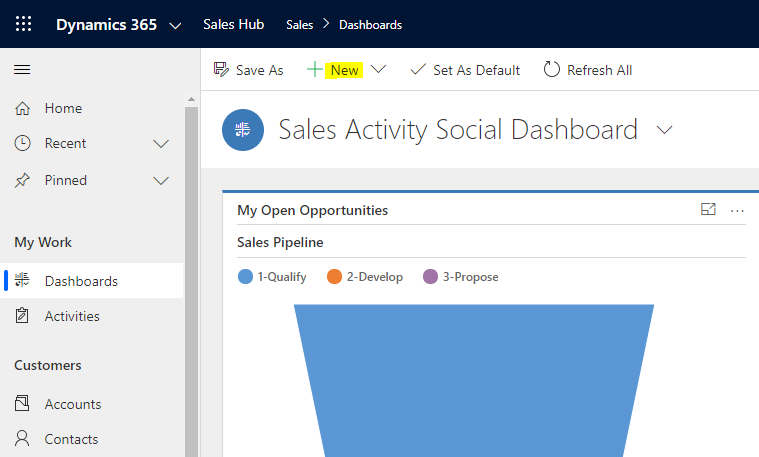
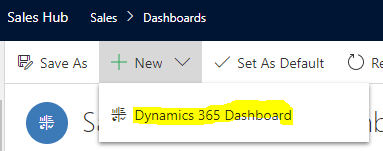
Select Dynamics 365 Dashboard:
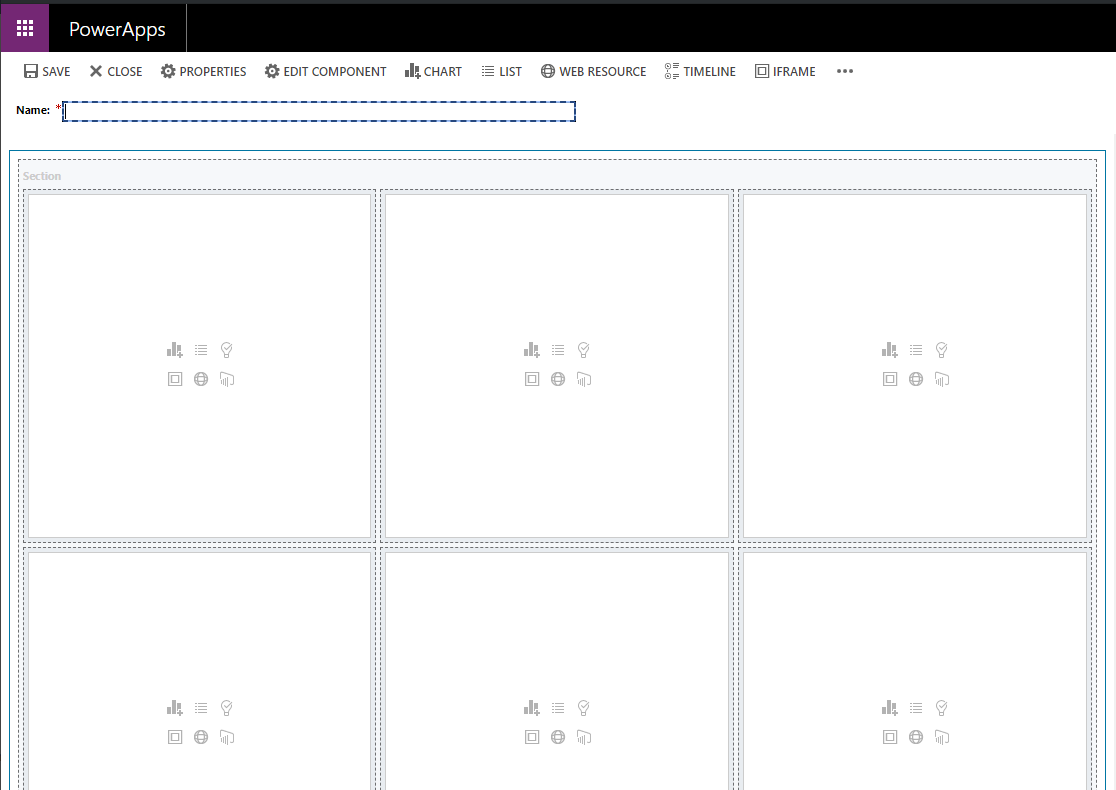
We will choose the 3-column regular dashboard layout and click Create:

We see below:
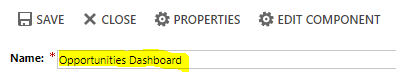
Give the dashboard a name:
In each pane, we can add:
- Chart
- List
- Relationship Assistant
- IFrame
- Web Resource
- Power BI tile

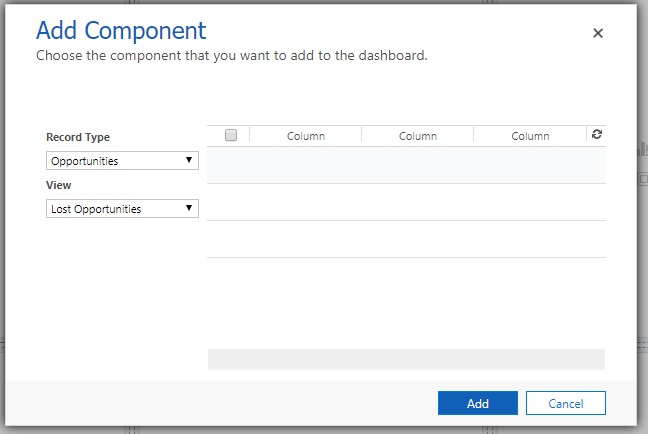
Let’s add a chart by selecting Opportunities, Lost Opportunities view:
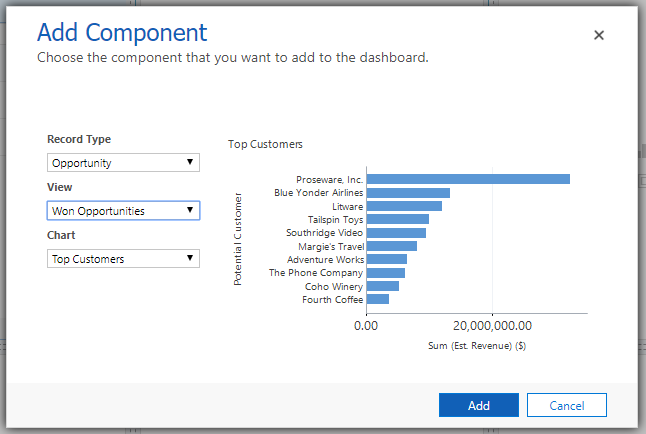
And a Chart showing Top Customers Won Opportunities:
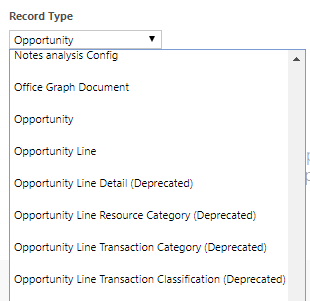
Note the Opportunity Close entity does not appear here as an option.
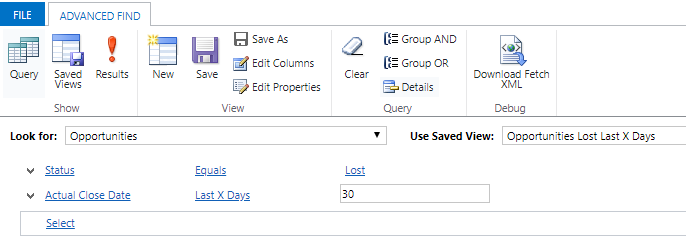
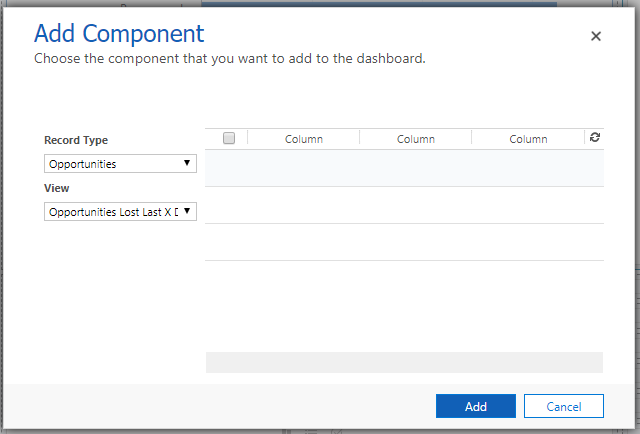
You can also write your own views and use those, for example, if we wanted opportunities lost in last X days, we can create the view in Advanced Find:
And Add it to the dashboard:
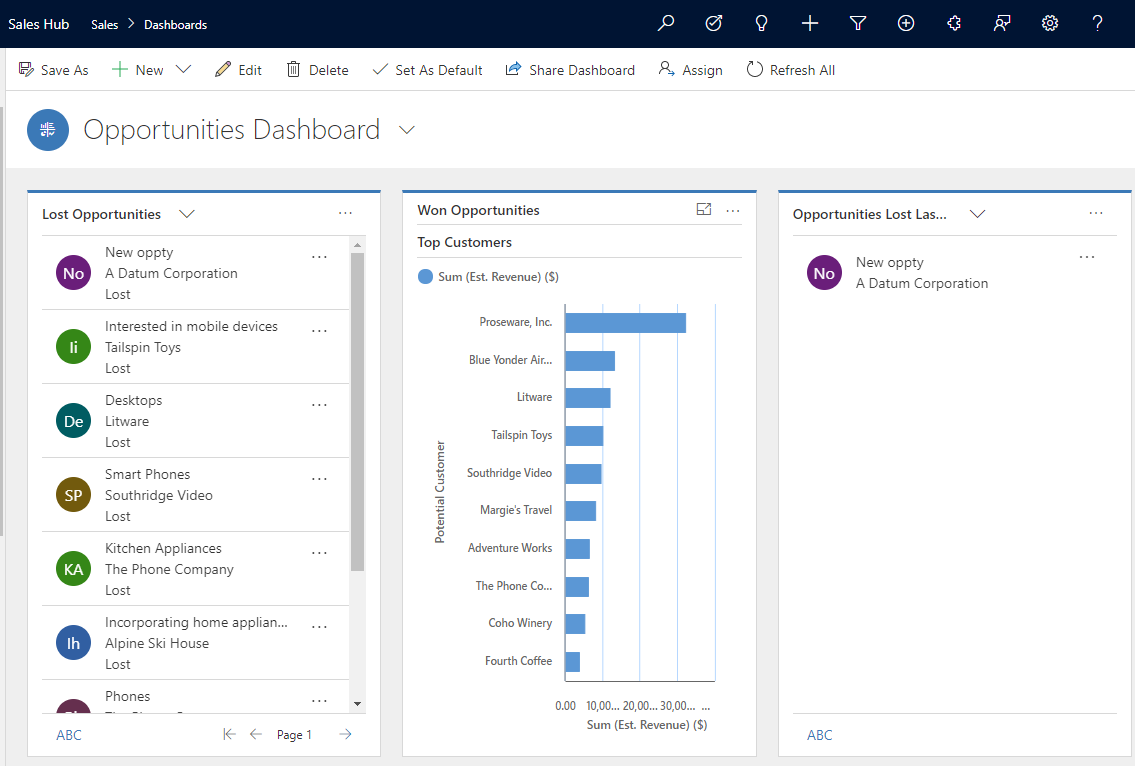
Pretty easily, we now have a dashboard that shows us Opportunity data:
I AM SPENDING MORE TIME THESE DAYS CREATING YOUTUBE VIDEOS TO HELP PEOPLE LEARN THE MICROSOFT POWER PLATFORM.
IF YOU WOULD LIKE TO SEE HOW I BUILD APPS, OR FIND SOMETHING USEFUL READING MY BLOG, I WOULD REALLY APPRECIATE YOU SUBSCRIBING TO MY YOUTUBE CHANNEL.
THANK YOU, AND LET'S KEEP LEARNING TOGETHER.
CARL
