In the previous post, we created a new Custom Workflow Activity and used it in a workflow.
Let’s look at how to debug one of these.
Open the Plugin Registration Tool (PRT) and select Install Profiler:

This may take a few minutes. Once installed, you will see the Plugin Profiler at the bottom of the list:
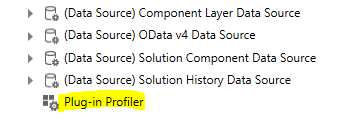
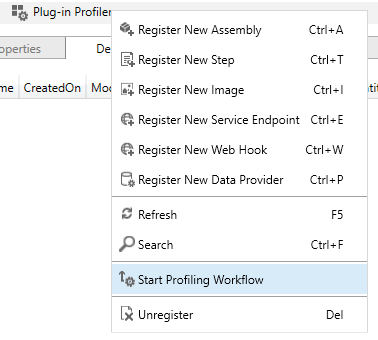
Right-click it and select Start Profiling Workflow:
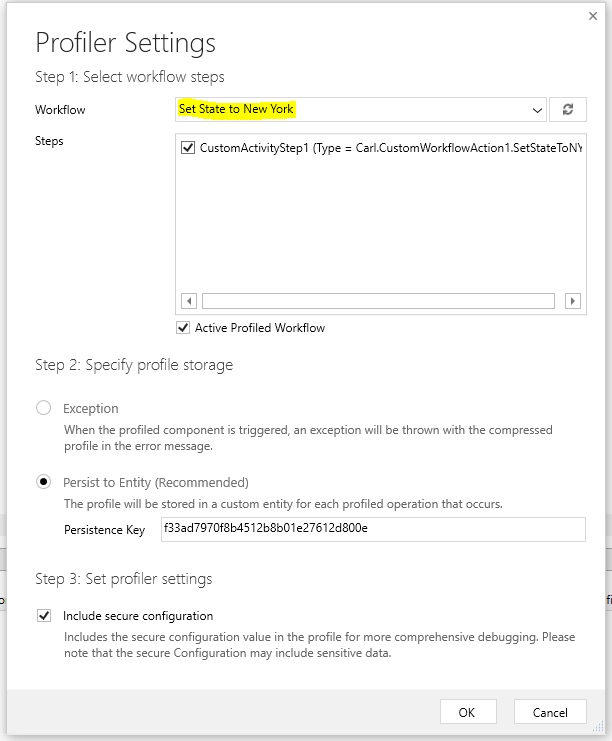
Find your workflow in the list and click OK:
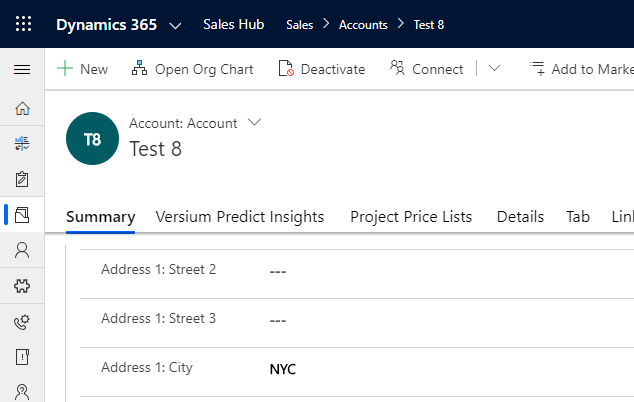
Now perform the action that runs the workflow custom activity. I.e. in our case we have a workflow running on saving the account with the city field populated.
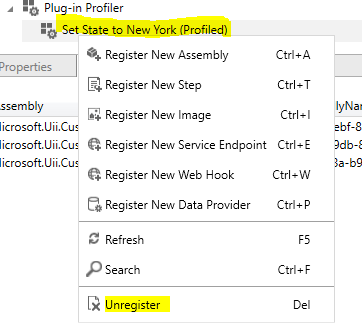
Once complete, expand Plug-in Profiler to find your profile and click Unregister:
Now from the top, select Replay Plug-in Execution:

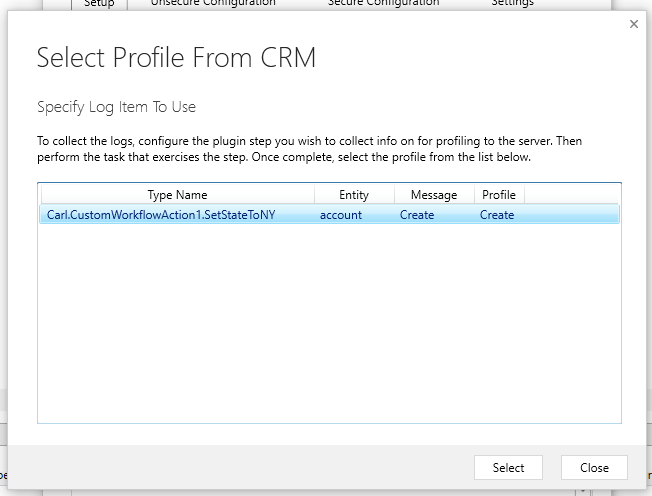
Select the
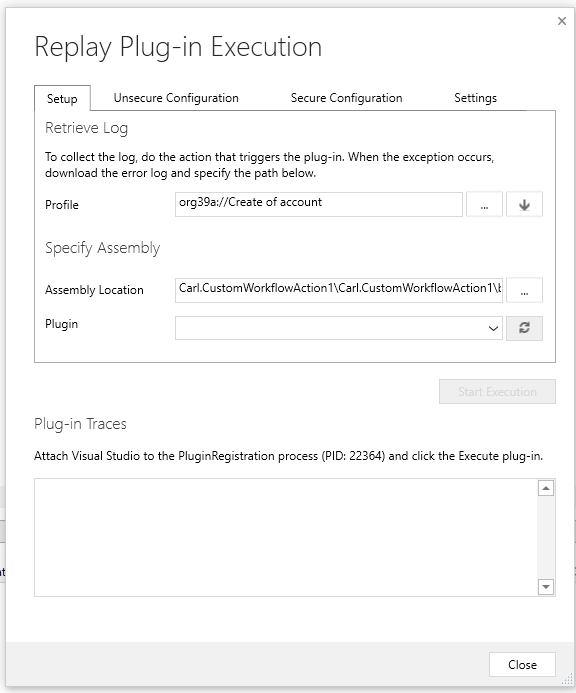
Select the assembly of the custom workflow assembly project
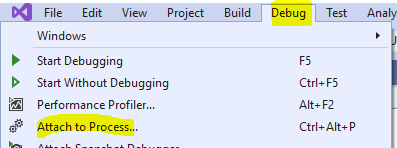
Now, jump over to your Visual Studio project for the custom workflow, select Debug then Attach to Process:
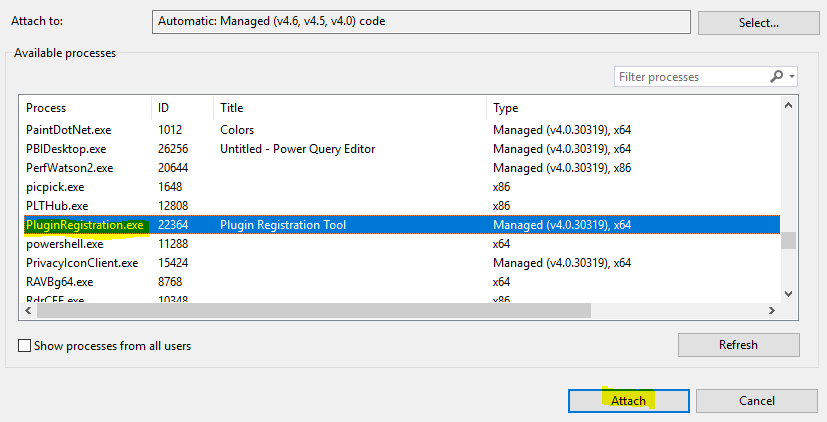
Find the PluginRegistrationTool and click Attach:
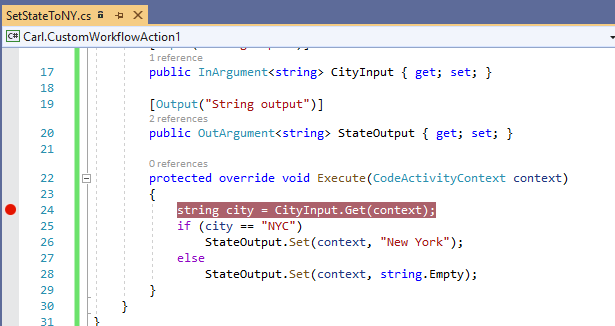
Add a breakpoint in the Execute method:
Back in the Plugin Registration Tool, click Start Execution:
![]()
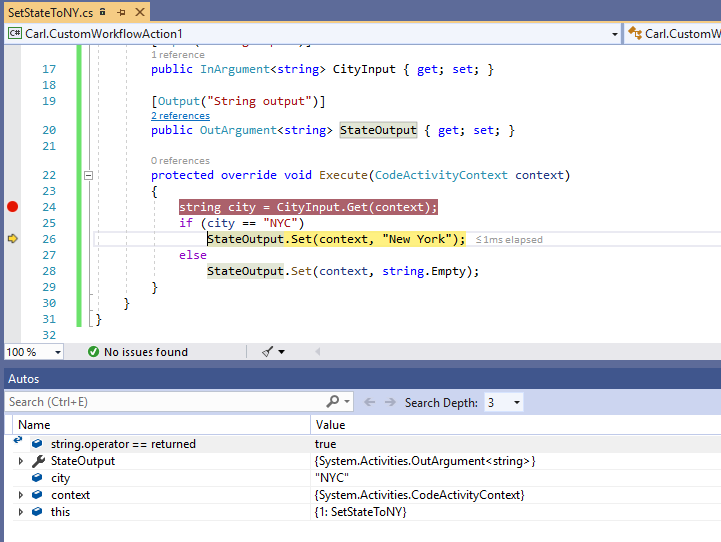
The breakpoint is hit, and you can start debugging:
I AM SPENDING MORE TIME THESE DAYS CREATING YOUTUBE VIDEOS TO HELP PEOPLE LEARN THE MICROSOFT POWER PLATFORM.
IF YOU WOULD LIKE TO SEE HOW I BUILD APPS, OR FIND SOMETHING USEFUL READING MY BLOG, I WOULD REALLY APPRECIATE YOU SUBSCRIBING TO MY YOUTUBE CHANNEL.
THANK YOU, AND LET'S KEEP LEARNING TOGETHER.
CARL

Hi,
Is there any possible way to debug a Custom workflow mapped in a Action.
I’m looking for the same thing – actions don’t appear in the list of ‘workflows’ when we use Start Profiling Workflows
If you have a plugin registered on that action, then yes; you can debug the plugin that runs on that action.
When I follow the step “Find your workflow in the list and click OK:” I can see my custom activities disabled any ideas?
It could be that you are using a Plugin Registration Tool for the version 8.x, try with the 9.x latest version.
Regards!
Step is disabled in Profile Settings and not able to debug, any suggestion?