To create a dashboard in the Power BI service, go through the following steps.
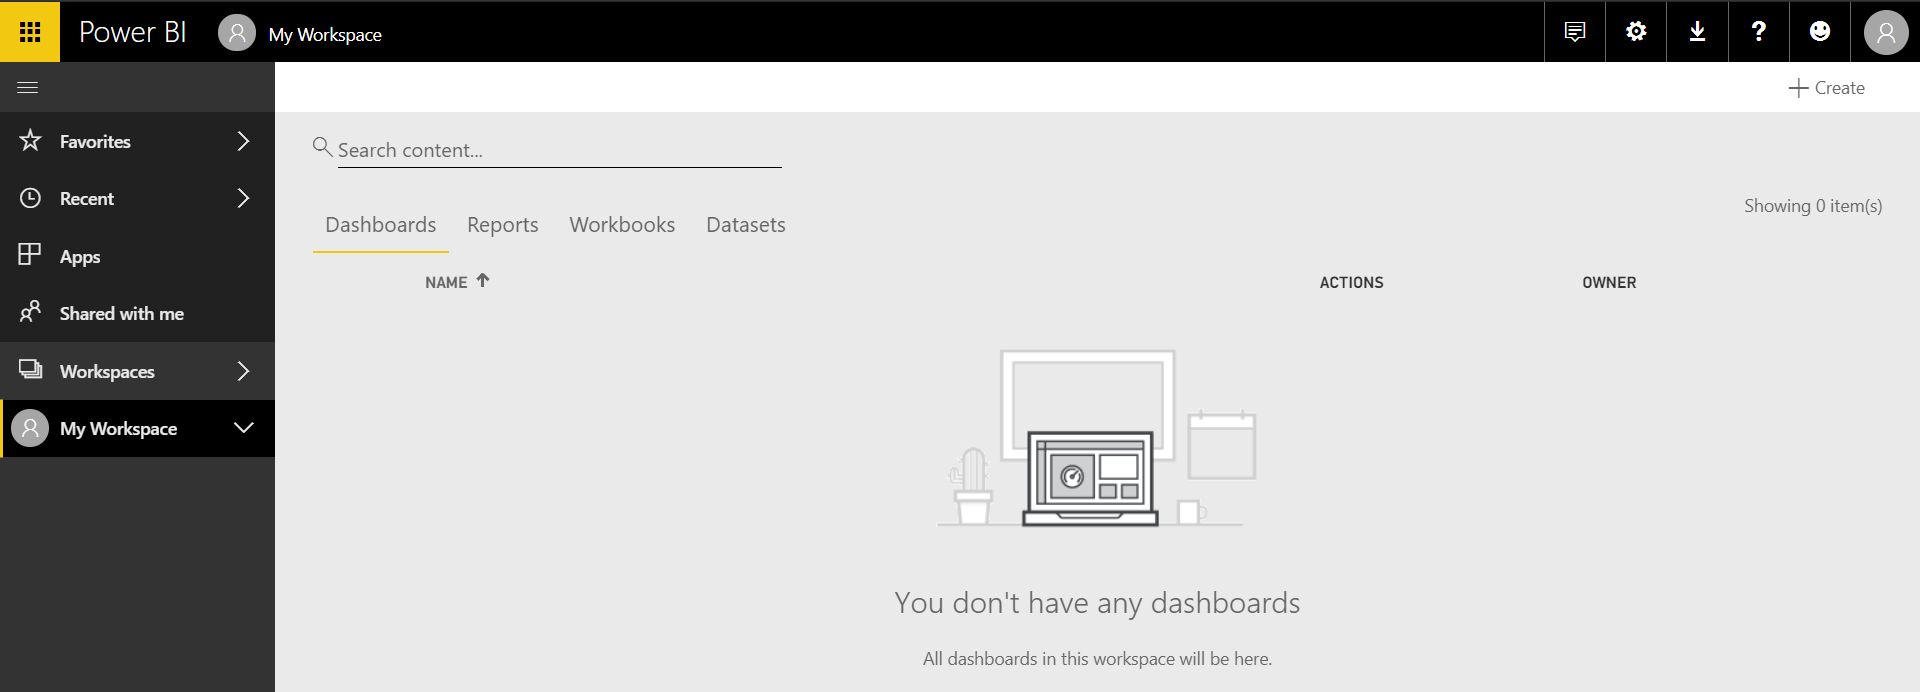
First, select your workspace:
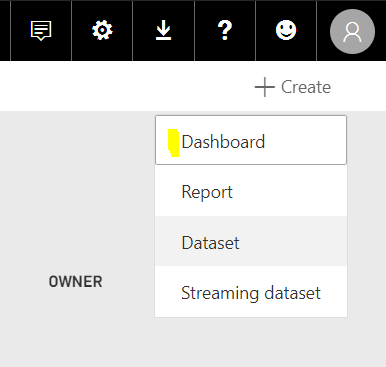
From the top right, select Create->Dashboard:
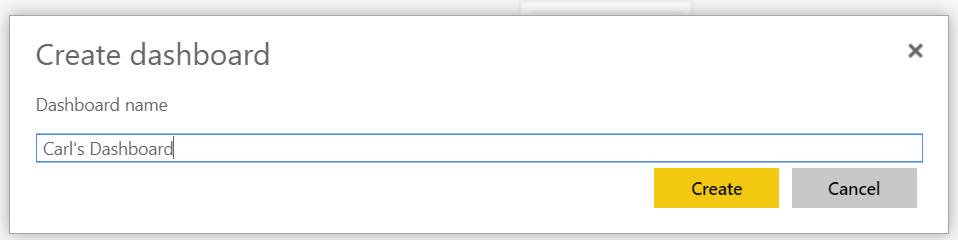
Provide a dashboard name, e.g. Carl’s Dashboard:
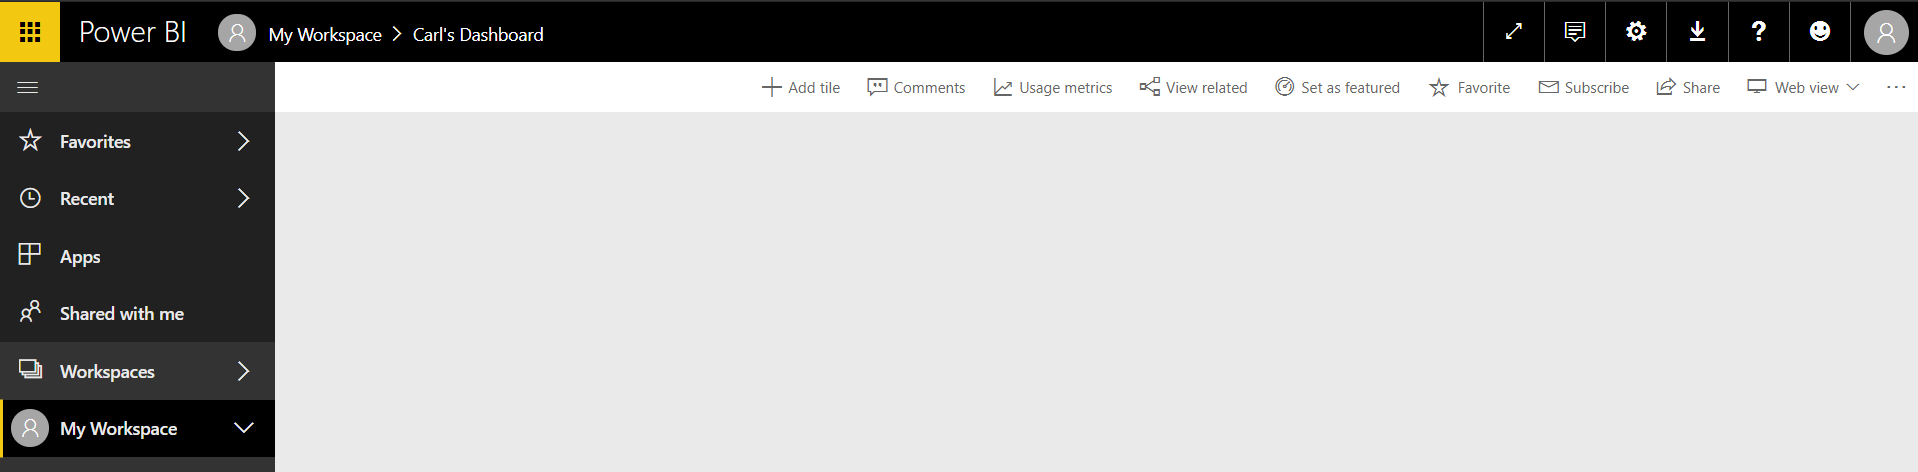
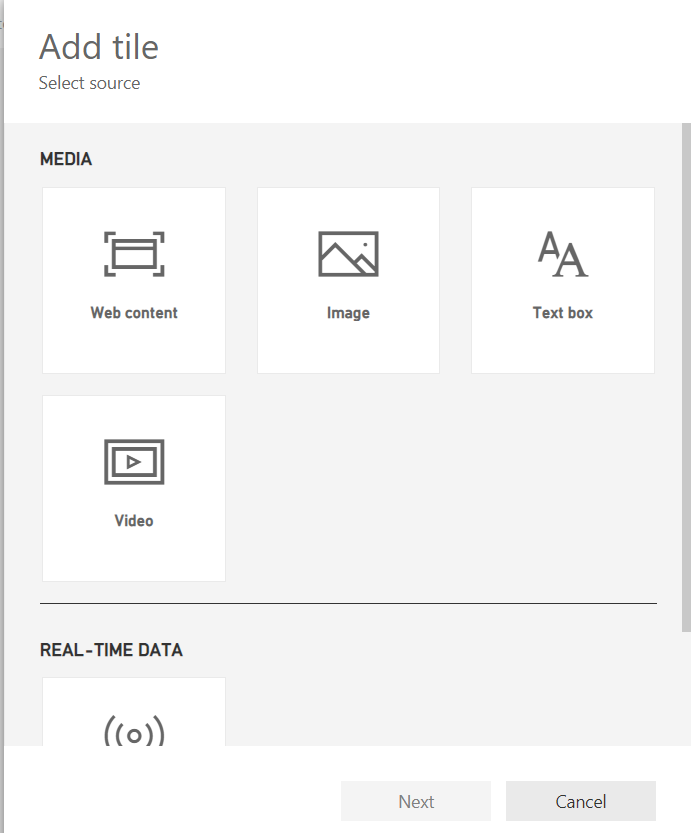
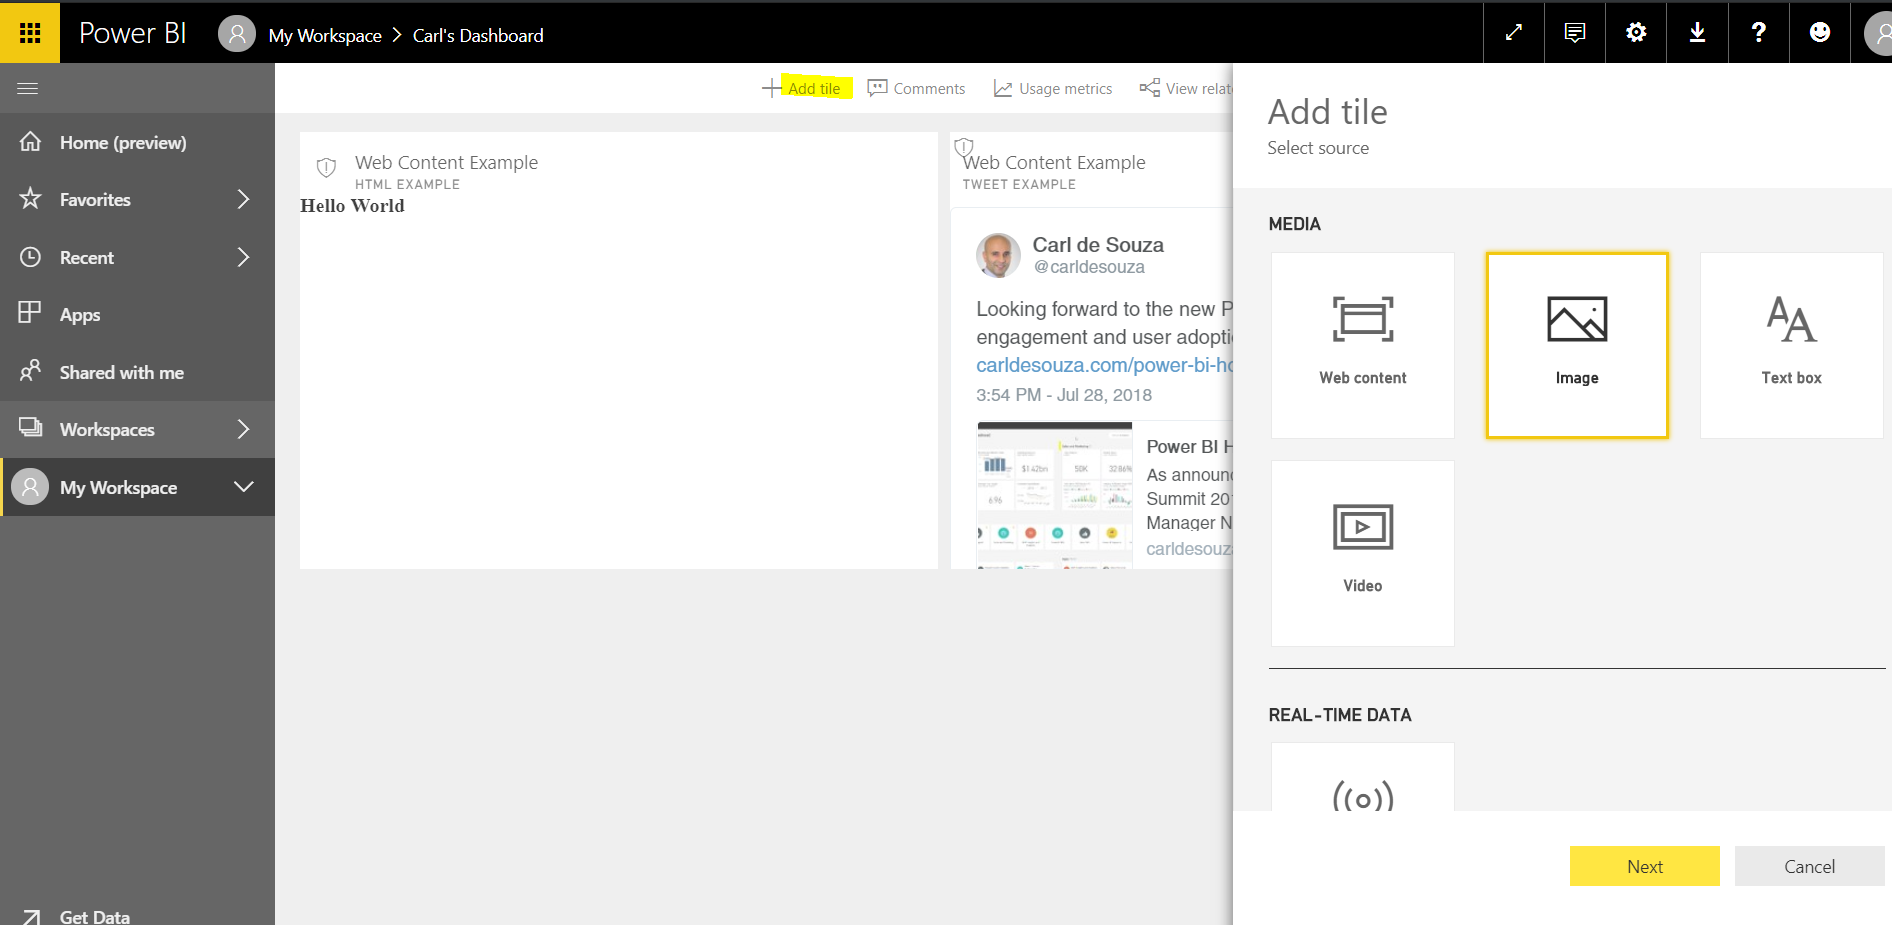
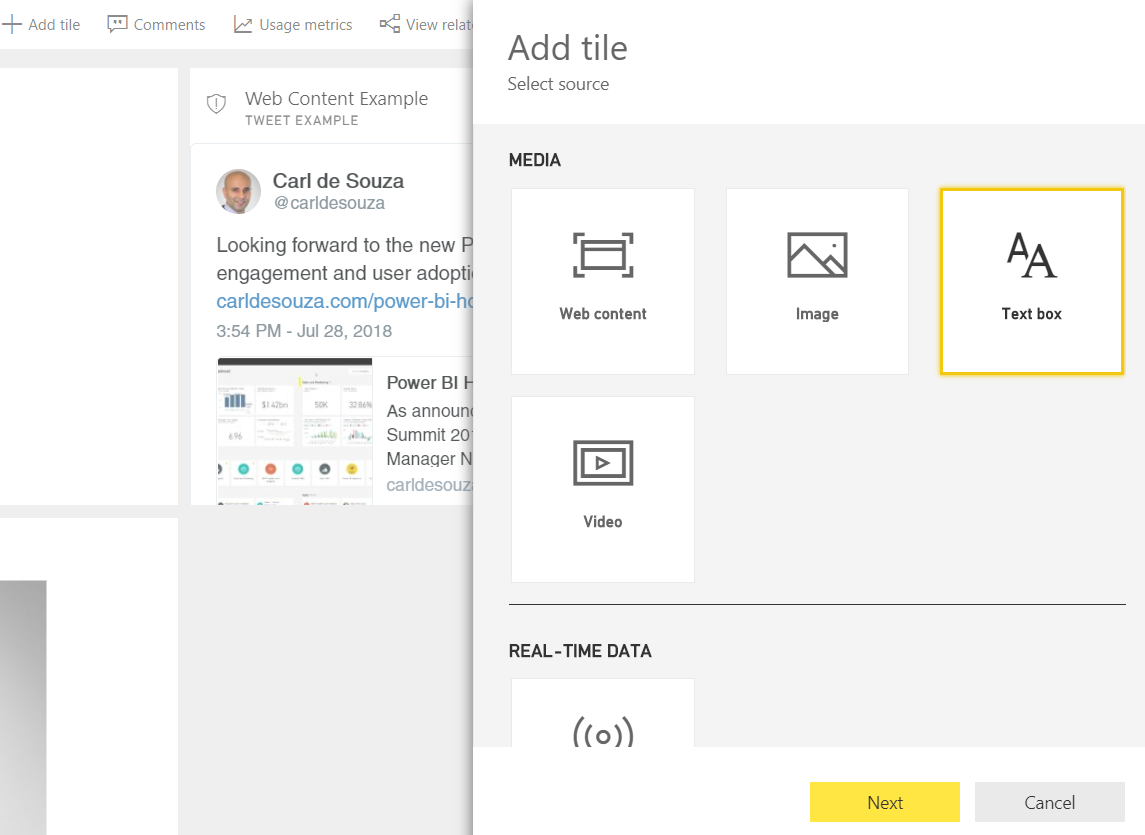
You will see a blank screen with options. Select + Add Tile:
You can select from:
- Web Content
- Image
- Text box
- Video
- Real-Time Data
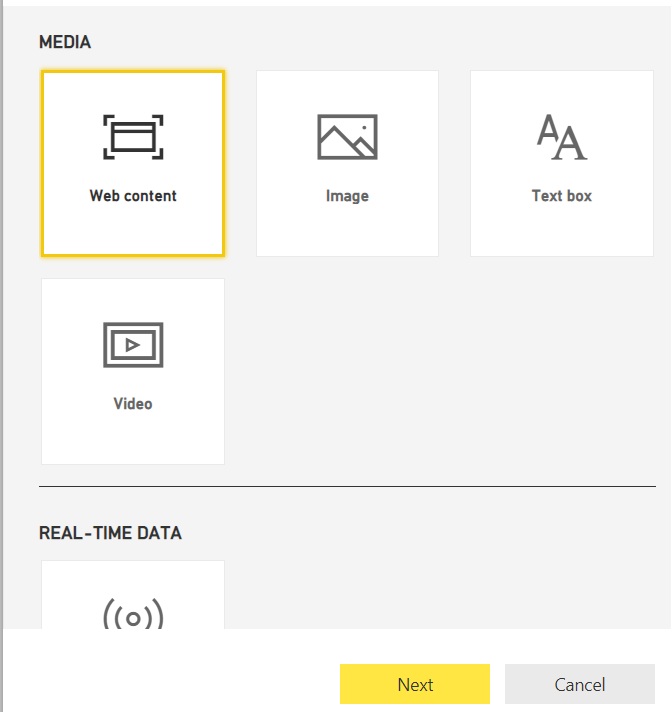
Web Content
Select web content. Click Next:
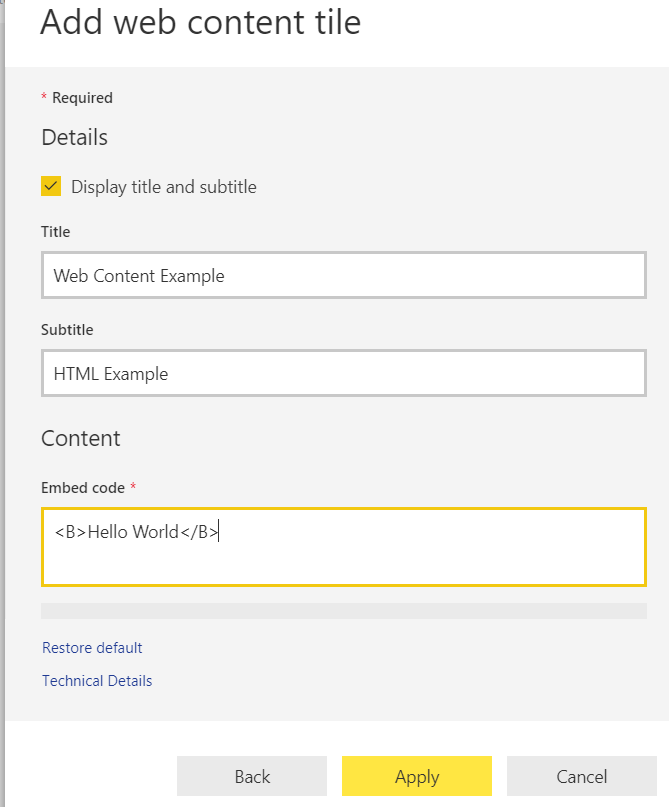
Here we can add web content such as HTML, embedding videos, tweets etc.
Let’s first add some HTML:
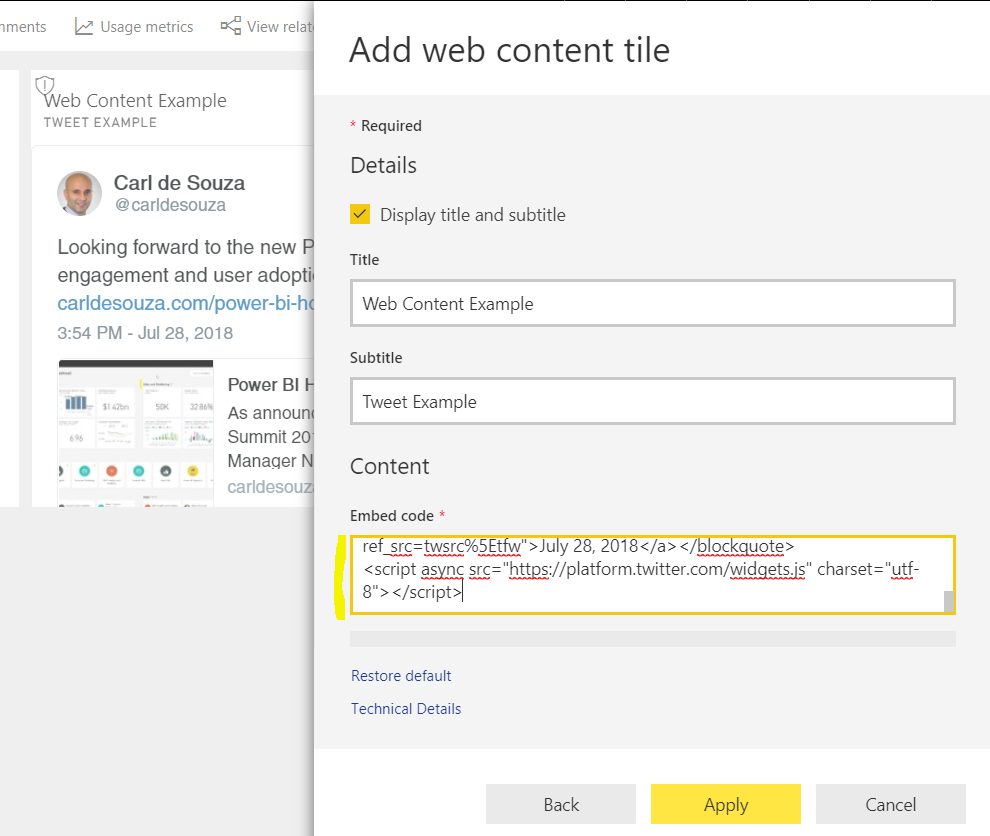
Next let’s embed a tweet. Go to Twitter, select a tweet and grab the embed code:
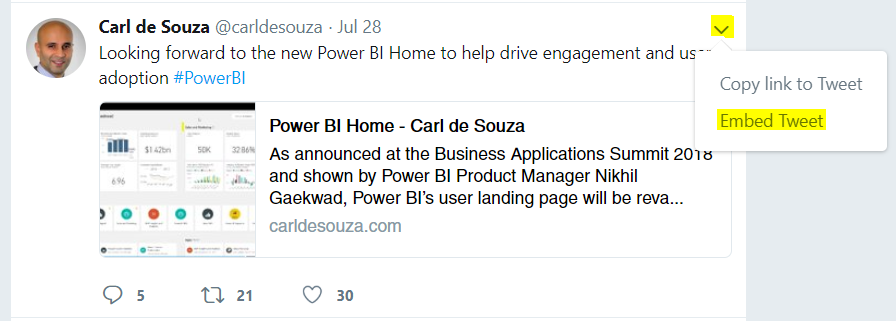
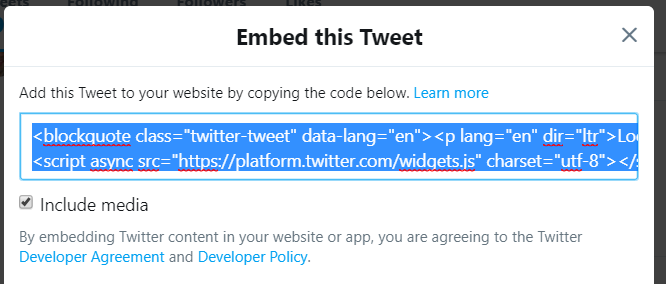
Paste and Apply:
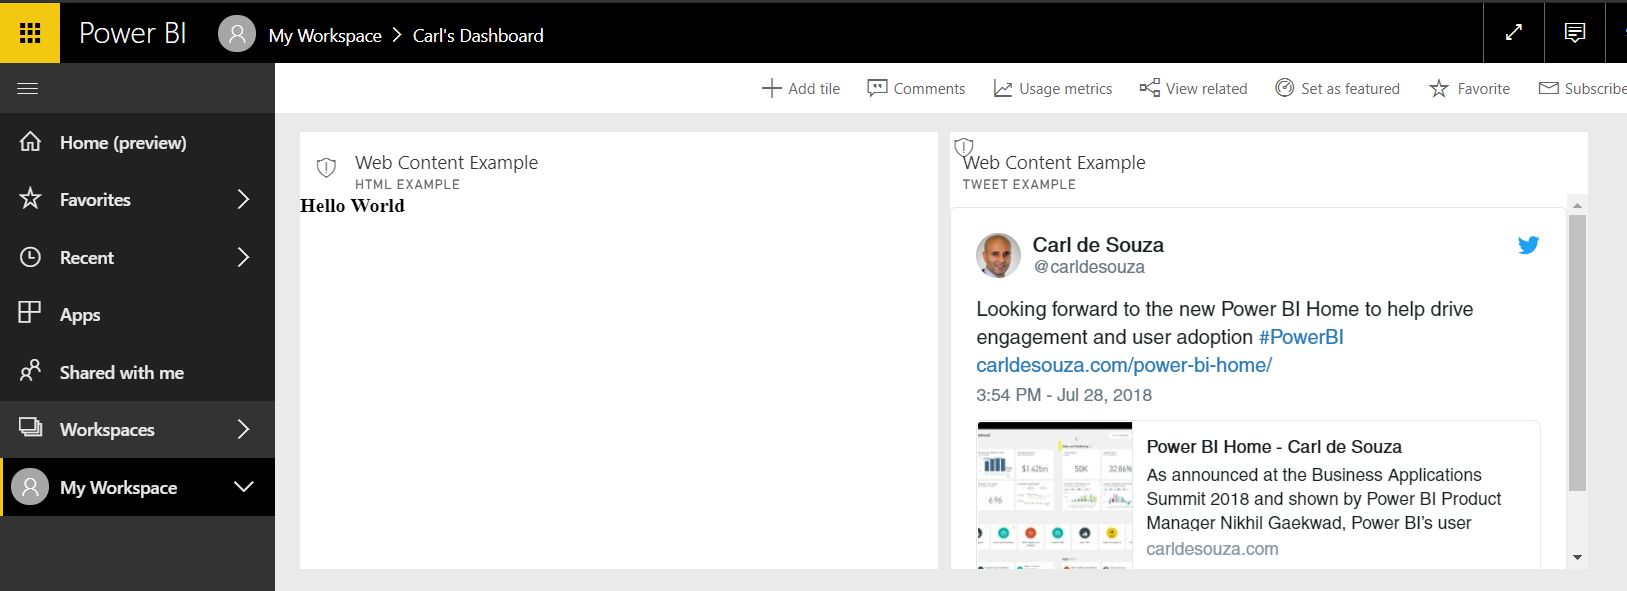
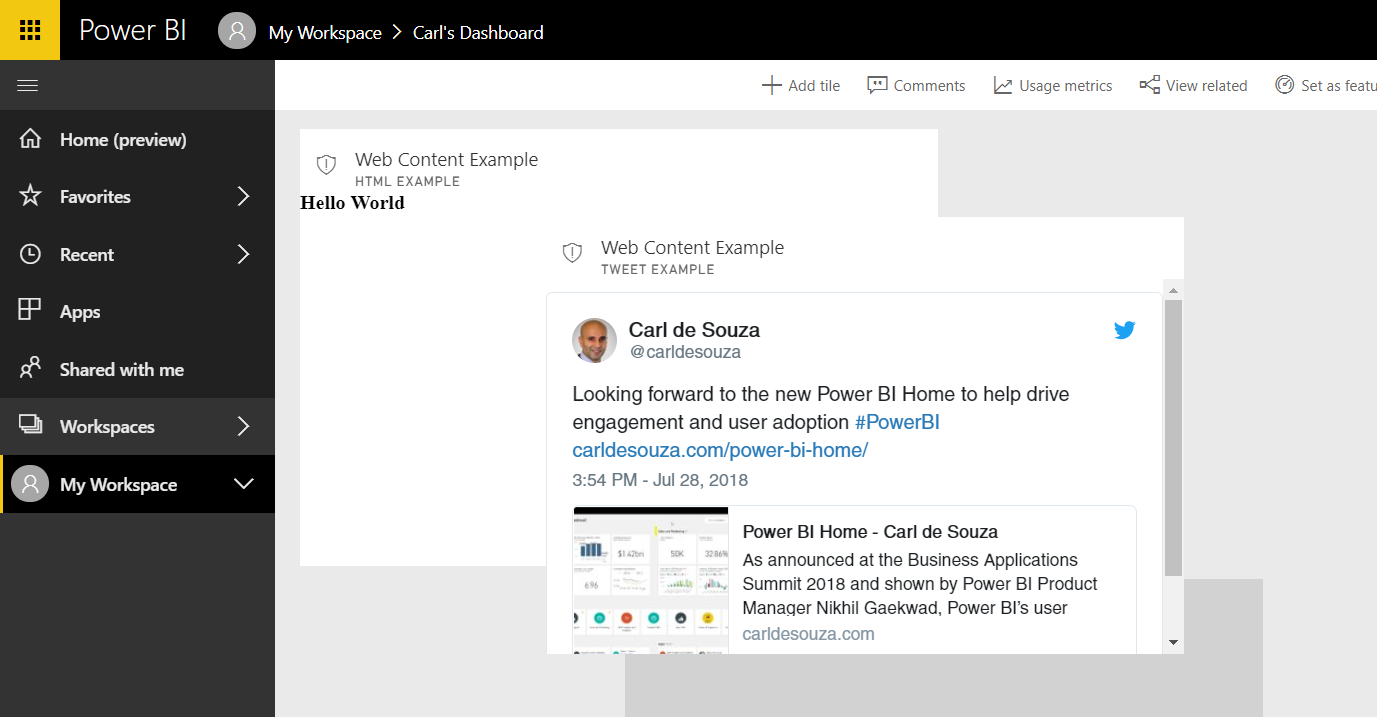
We now have 2 web content examples:
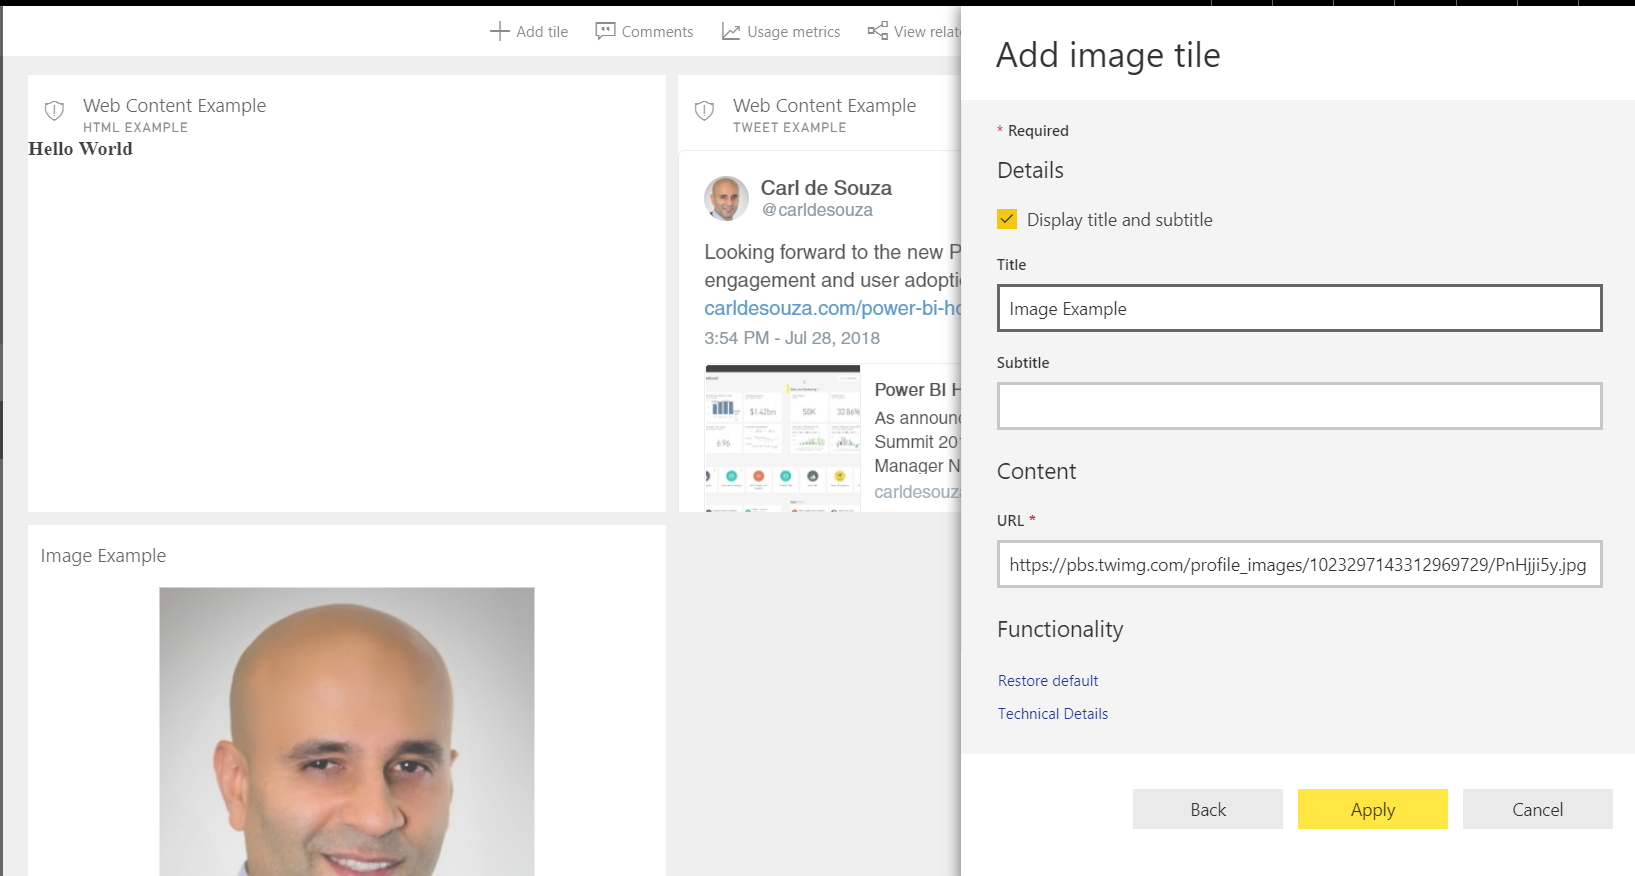
Images
Select Add Tile->Image->Next:
Let’s grab the URL of my profile picture from Twitter:
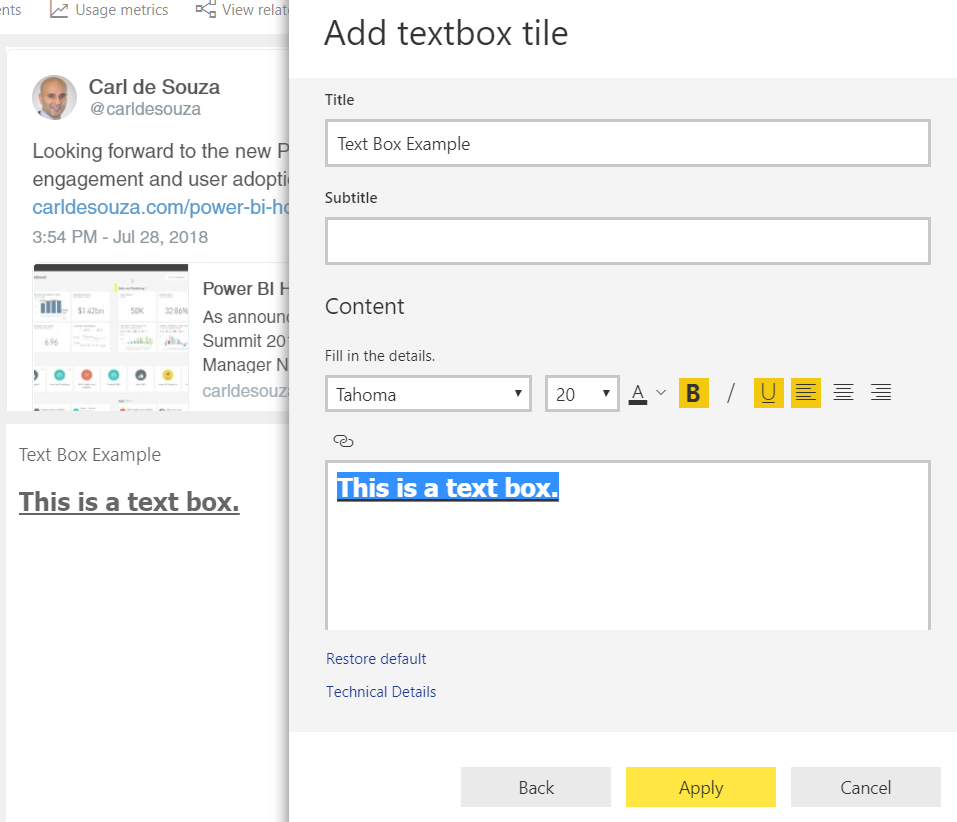
Text Box
Select Text Box:
Video
Add a video:
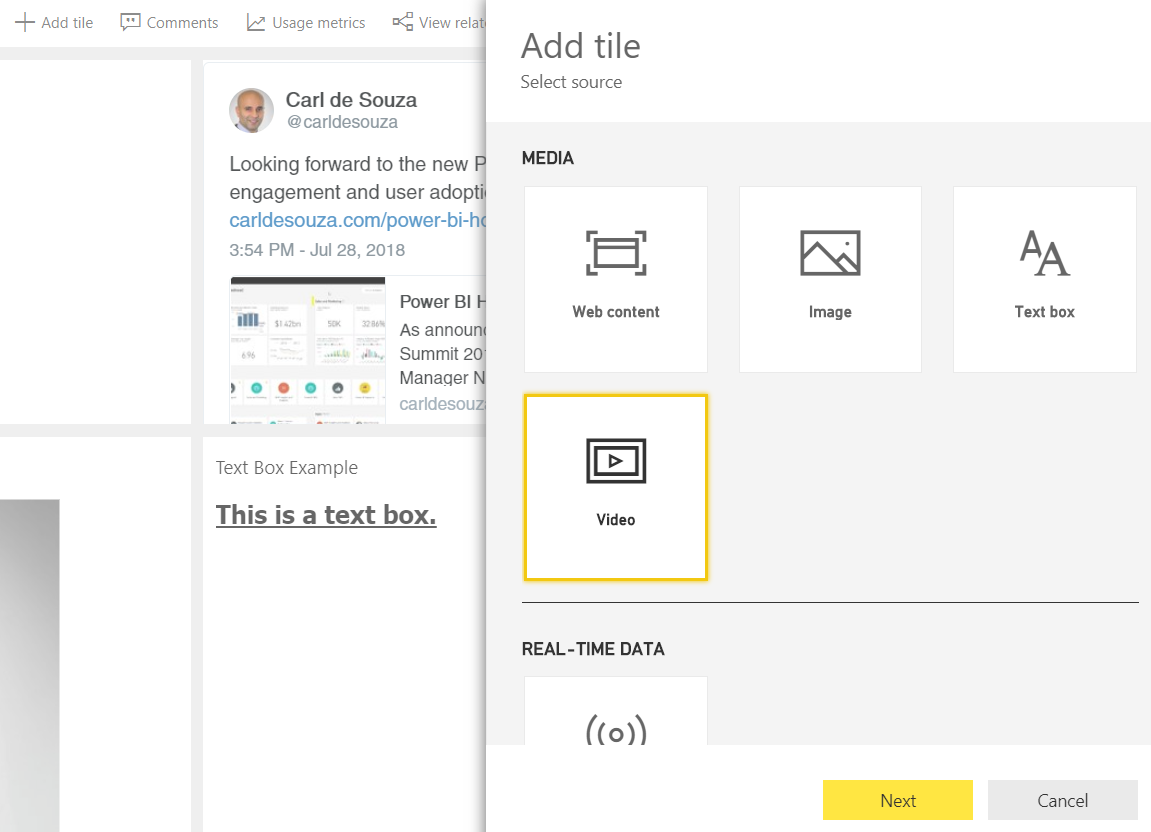
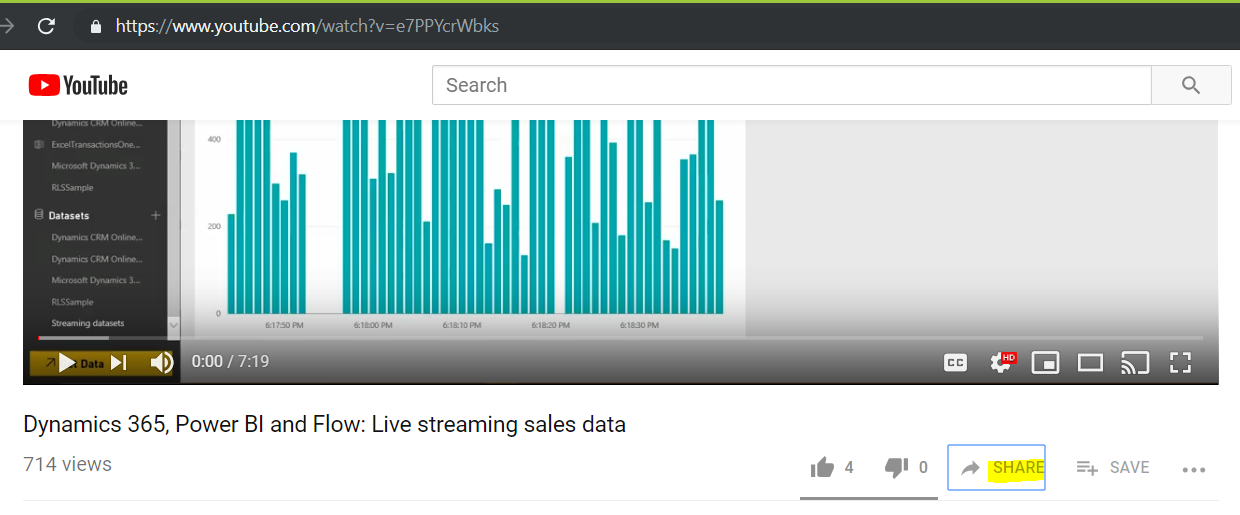
You can add from YouTube, Vimeo etc. We will use YouTube as an example. Select the video and either copy the URL from the address bar, or click share:
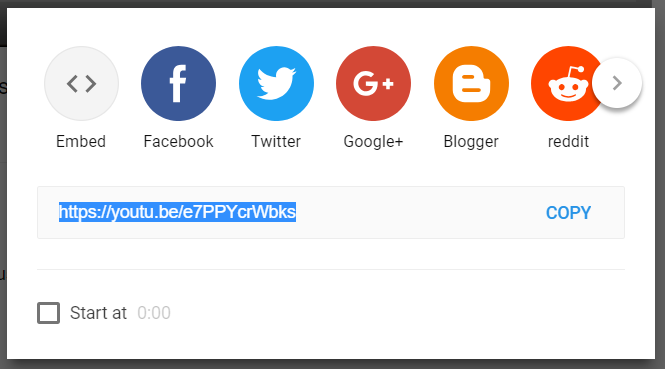
And copy the URL:
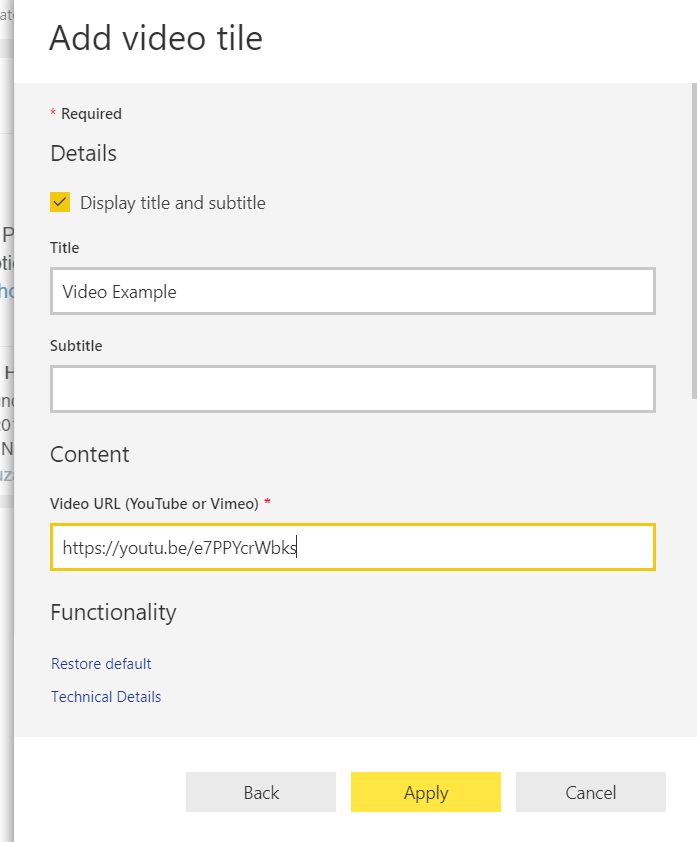
Copy to the tile:
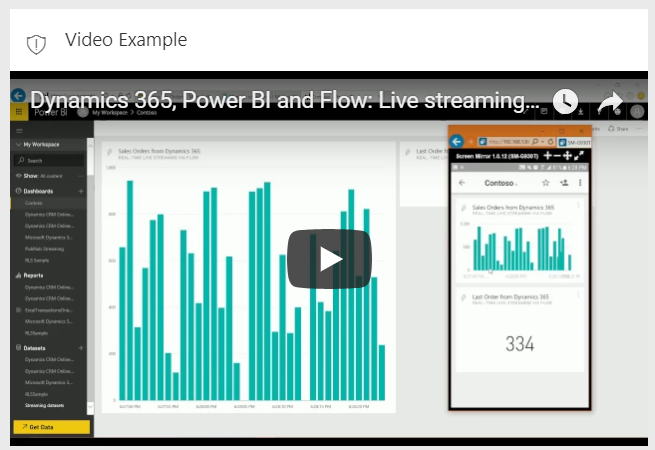
The tile will be added:
You can rearrange tiles on the dashboard by dragging them:
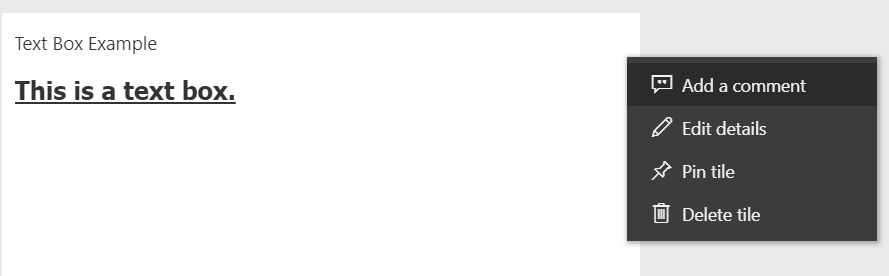
And by selecting a tile, you can Edit details, Add a comment, pin tile and delete tile:
Real-Time Data
For real-time data streaming, see my post here.
I AM SPENDING MORE TIME THESE DAYS CREATING YOUTUBE VIDEOS TO HELP PEOPLE LEARN THE MICROSOFT POWER PLATFORM.
IF YOU WOULD LIKE TO SEE HOW I BUILD APPS, OR FIND SOMETHING USEFUL READING MY BLOG, I WOULD REALLY APPRECIATE YOU SUBSCRIBING TO MY YOUTUBE CHANNEL.
THANK YOU, AND LET'S KEEP LEARNING TOGETHER.
CARL
