In this post, we will look at how Month to Date (TOTALMTD), Quarter to Date (TOTALQTD) and Year to Date (TOTALYTD) works and doesn’t work in Power BI. These functions can be tricky to use based on your data and what you are passing in. Let’s go through this.
At a high level, these “to date” functions are commonly used in the business world. Month to date generally refers to some numbers for this month up to today. For example, if today is the 15th of the month, and your boss asks you for the month to date sales figures, you will want to add your sales from the 1st of the month up to the 14th (as the 15th is not complete yet). In Power BI, there are DAX functions that can help with MTD calculations. The same logic applies to Quarter to Date (give me the sales for this quarter up to now), and Year to Date (numbers for this year). This can be useful if you are comparing how you are progressing from a previous year vs the current year. Let’s see how these work in Power BI.
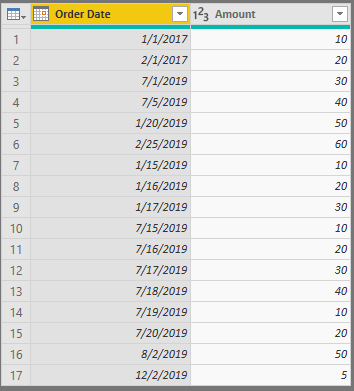
We will start with our data. I have a data set that looks like below, entered straight into Power BI, that contains an Order Date and an Amount. Note the date today is 7/18/2019, which means I have an order today and 4 orders after today (rows 14 to 17 below):
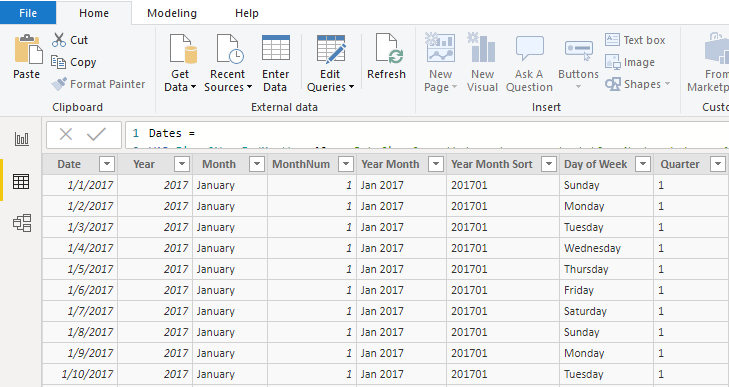
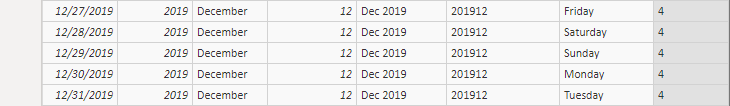
We will also add a generic date table, with columns below including Year, Month, Quarter and Year-Month. The date table starts at 1/1/2017 and ends on 12/31/2019. I’m using CALENDARAUTO to generate the table, which means when the date table is loaded, it will look at the start and end dates in my Orders data set and build the table based on that, hence the date range below:
To understand how the MTD, QTD and YTD functions work, you need to understand how your date tables are set up, as you will get different results based on your date tables. We will take a look at these different results in this post.
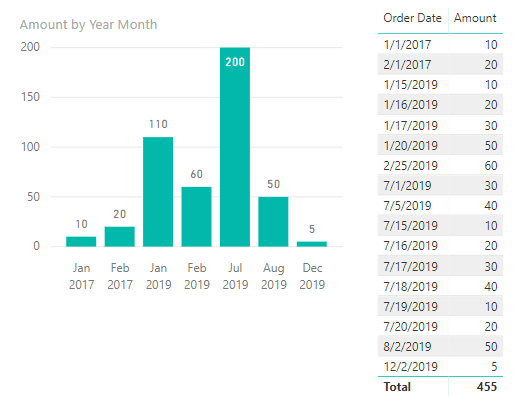
Now, it helps to visualize our data, so here is a clustered column chart. We can see we have some orders in January and February 2017, and January, February, and July in 2019. We also have some future orders going into December 2019:
Now let’s add 3 measures, MTD, QTD, and YTD.
MTD:
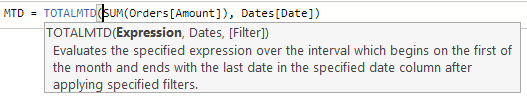
MTD = TOTALMTD(SUM(Orders[Amount]), Dates[Date])
QTD:
QTD = TOTALQTD(SUM(Orders[Amount]), Dates[Date])
YTD:
YTD = TOTALYTD(SUM(Orders[Amount]), Dates[Date])
And let’s create 4 filters – Year, Month, Quarter and Year-Month. Let’s add these to our report and take a look at the numbers.
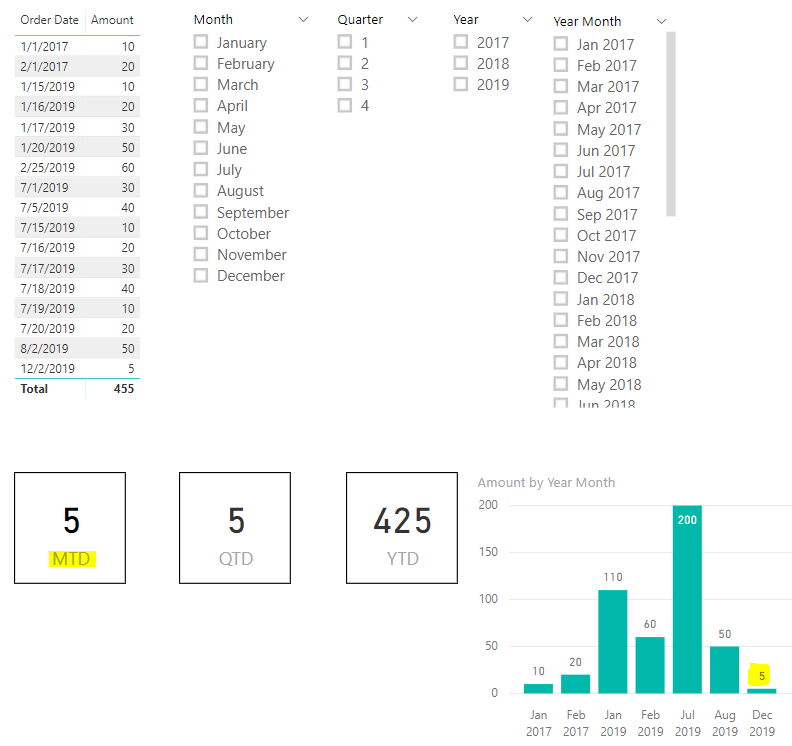
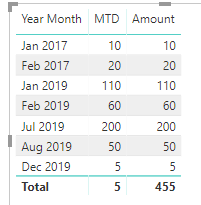
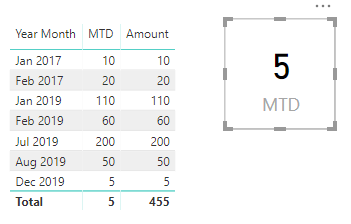
Let’s start with MTD. We can see that the total calculated is 5. How would the “Month to Date” equal 5? We would expect as the current month is July, we could add the numbers for July up to today to get the month “to date”. In Power BI, this calculation is done differently. As we are supplying a date table as a parameter to our MTD function, the last date in our function is December 31st, 2019. So the “Month” is December 2019, and we have a record on 12/2/2019 for 5.
Now what if we change our date table dates. Let’s make our range 1/1/2017 to 10/01/2019. We can use CALENDAR to do this, then add the columns for year, month, quarter etc:
CALENDAR(DATE(2017, 01, 01), DATE(2019, 10, 31))
Now when we run this, we get BLANK returned on our visual:
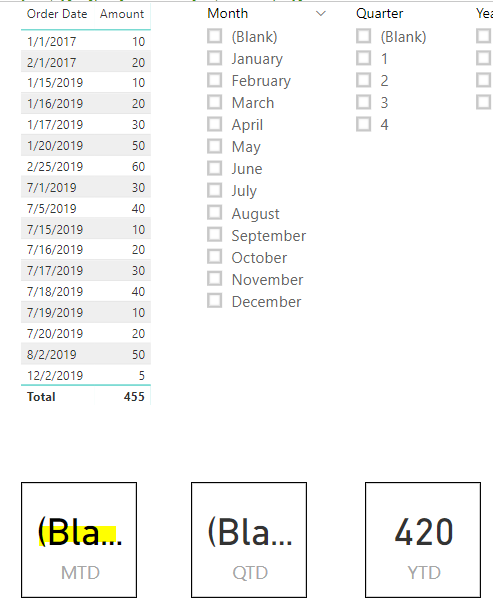
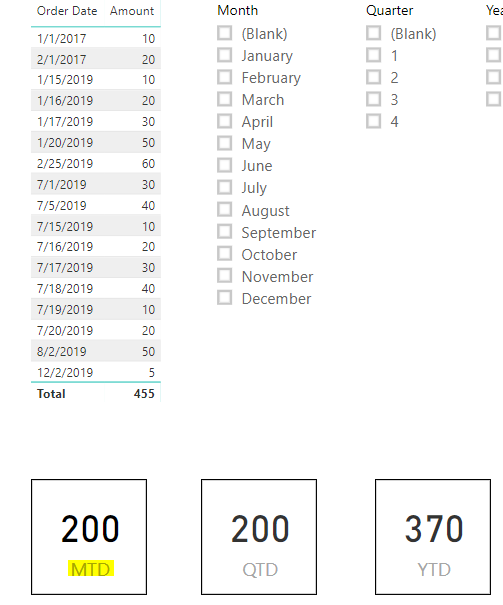
The reason being, Power BI is looking now at October 2019 as the month date, and we have no data for October. If we change the end date to 7/31/2019 we get 200 returned. This is interesting because it’s now in the current month of July 2019, but it is also including data for all of July (200), including today and tomorrow’s date. So this doesn’t give us the Month to Date in financial terms as well:
Let’s set the Orders table back to our end date as 12/31/2019. Now what if instead of using our date table, we used our orders table, which has the order date?
MTD = TOTALMTD(SUM(Orders[Amount]), Orders[Order Date])
This produces the same result, as our last order date is 12/2.
Also if we add this to a table, we get the same issue. Our MTD is basically the same as adding the amounts:
So now we know that TOTALMTD needs to know the date to use for our TOTALMTD. How can we use it? We can see TOTALMTD takes 3 parameters, our expression, dates and filter:
Let’s try using a filter to filter all dates before today:
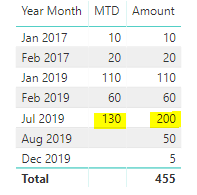
MTD = TOTALMTD(SUM(Orders[Amount]), Dates[Date], FILTER(Dates, Dates[Date] < TODAY()))
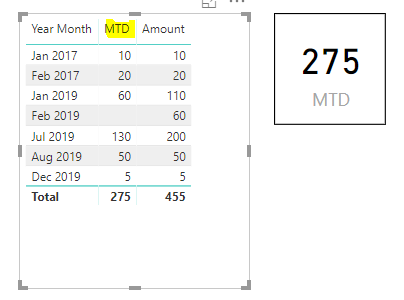
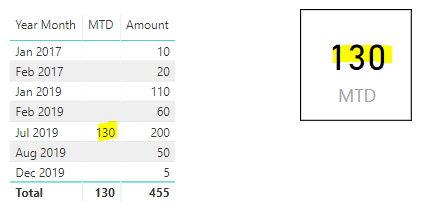
We can see if we put this in our table, our July figure now looks correct. All sales up to today are 130, and the whole month is 200. Previous months are the full amount, future amounts are blank:
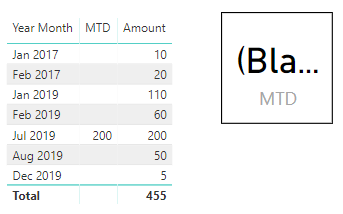
As our date context is still up to December 2019, our card visual is still blank:

What if we match the Month and Year?
MTD = TOTALMTD(SUM(Orders[Amount]), Dates[Date], FILTER(Dates, MONTH(Dates[Date]) = MONTH(TODAY()) && YEAR(Dates[Date]) = YEAR(TODAY())))
We get below:
DAX also has a function DATESMTD. In using this, we still run into the current date issue, with DATESMTD assuming we are in December 2019:
MTD = CALCULATE(SUM(Orders[Amount]), DATESMTD(Dates[Date]))
Using TODAY(), we can use CALCULATE to figure out our MTD, let’s say if we want to know the total for each month up until this day in that month:
MTD = CALCULATE(SUM(Orders[Amount]), FILTER(Dates, Dates[Date] >= DATE(YEAR(Dates[Date]), MONTH(Dates[Date]), 01)), FILTER(Dates, Dates[Date] < DATE(YEAR(Dates[Date]), MONTH(Dates[Date]), DAY(TODAY()))))
These MTD values show us the right amounts, only including before today for each month. However our card measure is off:
To fix this and only show this month to date, we can use:
MTD = CALCULATE(SUM(Orders[Amount]), FILTER(Dates, Dates[Date] >= DATE(YEAR(TODAY()), MONTH(TODAY()), 01)), FILTER(Dates, Dates[Date] < TODAY()))
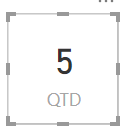
Quarter to date is similar, in that our date table shows dates in the last calendar quarter of the year, so we only get 5 as our October-November-December figure:
And Year to Date will show the total for the year in the date table. If our date table went to the end of 2017, our TOTALYTD will only show 2017 numbers. I’ll save those functions for another post, or feel free to add to the comments below.
I AM SPENDING MORE TIME THESE DAYS CREATING YOUTUBE VIDEOS TO HELP PEOPLE LEARN THE MICROSOFT POWER PLATFORM.
IF YOU WOULD LIKE TO SEE HOW I BUILD APPS, OR FIND SOMETHING USEFUL READING MY BLOG, I WOULD REALLY APPRECIATE YOU SUBSCRIBING TO MY YOUTUBE CHANNEL.
THANK YOU, AND LET'S KEEP LEARNING TOGETHER.
CARL

Hi, nice post!
I am using your formula to get the MTD each day of the month (eg. 9 Dec, 9 Nov, 9 Oct) etc and it works well.
MTD = CALCULATE(SUM(Orders[Amount]), FILTER(Dates, Dates[Date] >= DATE(YEAR(Dates[Date]), MONTH(Dates[Date]), 01)), FILTER(Dates, Dates[Date] < DATE(YEAR(Dates[Date]), MONTH(Dates[Date]), DAY(TODAY()))))
However, I am trying to get the Prior Month to Date by tweaking the formula, and can't get it to work. My goal is to be able to compare the variation between MTD and Prior MTD, each day as the sales add up. Is this just a matter of inserting Month-1 at the right place? Thanks in advance for your help!
Your detailed post has been super helpful and it has helped me to resolve some MTD pains! Thank you so much for posting this.
Thanks Audrey! Glad it helped 🙂
Your post should be included in the TOTALMTD manual pange. It would save everybody a lot of trouble. Thanks!
Thanks Alexis! Maybe they’ll link to this page one day 😀
Hello Carl, thanks for the detailed note on MTD. Used the formula and it worked. How do compare vs previous month same time?
Hi Carl,
In your example above:
MTD = TOTALMTD(SUM(Orders[Amount]), Dates[Date], FILTER(Dates, Dates[Date] < TODAY()))
This properly shows the amounts for the full months, and the amount of the current month up to yesterday. Now what measure could be build on top of this, that would return both of these variances in a single column:
– For full months, the $ variance between one and its previous month
– For the current month, the $ variance, based on the same period last month (eg mtd 9 May vs. mtd 9 april)
Thanks!
for prior month MTD try: TOTALMTD(sum(Orders[Amount])
,DATEADD(FILTER(DATESMTD(Dates[Date])
,Dates[Date]<TODAY()),-1,month))
How to calculate prior Year MTD,QTD YTD?
Hi Carl
Will you be going to post around the Quarter and YTD functions?
Just struggling to build these functions out!
Thanks so much
How to calculate LY MTD to be displayed on a card in power BI
Hi
Thanks for sharing!
I add the formula for previous day that I need:
Previous day sales = CALCULATE(SUM(SalesShipment[LineAmount]), PREVIOUSDAY(SalesShipment[PostingDate]))
But doesnt work.
Any solution??
The QTD and MTD work great. How to achieve YTD using the same structure? I tried it with just replacing Quarter with YEAR and it just returns a blank value.
How did you get QTD to work? Can you share it please.
Beautiful! Such a useful lesson on exactly how these functions work. Thank you so much.