To build a basic report in Dynamics CRM, you can go through the following steps by using the Report Wizard.
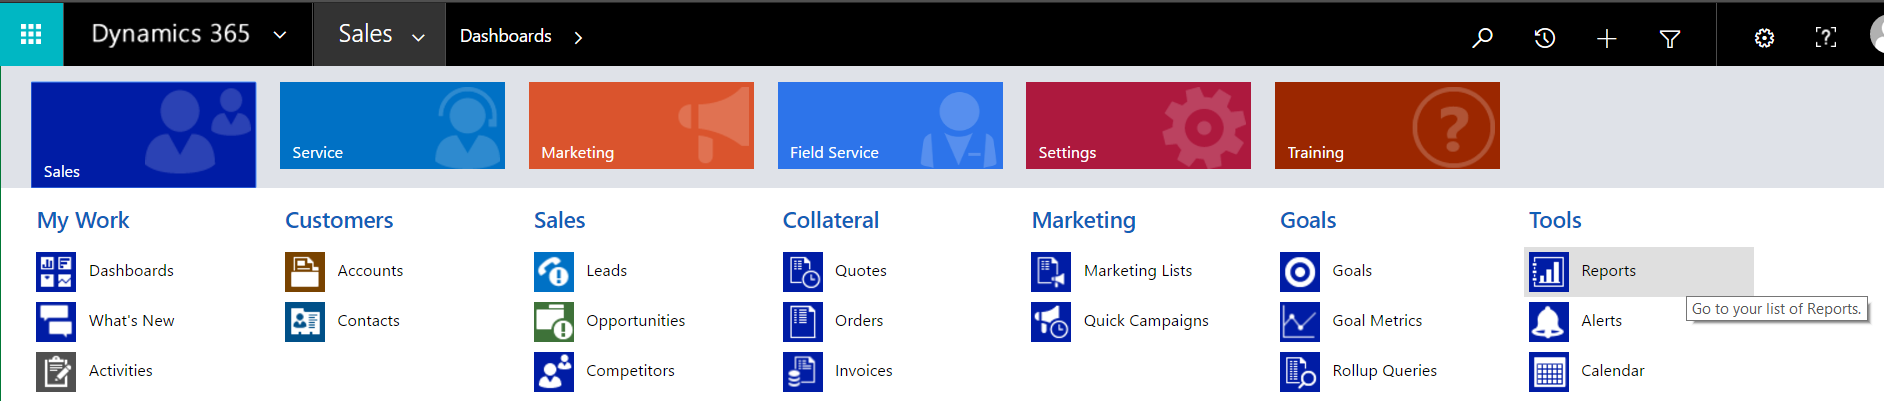
- In CRM, select Reports from the menu:
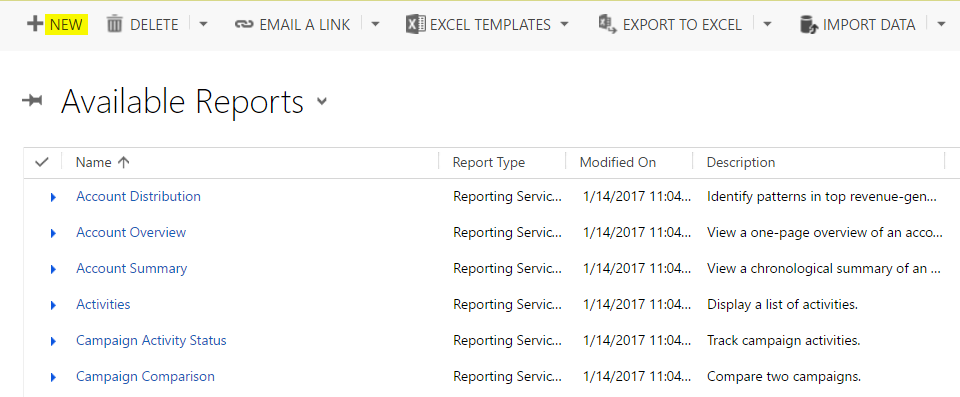
- Select New from the menu:
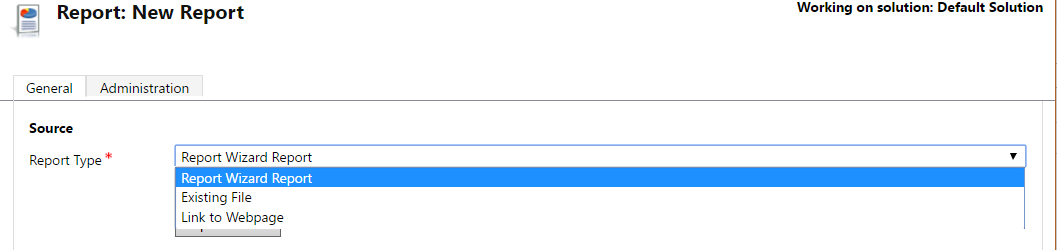
- This will open the New Report window. Select Report Wizard Report as the Report Type and click Report Wizard:

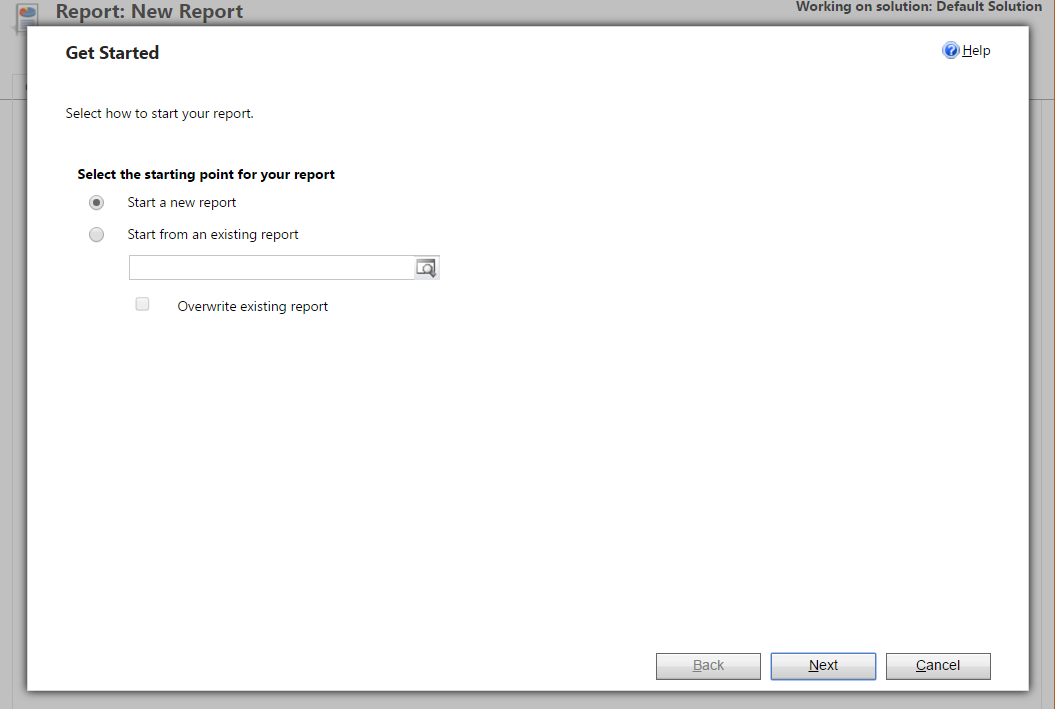
- Click Start a new report:
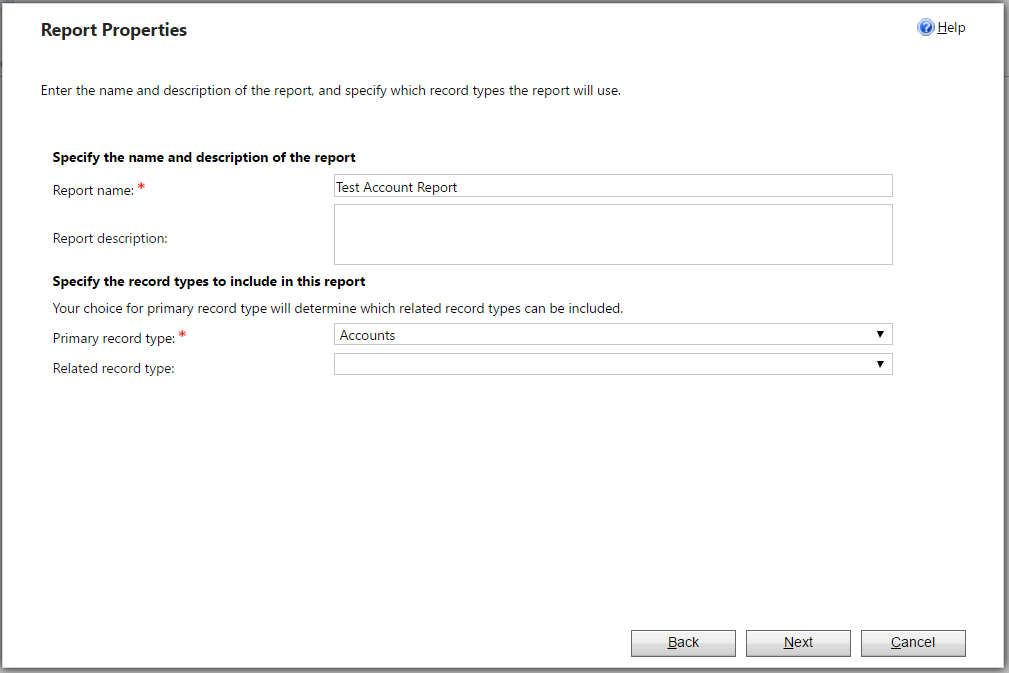
- Select Account as the primary record type. We will name the report “Test Account Report”:
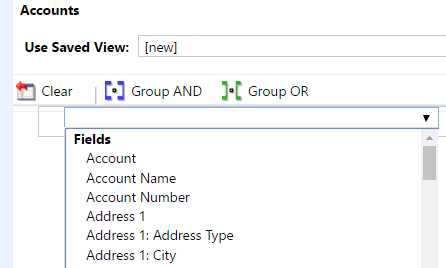
- The next screen will allow you to enter any filtering criteria. We will ignore this for now.
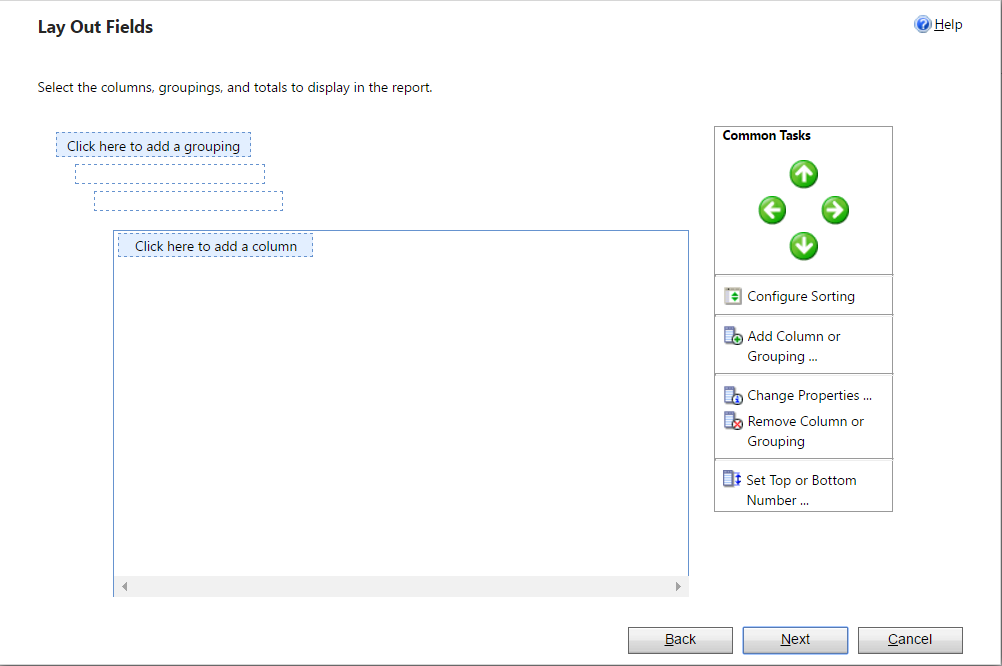
- We can then add grouping and sorting, and select the columns we want to display to the user. Click on “Click here to add a column”:
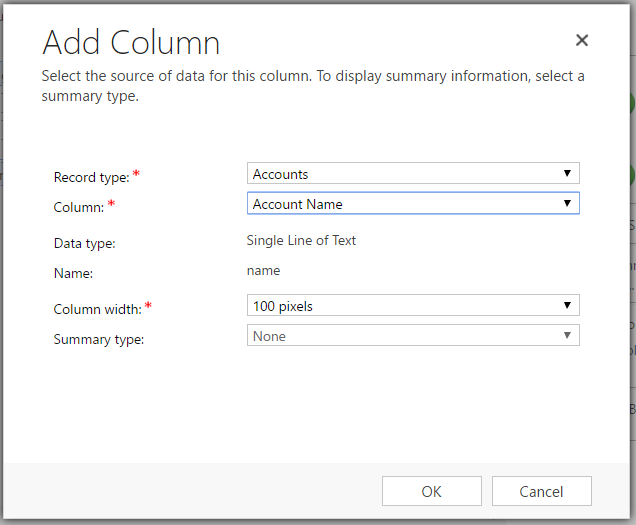
Select Account Name:
- Also add City and click Next.
- We have the option here to define the format of the report. Select “Table Only” for now:
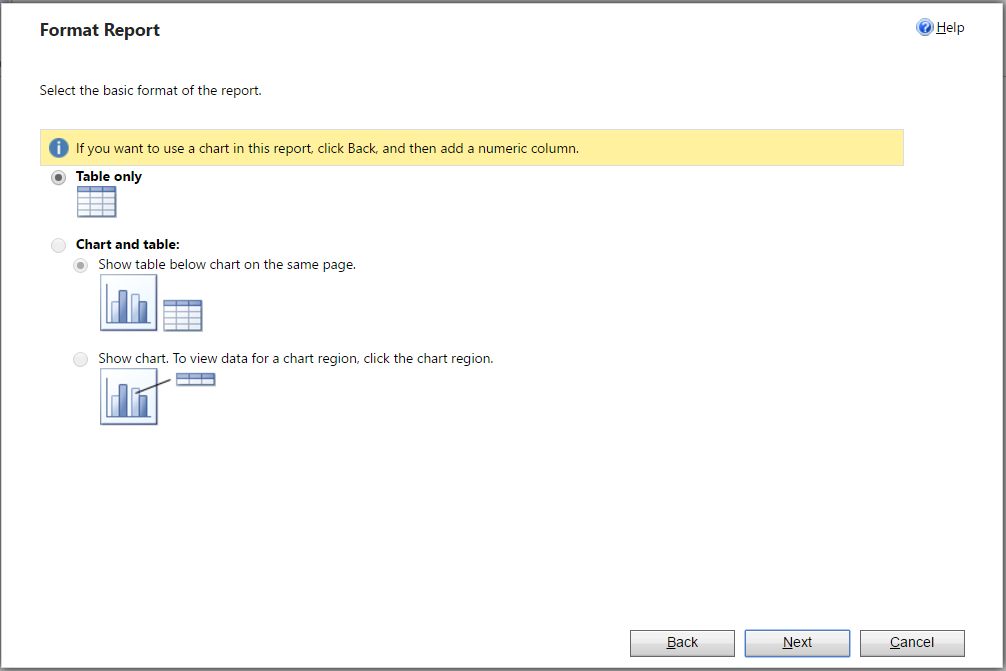
- Select Next and Finish:
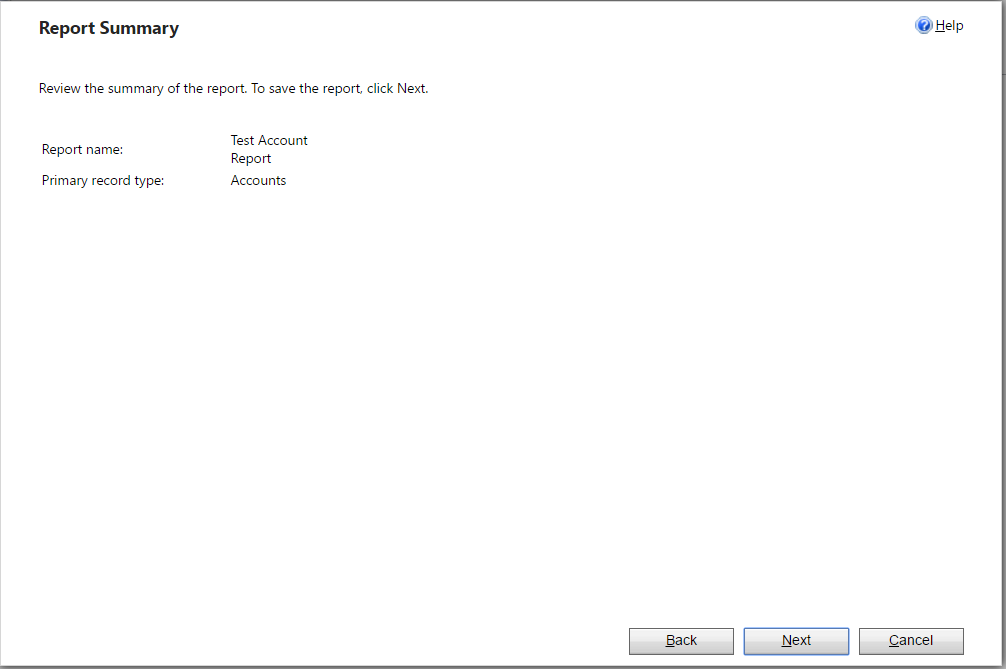
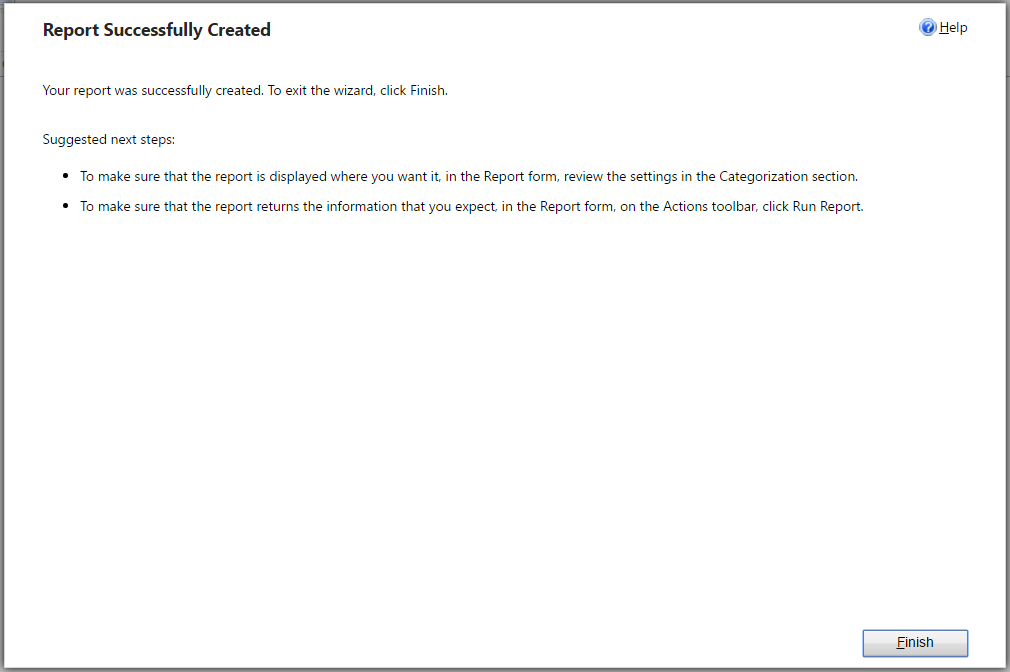
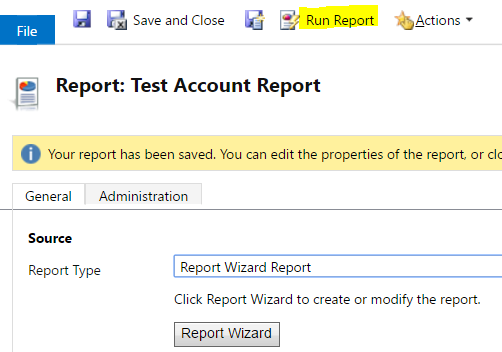
- We can now run the report. To do this, select Run Report from the report menu:
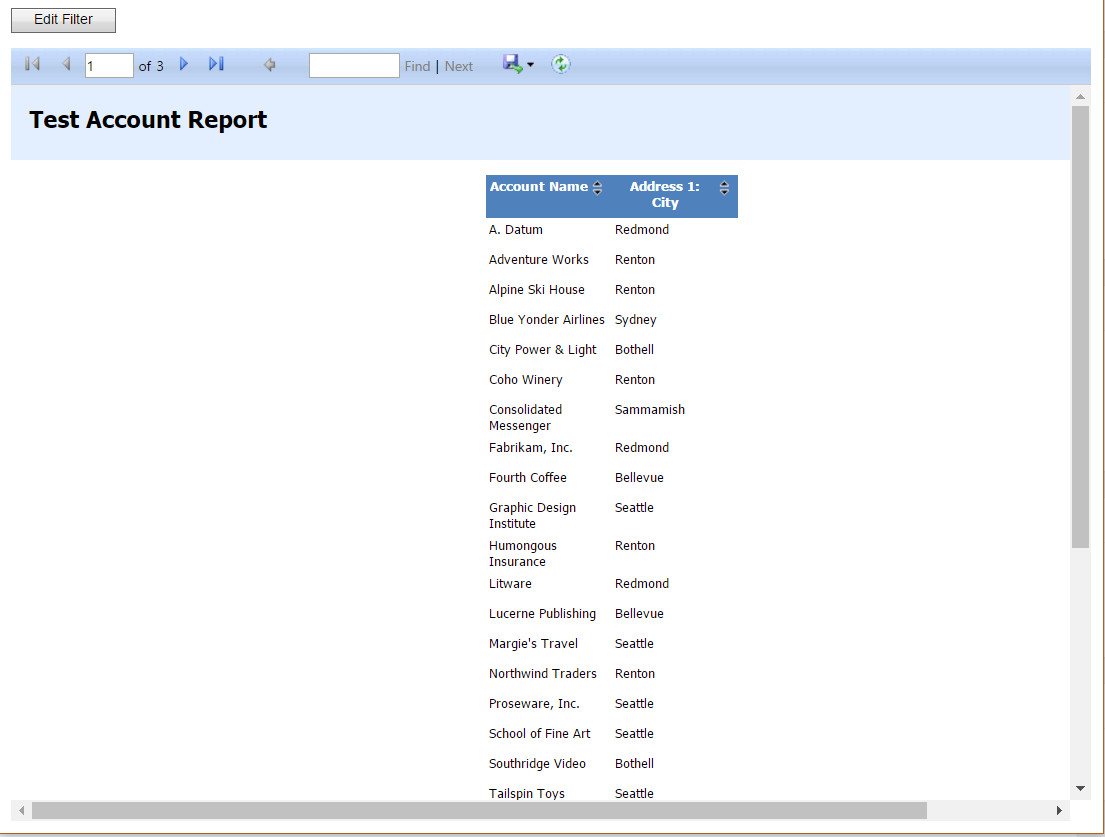
- The report is displayed on the screen:
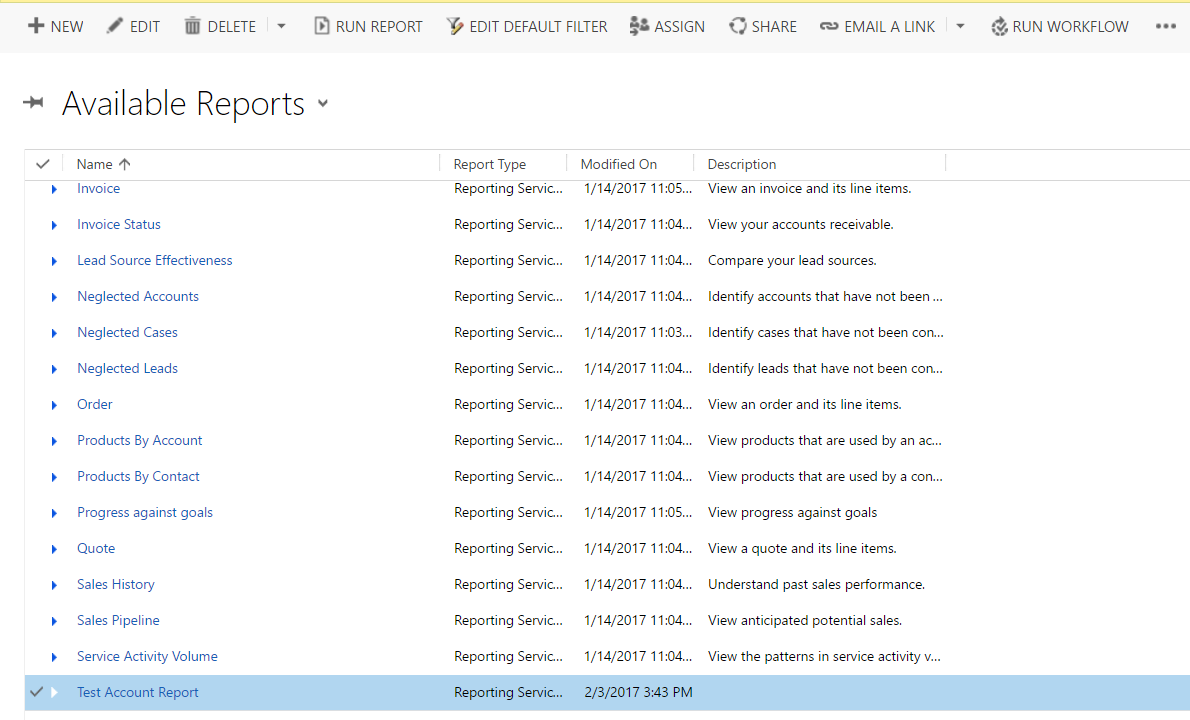
To edit the report, find the report in the Available Reports view and select Edit from the menu:
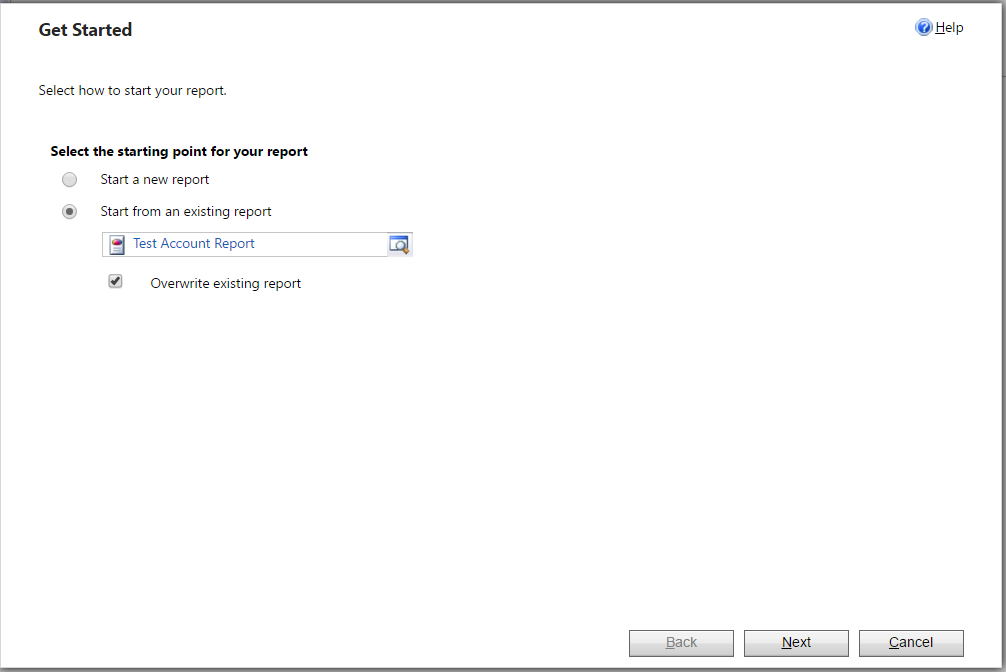
Note Start from an existing report is selected:
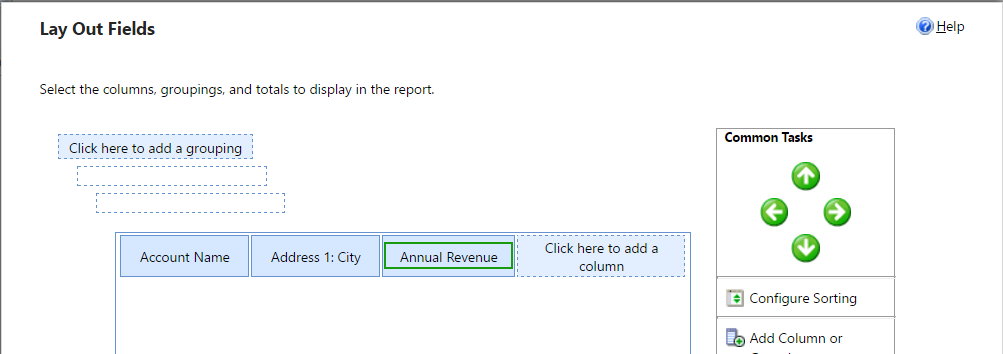
Click through an add Annual Revenue as a field:
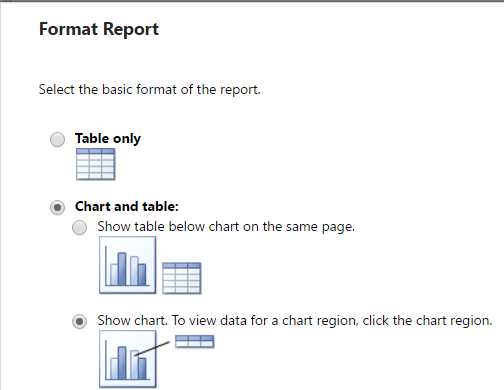
As we have a numeric field, we can now use Chart and table and select a chart:
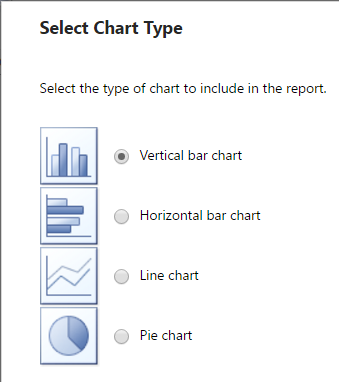
Select the chart type:
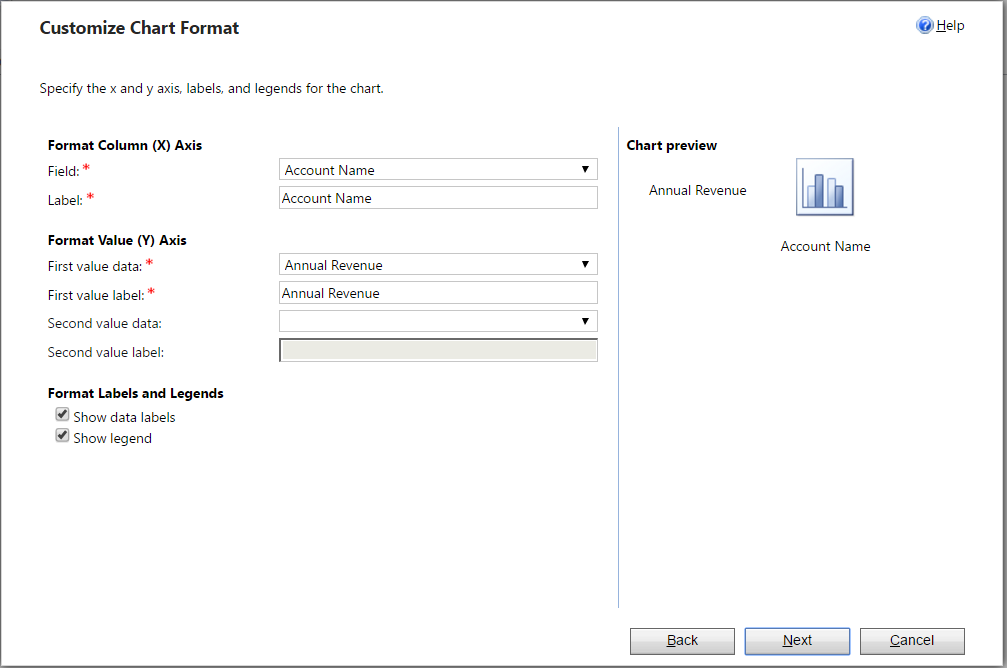
We can customize the format here. Click Next and Finish:
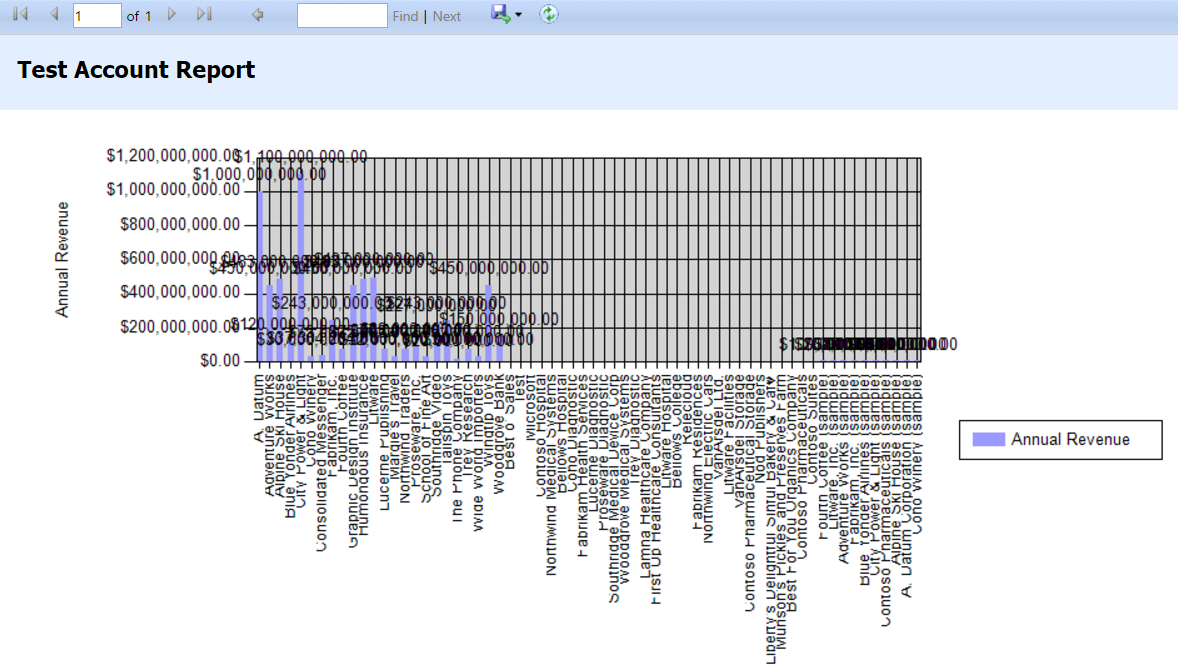
Run the report and you will see the report is now showing as a chart:
In another post I will talk about how to create a different kind of chart in CRM and have that viewable in dashboards.

Explore AI, agents & Microsoft technology.
I share practical ideas, tutorials, and videos about AI, AI agents, Microsoft technologies, and the Power Platform.
Subscribe on YouTube →
What technology is used here? Is it the SSRS or something else?