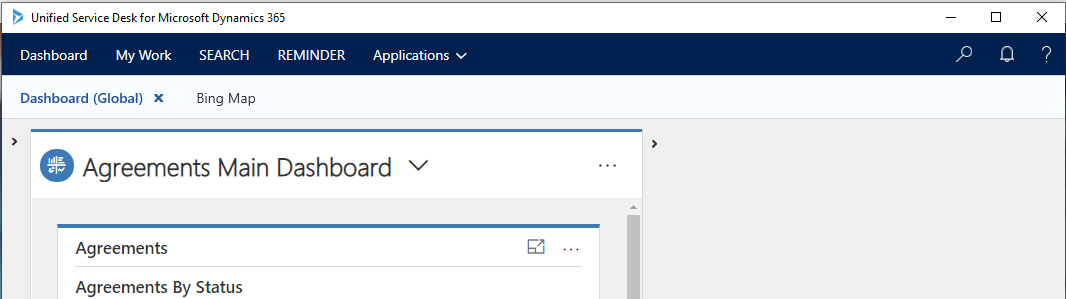
In this post we will look at how to create and add a USD Debugger to a USD installation. We will add it to the USD toolbar, on the top right:
The steps we will perform:
- Create a Debugger hosted control.
- Find where the toolbar will sit in the XAML panel layout.
- Create a toolbar container for this panel.
- Create a toolbar for this toolbar container.
- Add the toolbar button.
- Add actions behind the button to open the Debugger hosted control.
Create a Debugger Hosted Control
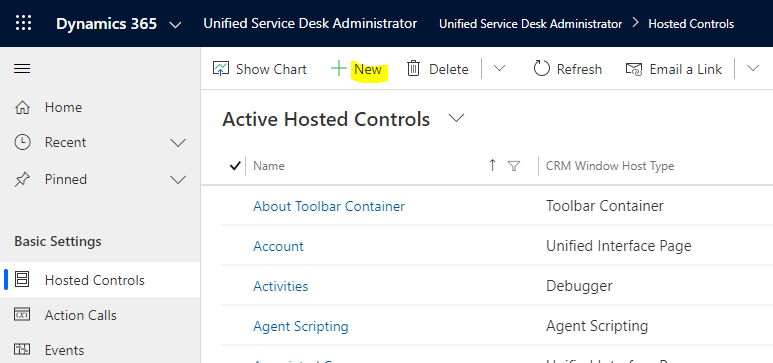
Create a hosted control for the Debugger:
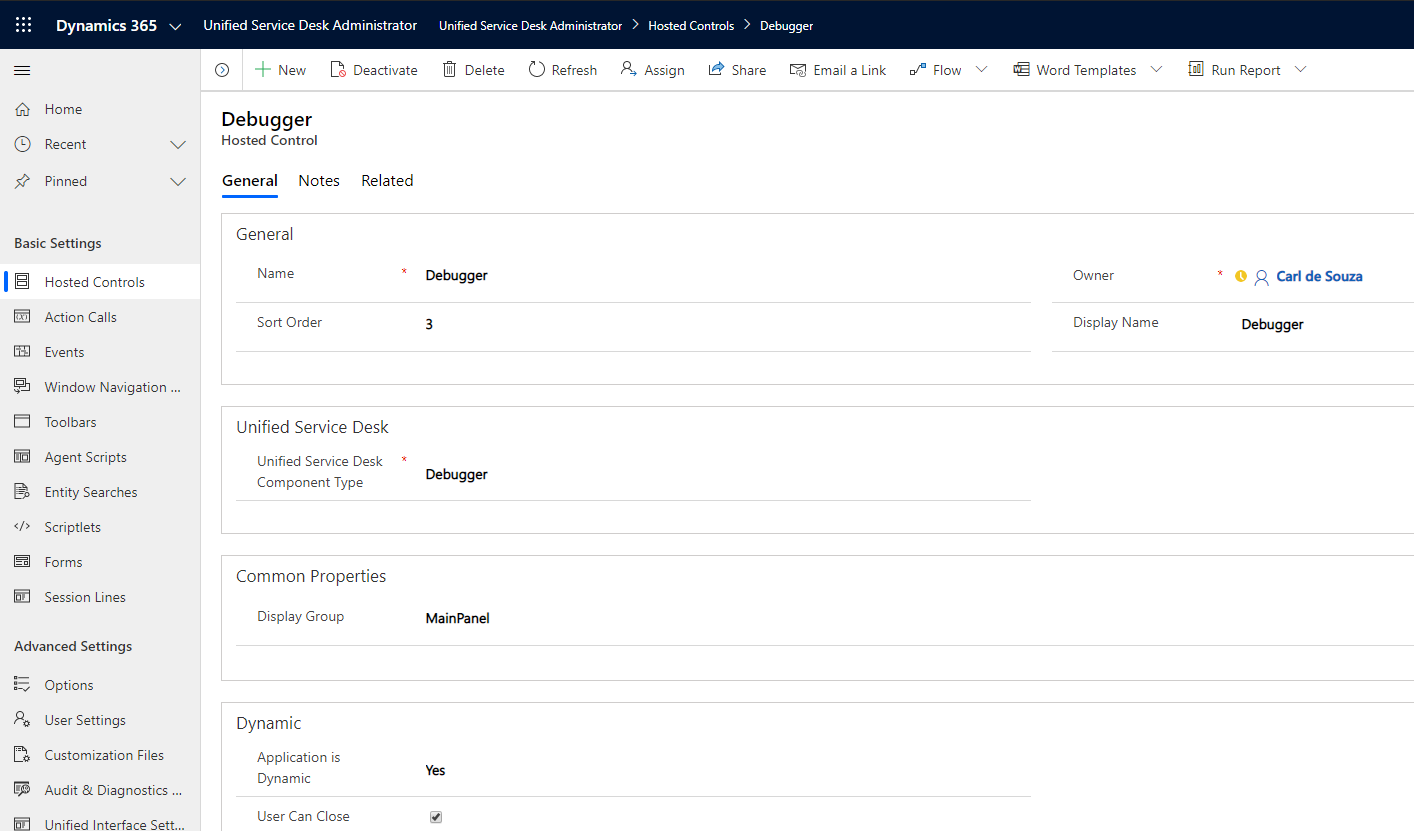
Set the USD Component Type to Debugger. The Display Group can be anywhere you want it displayed, such as MainPanel, FloatingPanel etc:
Find the XAML Panel
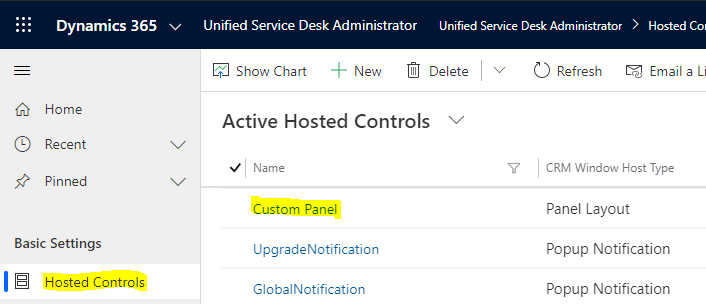
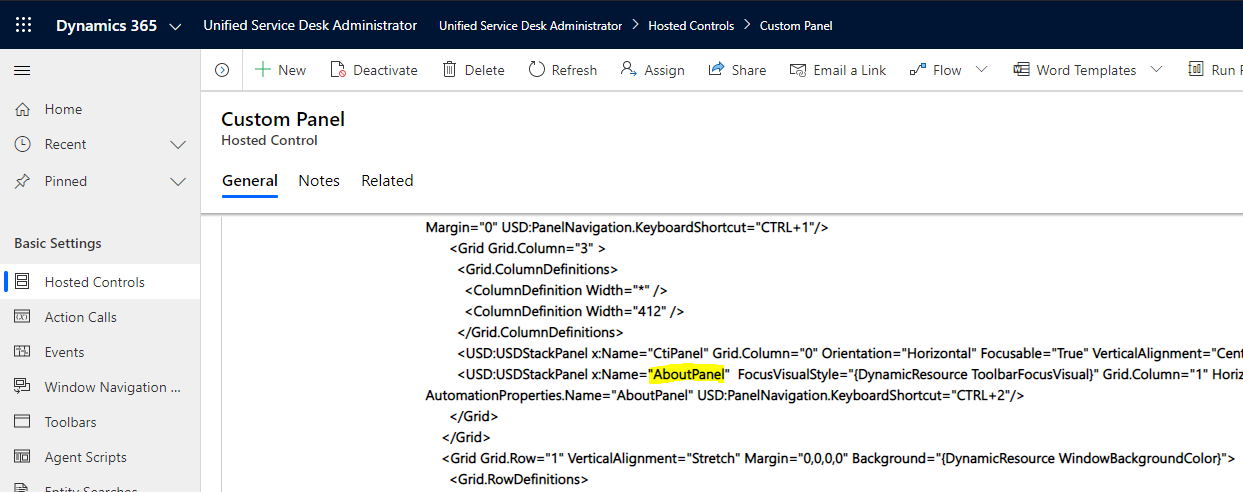
Let’s look at what the panel is in the top right. We are using a Custom Panel Layout:
We see the top right is the AboutPanel (which could be seen more easily through Visual Studio):
Create a Hosted Control for the Toolbar Container
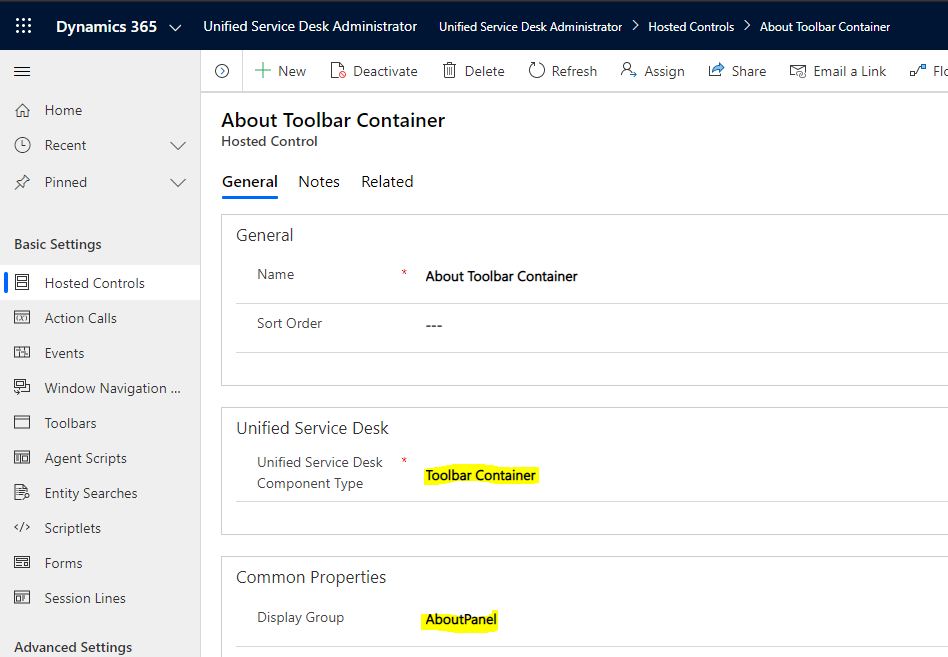
Now create a Hosted Control of type Toolbar Container for this panel:
Create a Toolbar
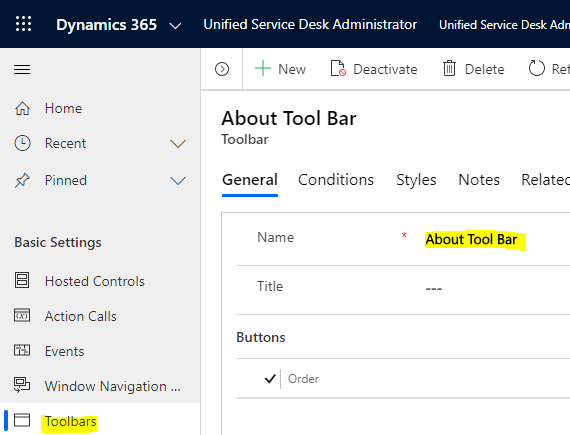
We can now create a toolbar to use in this container.
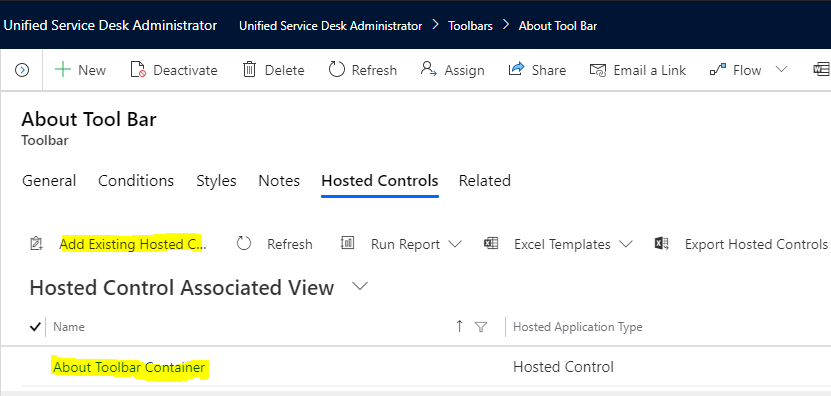
And add it to the Toolbar Container under Hosted Controls:
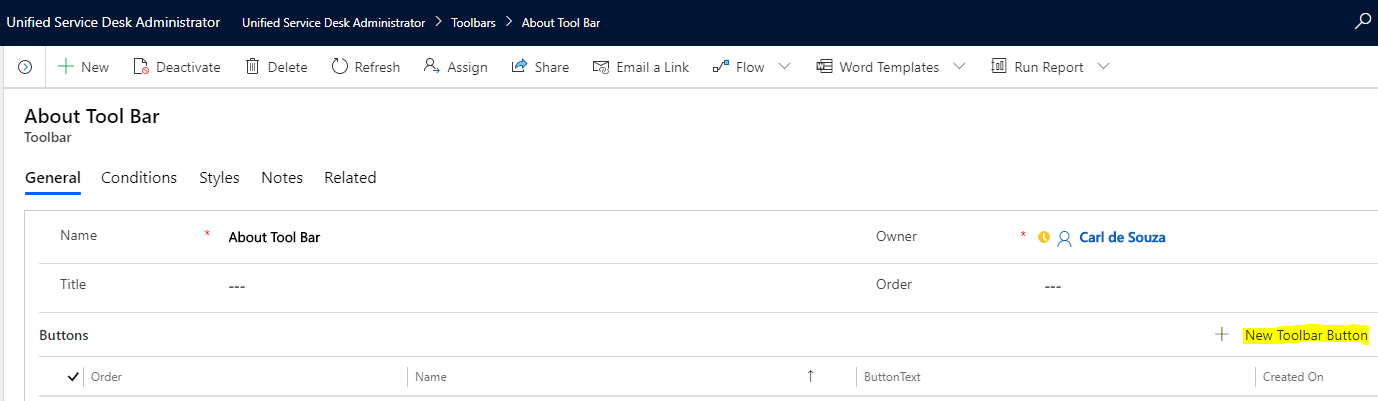
Add a Toolbar Button
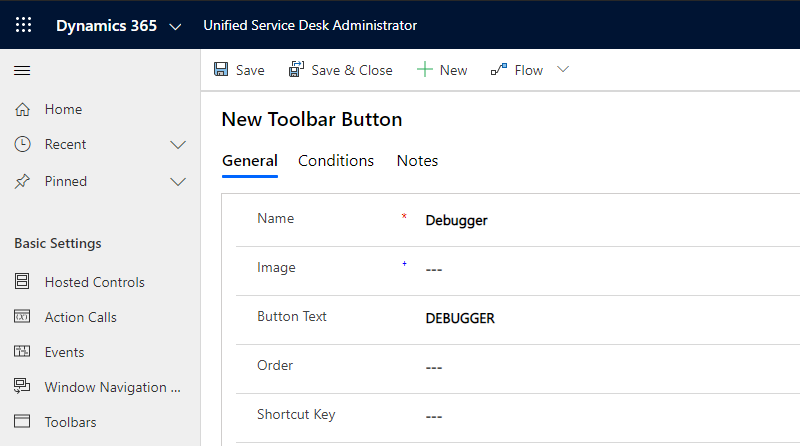
Next, add a Toolbar button:
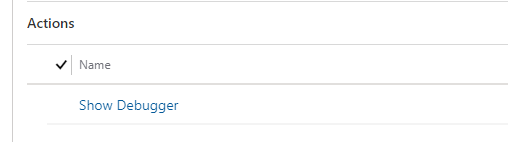
Add an Action Call to open the Debugger:
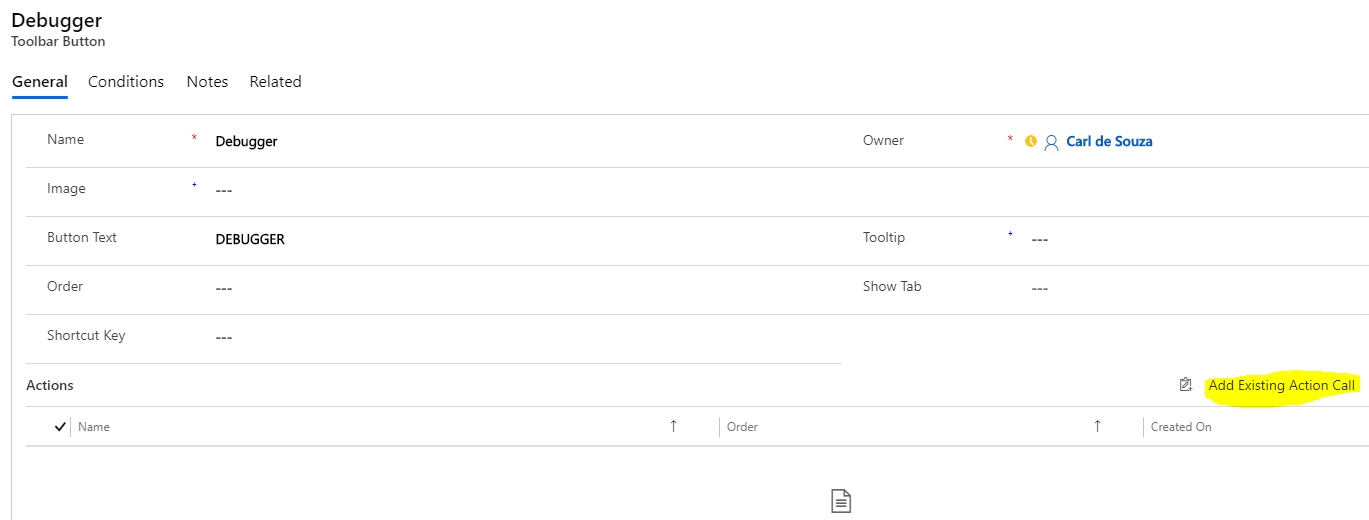
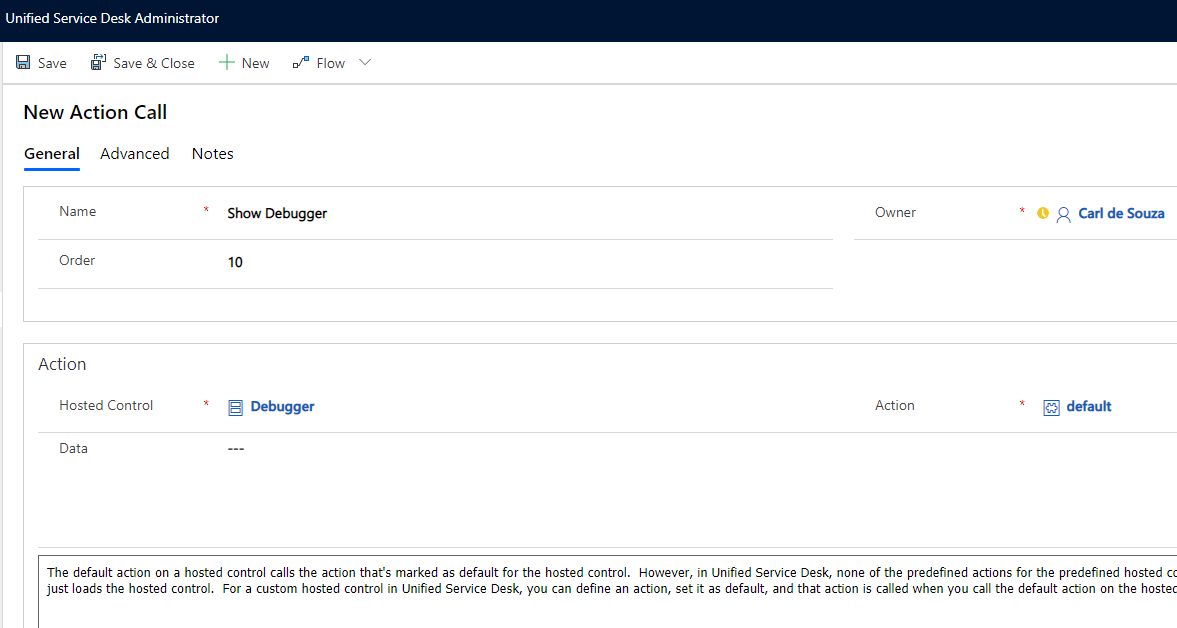
Ensure the new action is attached to the Debugger:
Open USD
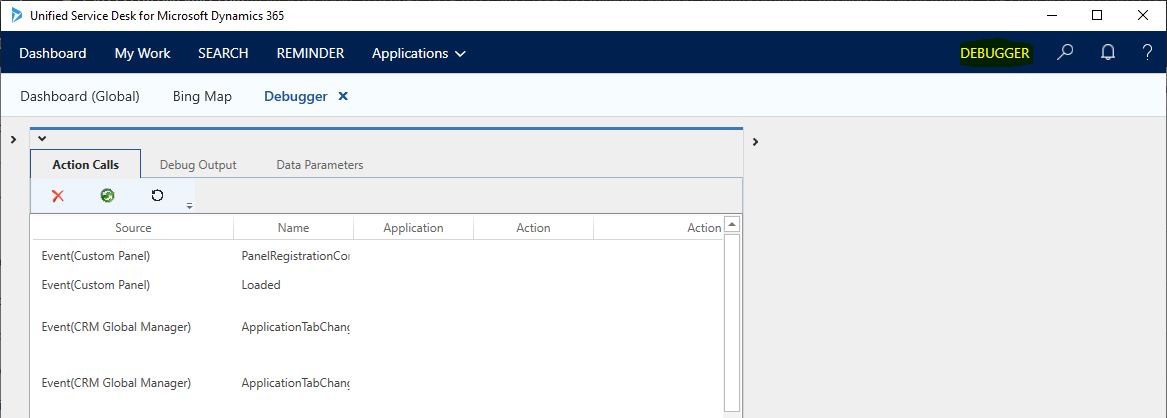
Now open USD. We see the new DEBUGGER toolbar button, and when clicking on it, we see the Debugger is opened in the main panel:

Explore AI, agents & Microsoft technology.
I share practical ideas, tutorials, and videos about AI, AI agents, Microsoft technologies, and the Power Platform.
Subscribe on YouTube →