Here we will look at building charts in Dynamics CRM. Let’s go through an example.
Select Accounts->Sales and then select Charts:
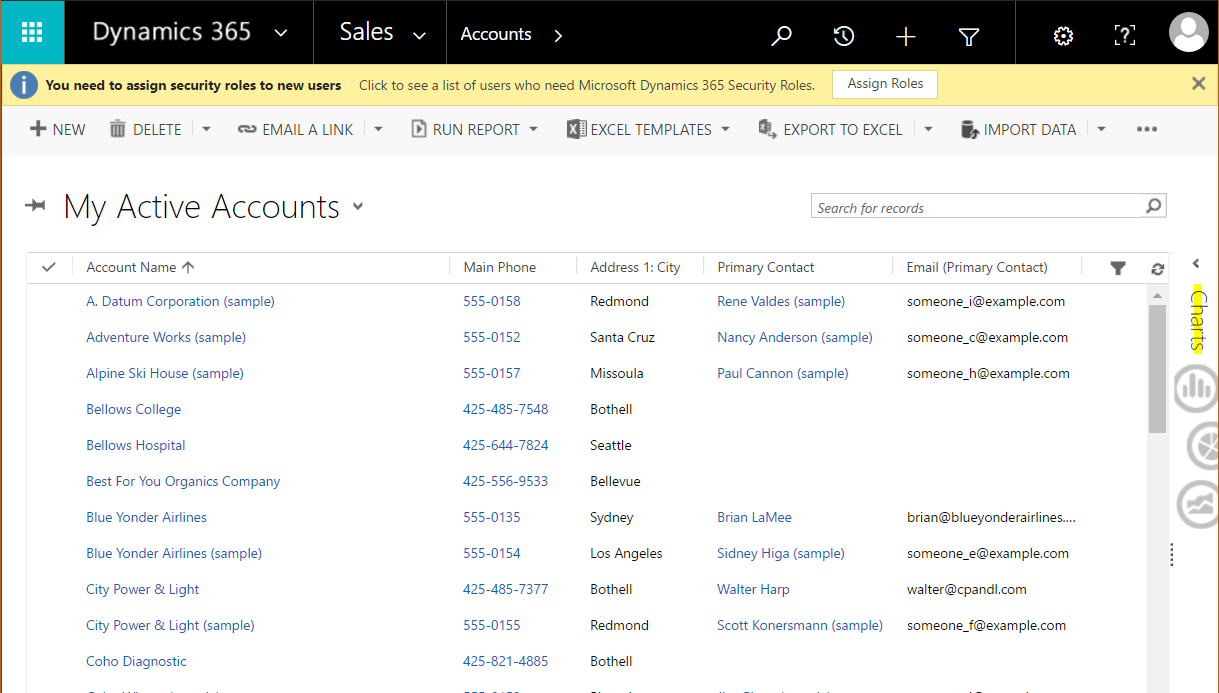
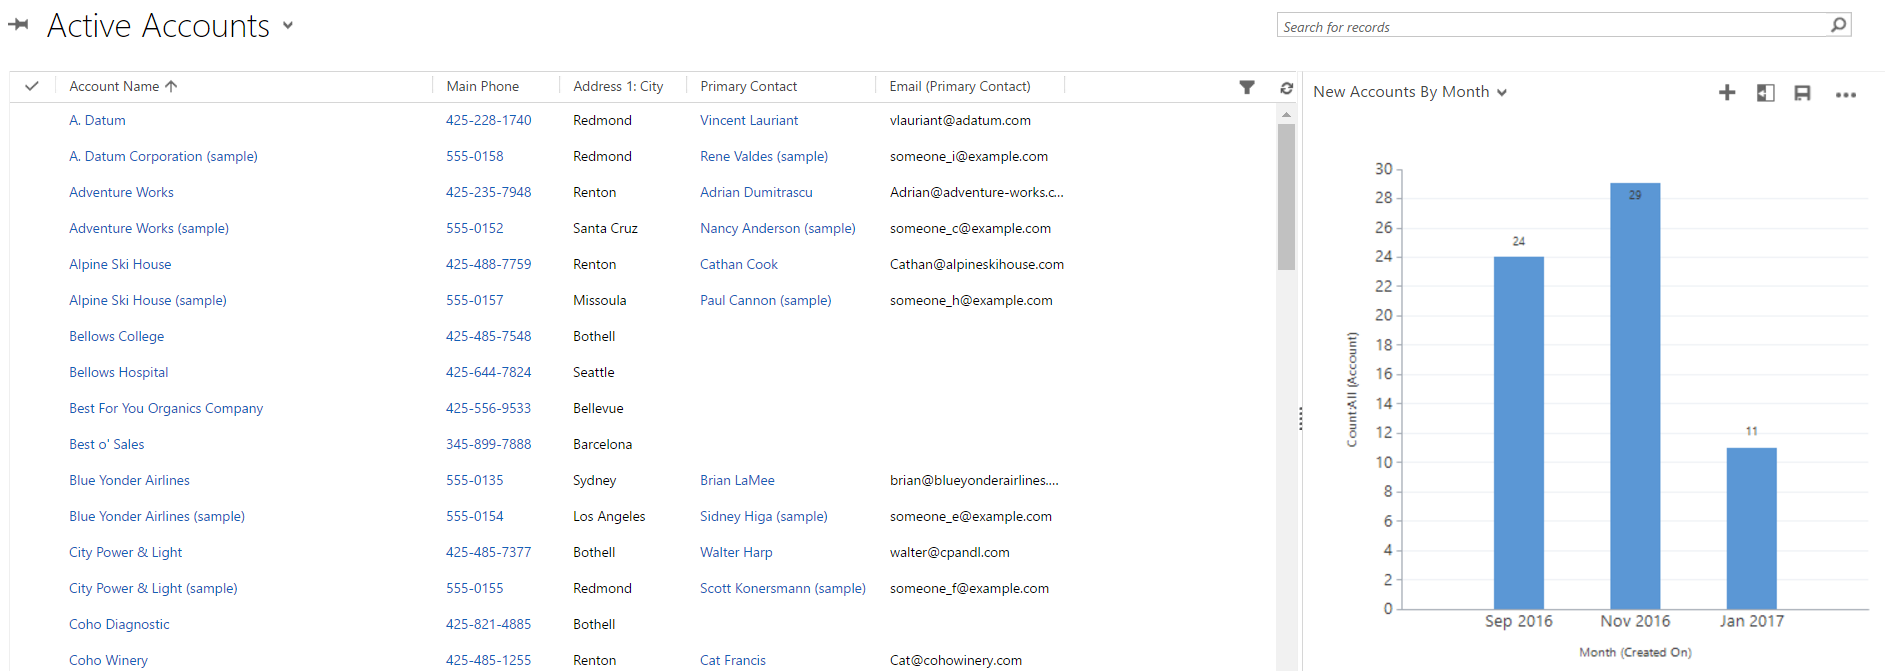
This will open the charts for Accounts:
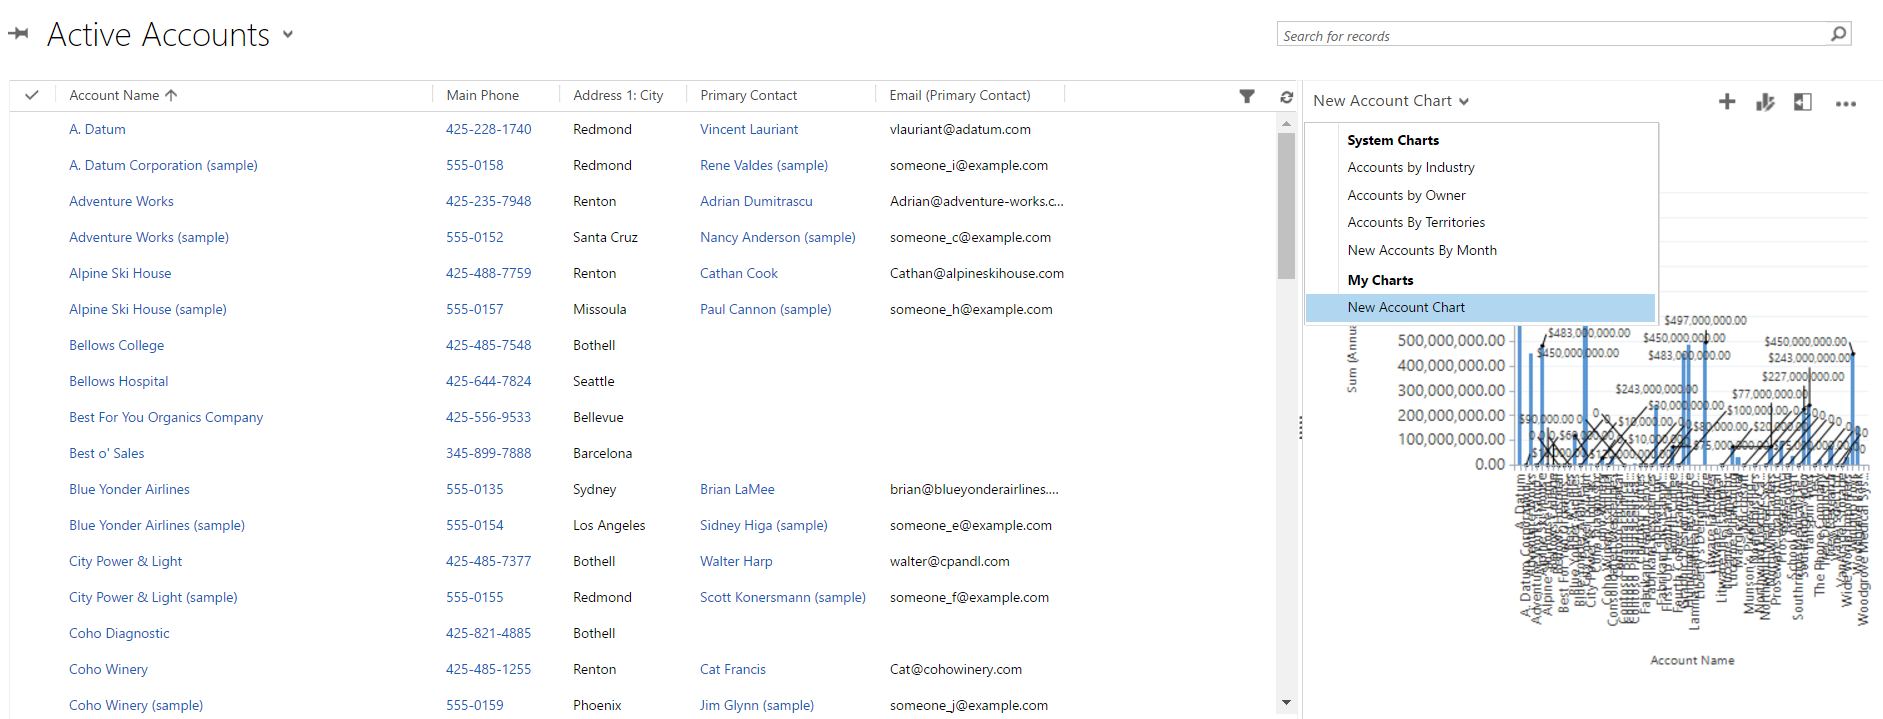
Using the drop down, we can see the system charts for Accounts:
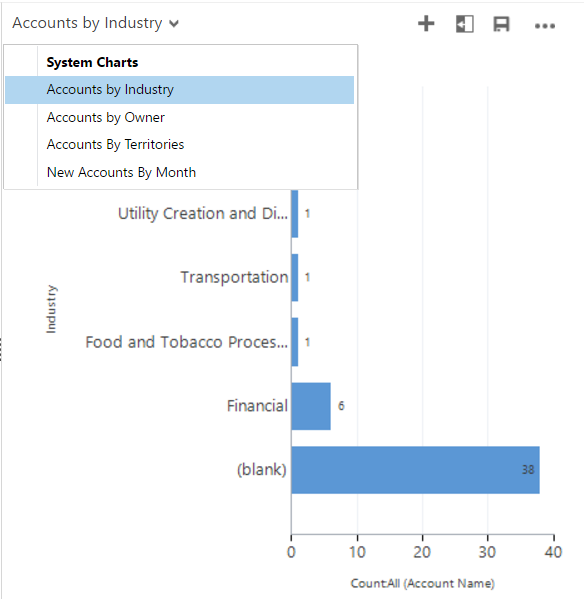
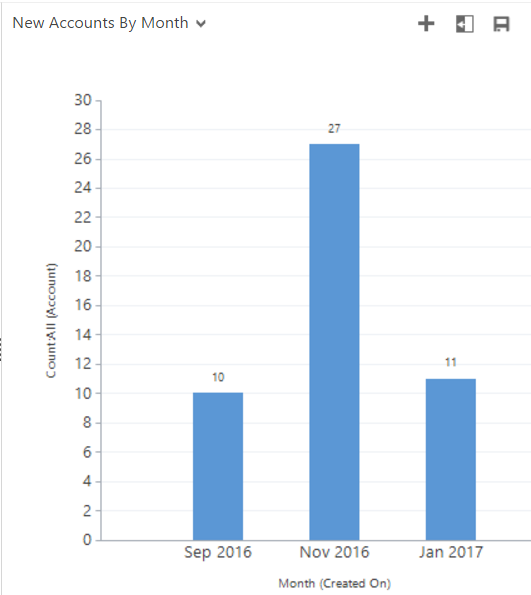
And we can change the chart:
 \
\
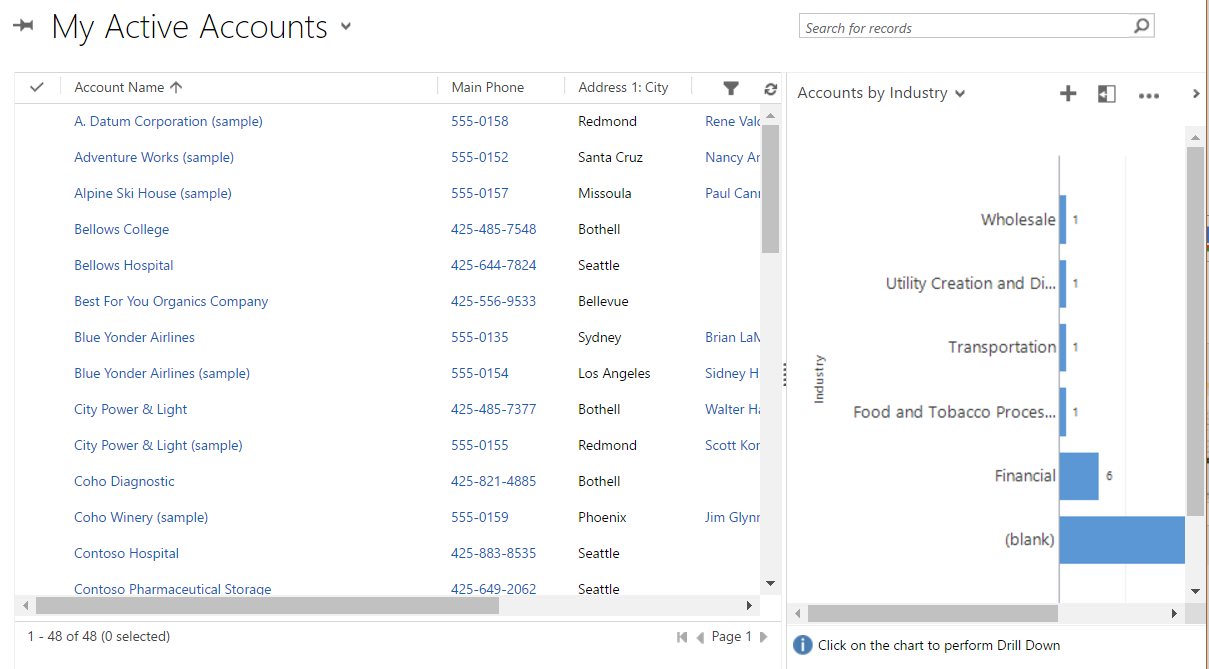
If we change the view in CRM to all Active Accounts, we can see the chart is redrawn and the numbers of the charts change accordingly:
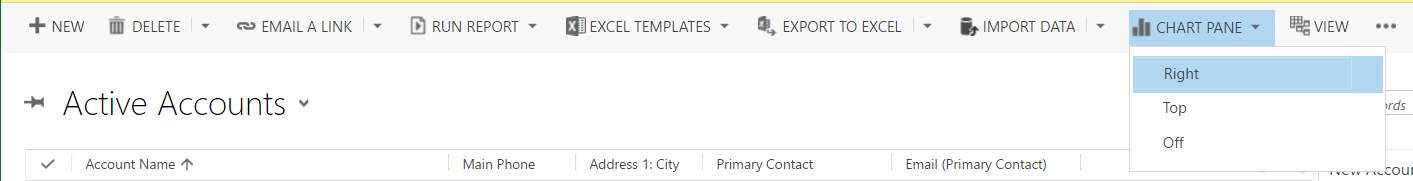
From the chart menu, note there is the ability to change where the chart is displayed:
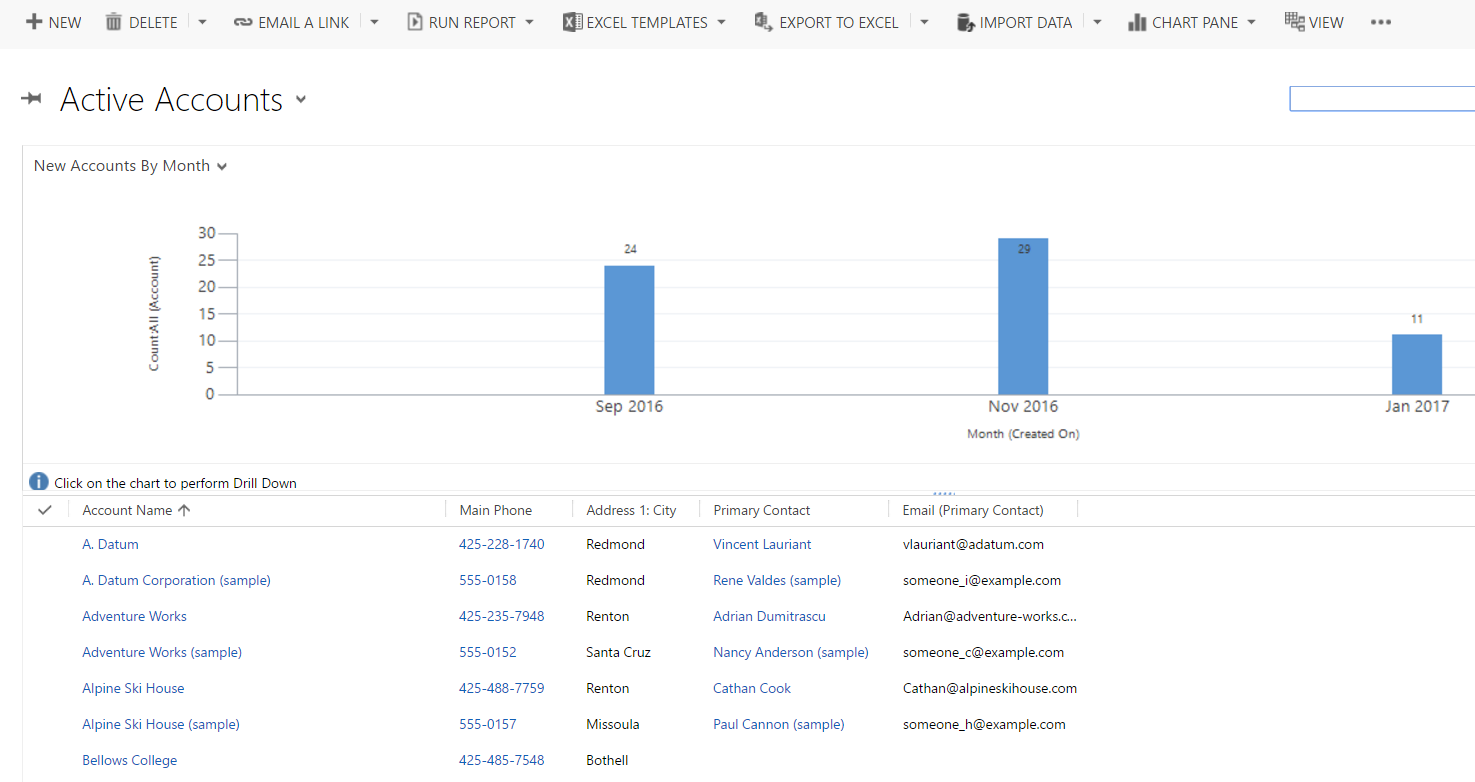
For example, viewing on Top:
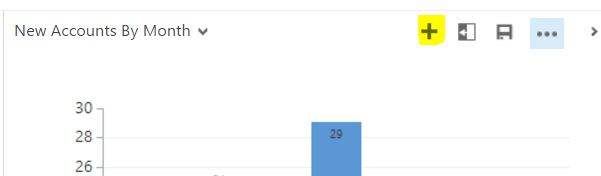
To create a new chart, click + on the Chart:
Give the chart a name:
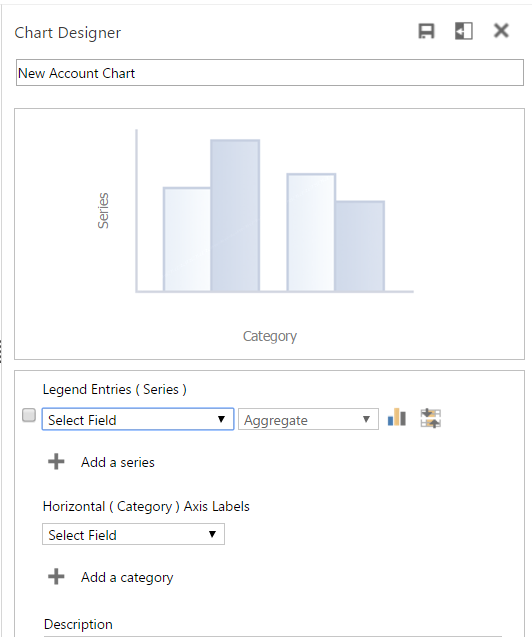
Select a field as the Legend (Series).
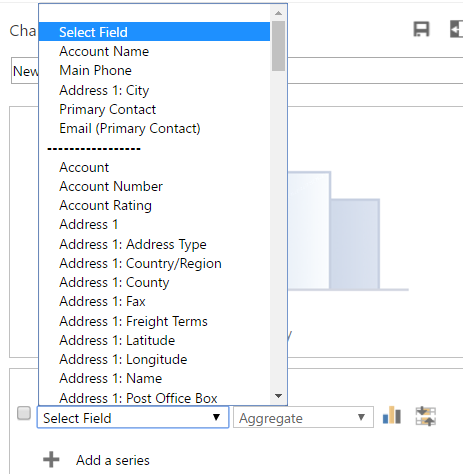
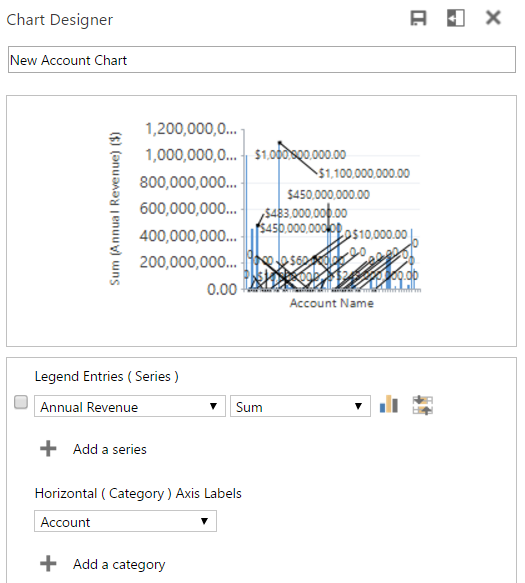
We will use Annual Revenue. We have the option to choose which type of aggregation we would like, in this case Sum. The Horizontal (Category) axis will show by Accounts. Once these are selected, the chart is drawn:
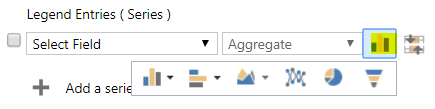
You can also choose the type of chart. These include:
- Column
- Bar
- Area
- Line
- Pie
- Funnel
- Multi-series
- Comparison (Stacked chart and 100% stacked chart)
Save the chart. You will now see this chart under My Charts in the drop down list:
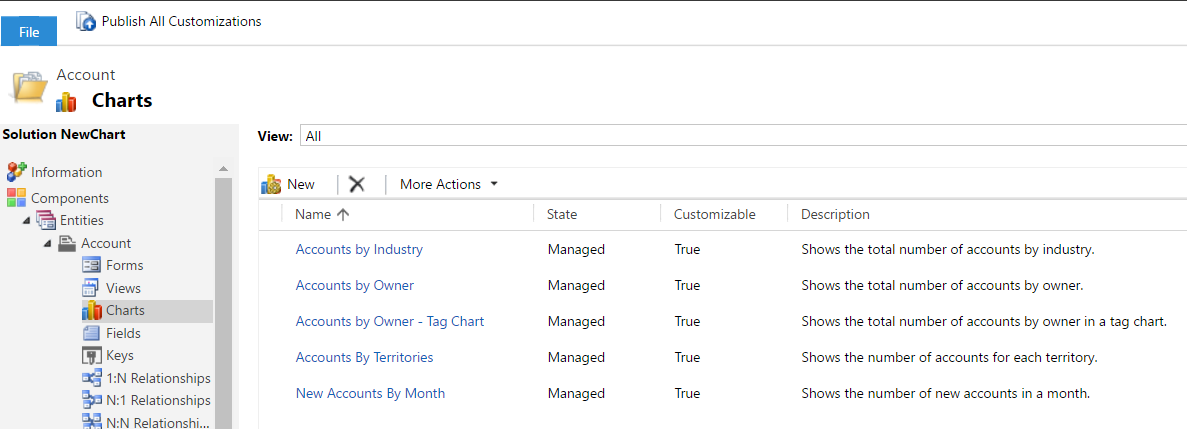
Now let’s create a System chart. Create a new solution and add the Account entity. Go to Charts:
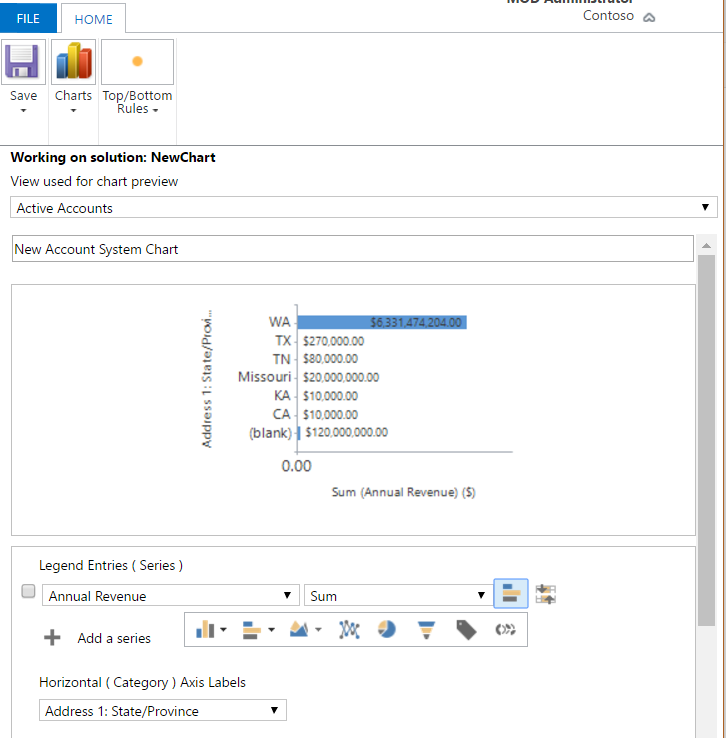
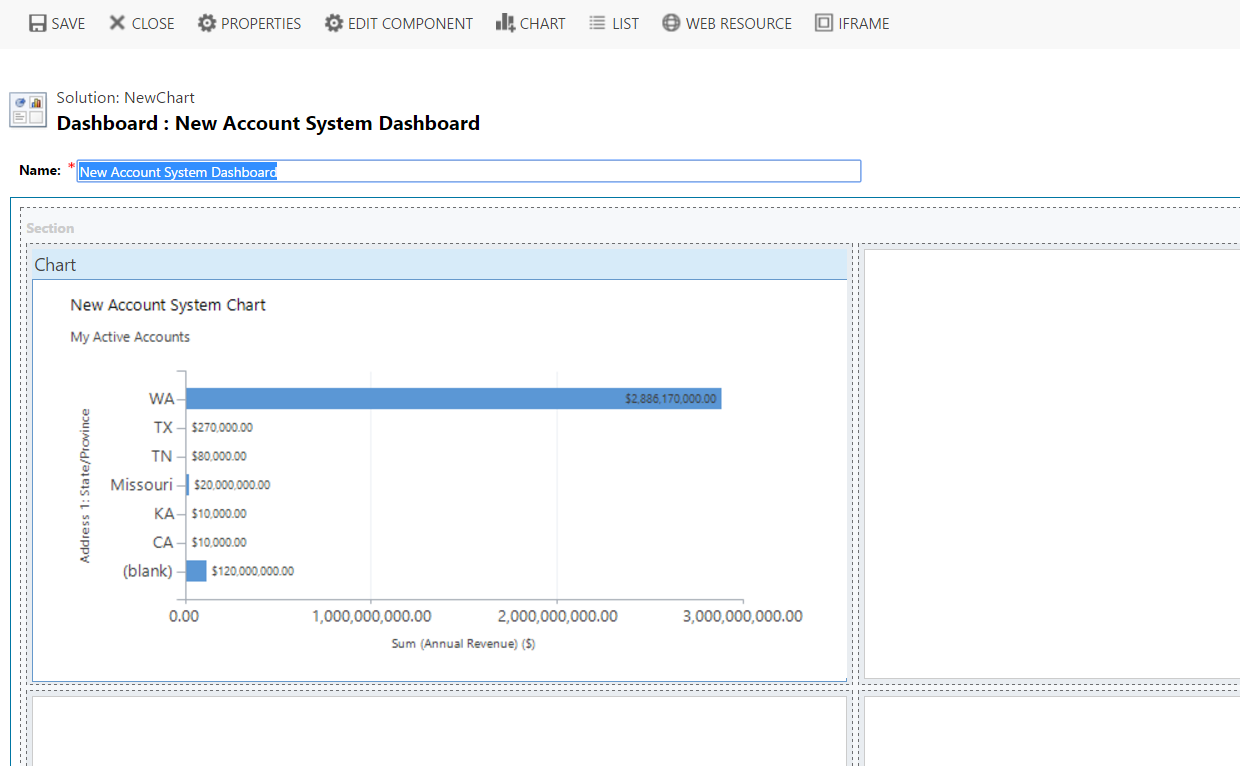
Add a new chart. We will call the chart New Account System Chart. The chart will show account revenue by state. We will display this as a bar chart:
Save the chart and publish the solution.
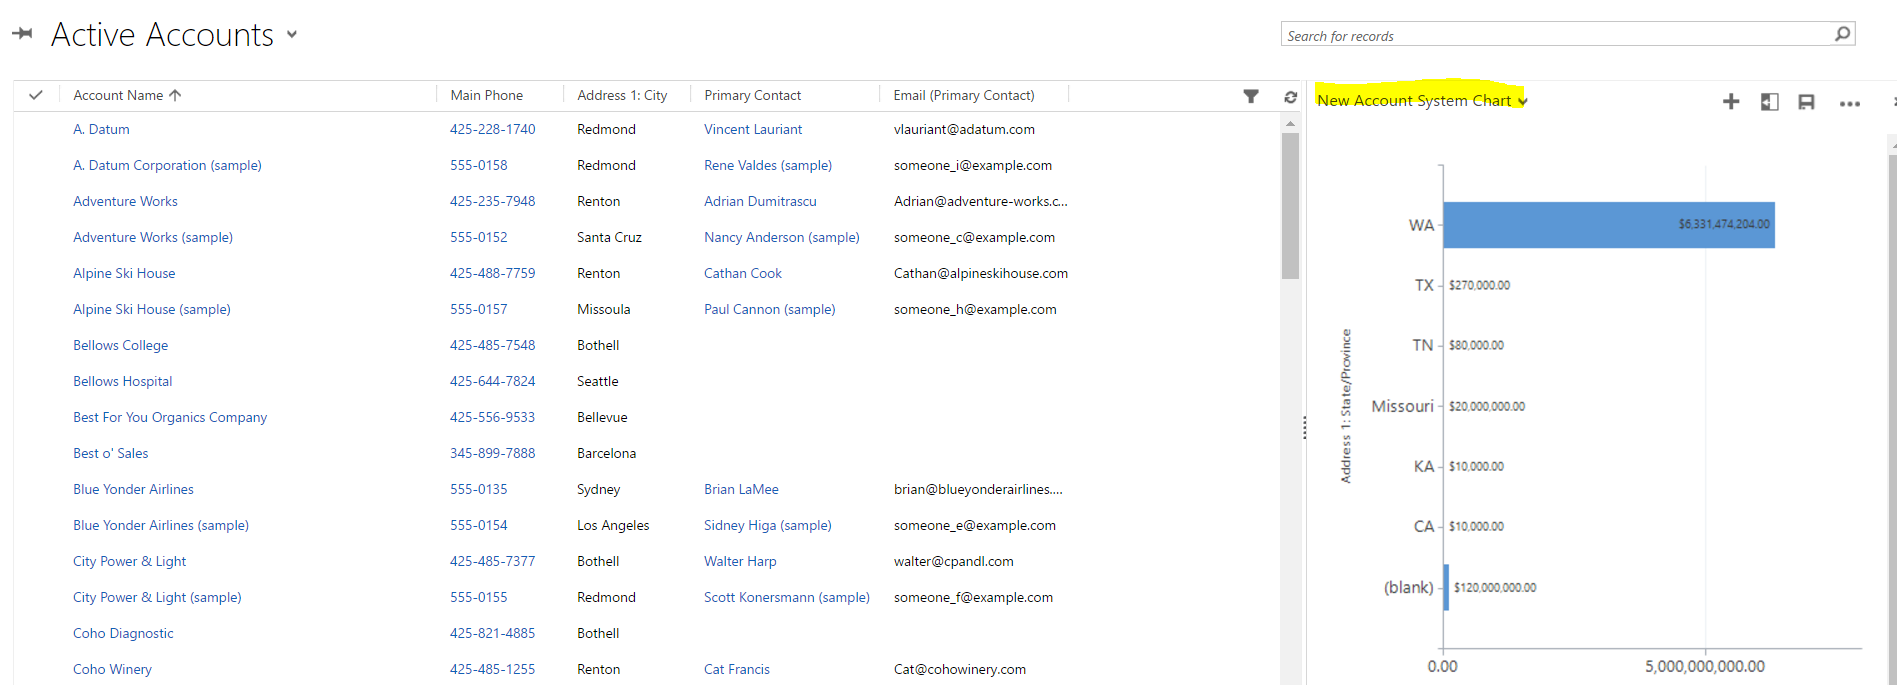
Select the new System chart from the drop down list. This is now available system wide.
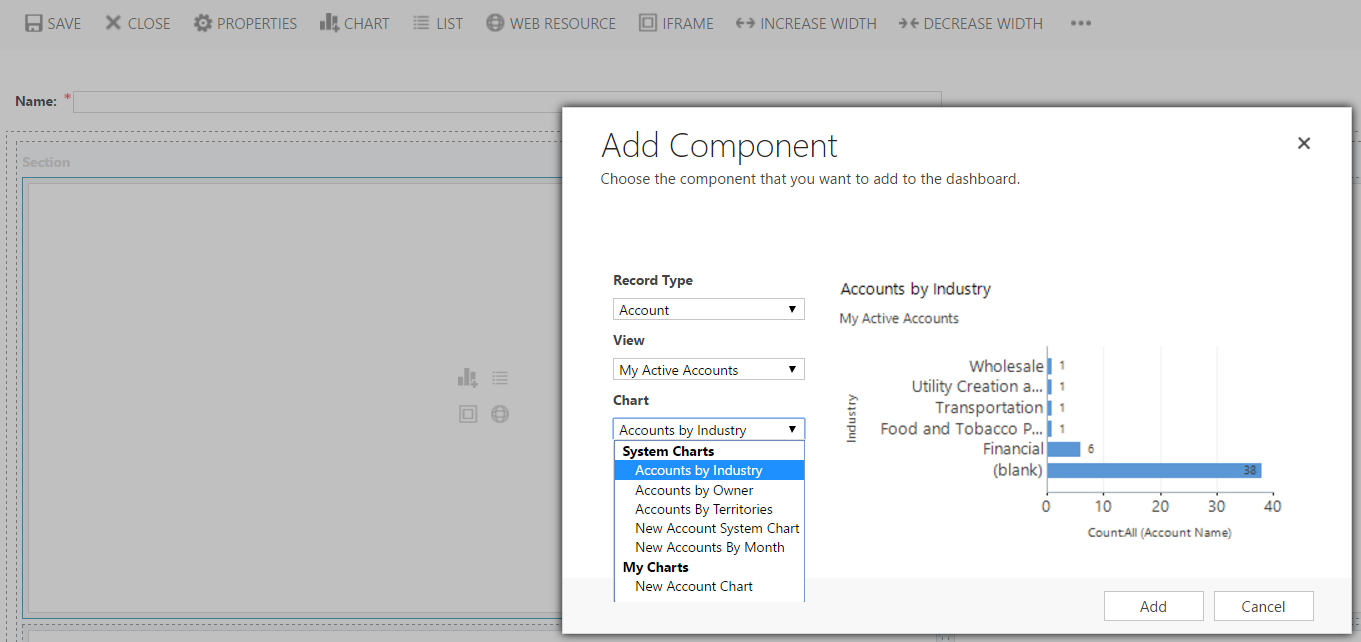
We can also add these charts to dashboards. In the dashboard designer, select Charts with Accounts as the record type. You can see our 2 new charts appear:
You can then share these dashboards with users and teams.
Let’s now create a system dashboard as part of our solution, and deploy it. There is only the option to select the System chart, not the personal chart.
I AM SPENDING MORE TIME THESE DAYS CREATING YOUTUBE VIDEOS TO HELP PEOPLE LEARN THE MICROSOFT POWER PLATFORM.
IF YOU WOULD LIKE TO SEE HOW I BUILD APPS, OR FIND SOMETHING USEFUL READING MY BLOG, I WOULD REALLY APPRECIATE YOU SUBSCRIBING TO MY YOUTUBE CHANNEL.
THANK YOU, AND LET'S KEEP LEARNING TOGETHER.
CARL


