
I often get asked the question what’s so good about Power BI. I think the question is more like why do I love Power BI! Many of my clients do not fully understand just what Power BI is and why it is a game changer in business intelligence. Here goes.
Power BI is Microsoft’s new cloud-based Business Intelligence service. It allows anyone to visualize and analyze data for free. Users can connect to data, create reports, and build dashboard on those reports.
Different business intelligence tools over the years have addressed different analysis requirements, but here are the main reasons that TOGETHER make Power BI an extremely compelling solution.
1. It’s free
Power BI is free for users who stay within certain limits. For many users, these limits are very achievable. Free users are able to built reports, build dashboards, connect to data, manipulate data, schedule data refreshes, share dashboards, view dashboards from other users, view data on mobile devices, etc. In fact all of the 9 reasons to follow are supported with the free Power BI user!
Free users need to stay under a 1GB data limit. They also cannot create content packs, a way to package and distribute reports and dashboards – but you can connect to the many public ones. Automatic data refresh is limited to (only) once a day, instead of the paid version of once an hour.
You can read more about the Power BI pricing here, but if you’re a free user, you are only restricted by these certain conditions. You still have extremely powerful capabilities.
2. Drag and drop to create amazing looking visualizations
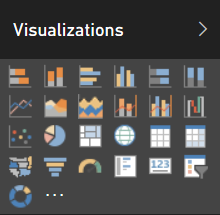
It is extremely easily to create good looking reports in Power BI. You connect to data sources, then drag and drop fields from those sources onto your report. There are many options for the types of charts Power BI supports. These include stacked bar and column charts, regular bar/column, line charts, area charts, pie charts, maps, gauge, donuts, numbers, slicers, scatter charts. Not only that, developers can build their own chart types. The community has chart types you can download and use.
Users can also take existing reports and modify them, so if you don’t like a pie chart you can change it to a donut chart, for example.
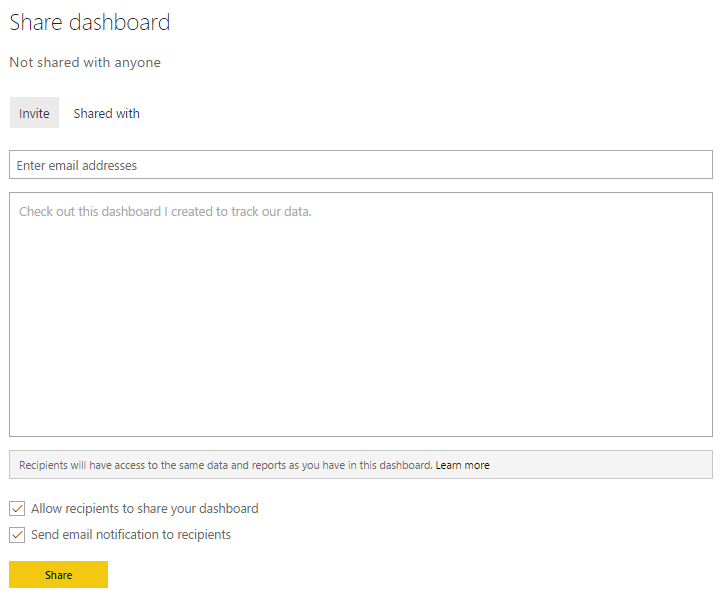
3. Sharing is easy
Once a user builds a report, they can email it to anyone in their organization. That way, everyone will have an up to date view of the report and it’s data. So, you can create an amazing report showing increase in revenue for your boss and send him a link to it. Every day he will be able to log in and see how revenue is increasing. You can then build on the report, create new reports to share. No more needing to sending reports and numbers in emails.
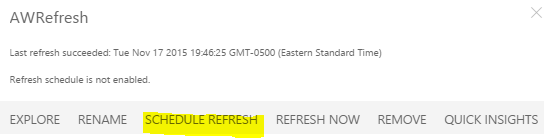
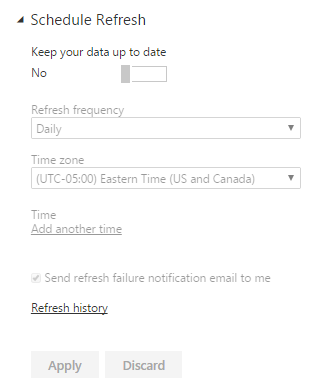
4. Data Refresh
Power BI connects to different data sources as mentioned above. What’s cool is it also allows for a schedule of the data refresh. So, you can set up a connection to your financial data, then every day or hour it will refresh the data for you. Your numbers are nearly live whenever you need to slice and dice the data. Having to schedule and not worry about manually refreshing the data is a huge productivity gain.
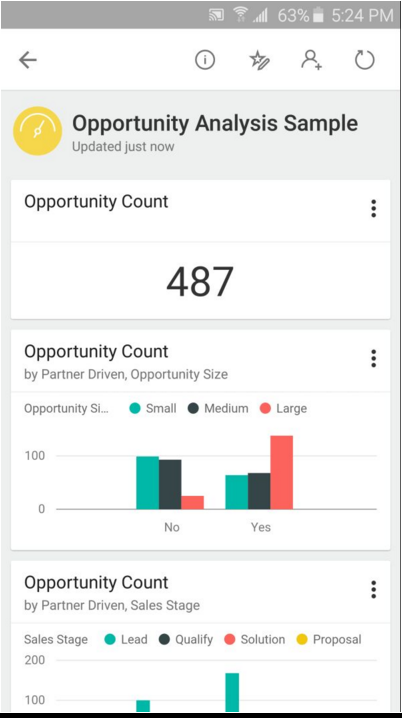
5. Mobile Apps
Microsoft has published Power BI apps for Apple, Android and Windows mobile devices. That means, you can see your dashboards anywhere you have your mobile device! To download the apps, click here.
6. Natural Language Queries
Power BI comes with a very cool feature – the ability to ask questions of the data in a natural way. So, you can go to your dashboard and type in “What is the total revenue for this year”. Power BI will reply with an answer.

Not only that, you can go further and tell Power BI to present the answer as whatever visualization you prefer. E.g. this year’s sales vs last year’s sales as bar chart:
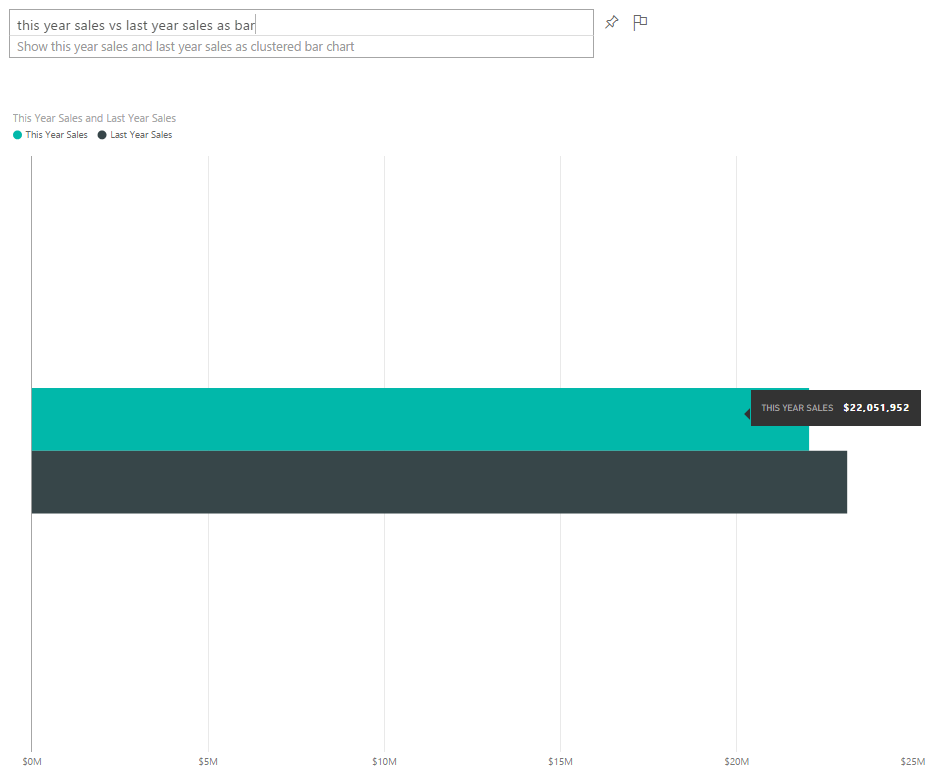
But that’s not all! Once you have your answer, you can pin the result to a dashboard, so each time you log in you can see your question and it’s answer.
There is also a very exciting Cortana tie-in.
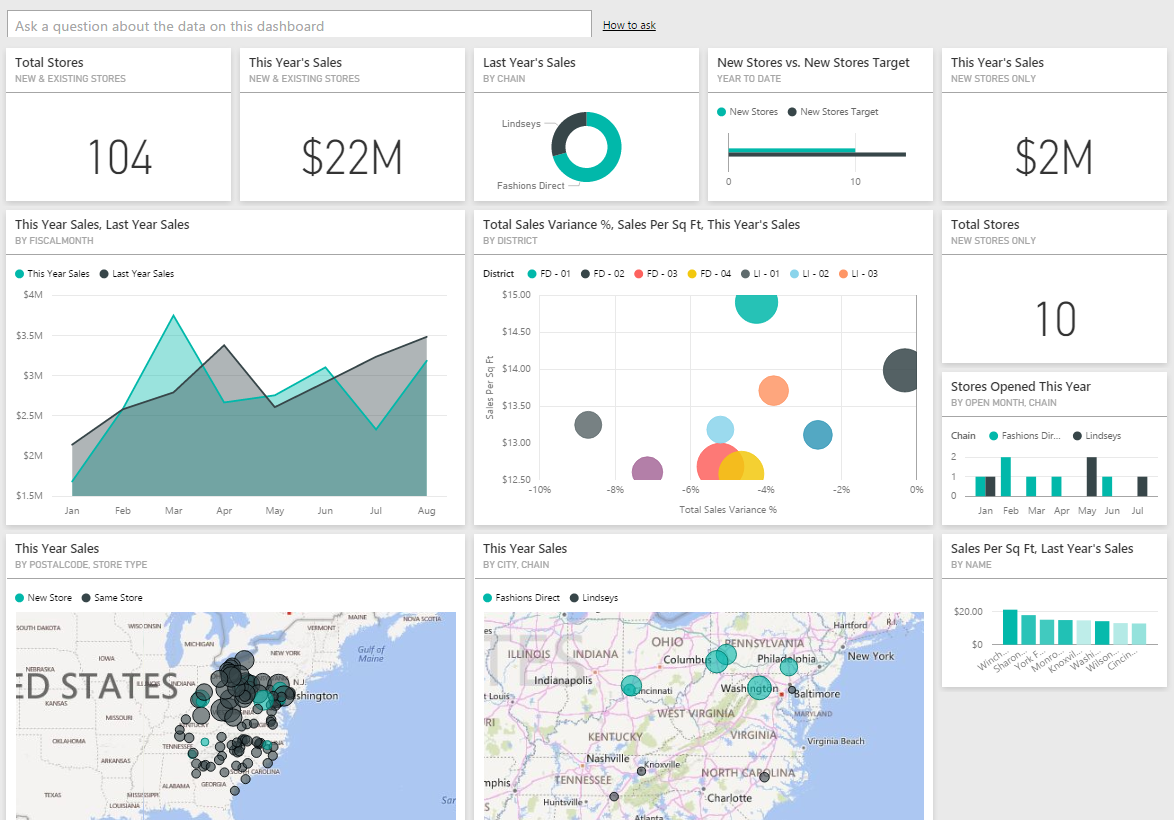
7. Interactive dashboards and drill-down
Dashboards are basically multiple reports that have been pinned in one view. So, users can log into Power BI and see everything they need to in one place. The data can come from different sources. So, you could have a dashboard that shows customer data from Dynamics CRM, Marketo and Oracle, for example.
Dashboard data can then be drilled into the underlying reports, and you can export the data that makes up the charts. Find out where the numbers come from to get deeper insights into the data.
Also, once the data is related together (by the way Power BI can automatically detect certain relationships in the data), a user can click on data in one chart and the dashboard will AUTOMATICALLY redraw so the data now reflects a filtered view of what was selected.
For example, here I am showing all New Stores:
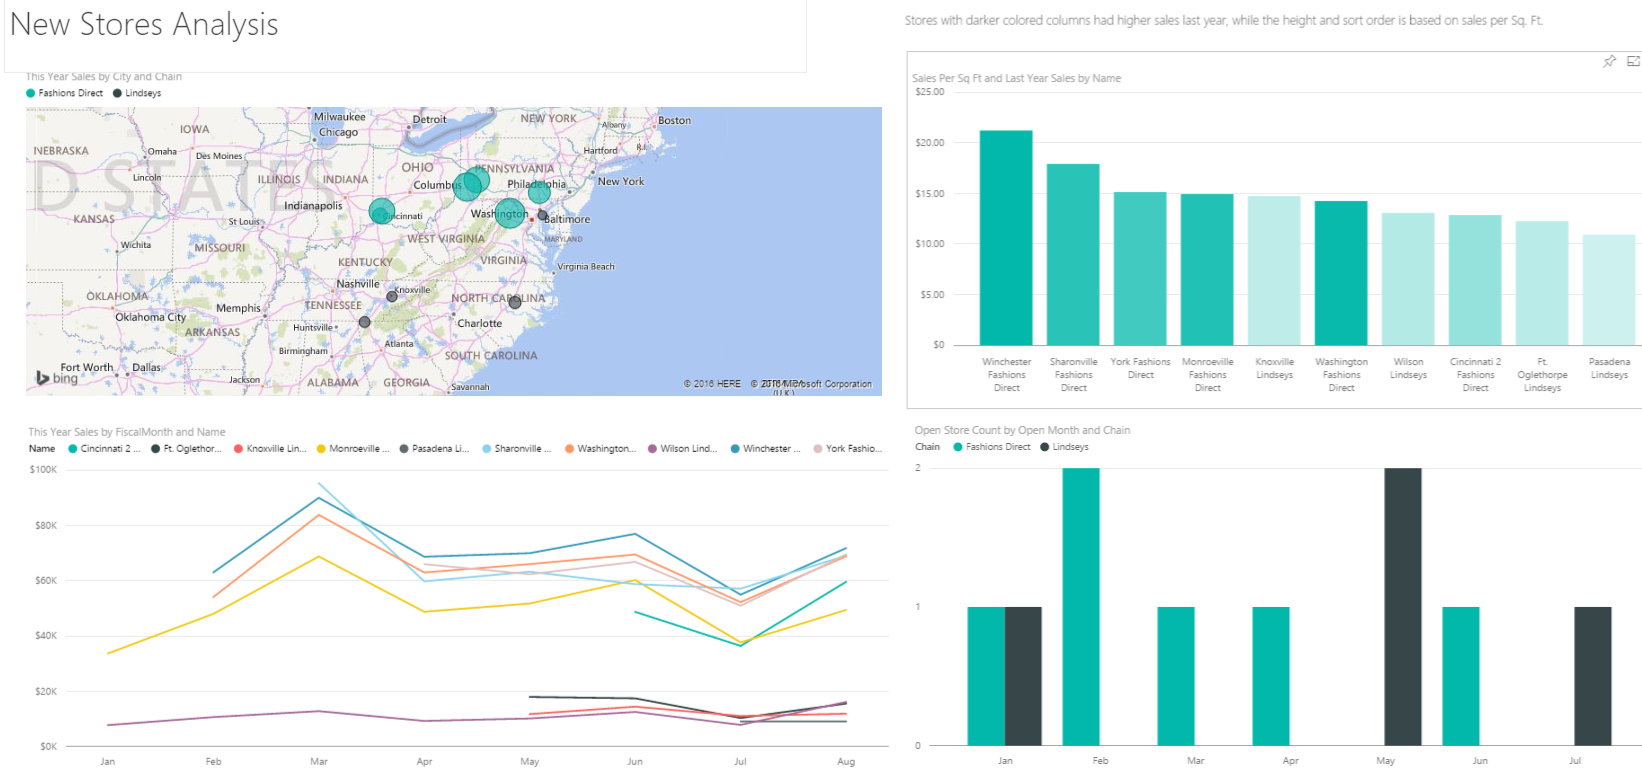
If I click on Winchester Fashions Direct, watch how the other data is grayed out, and the map and line chart are redrawn to show this applied filter.
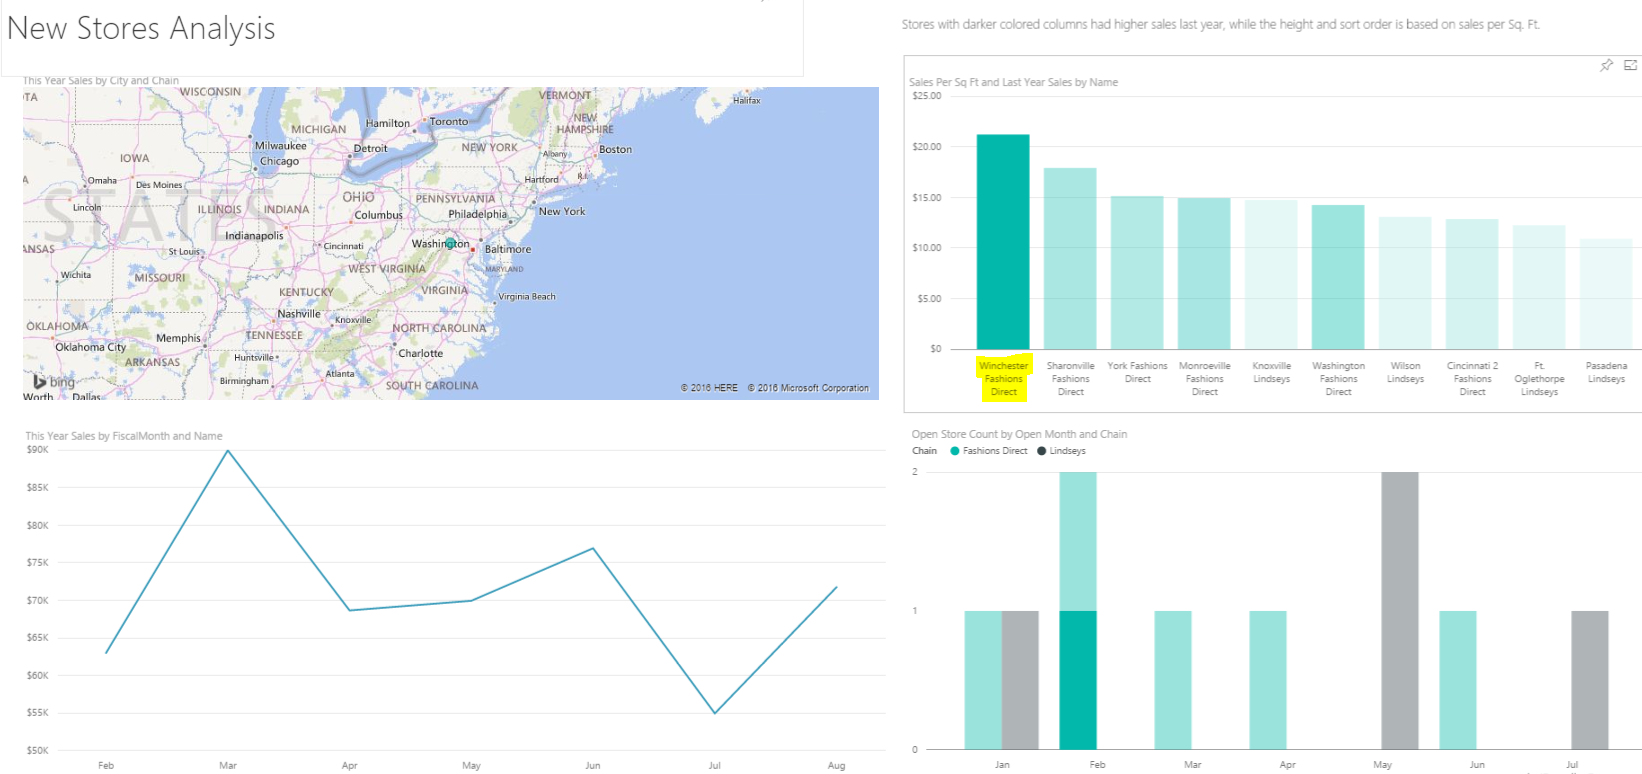
Imagine how this type of interaction can assist with your data.
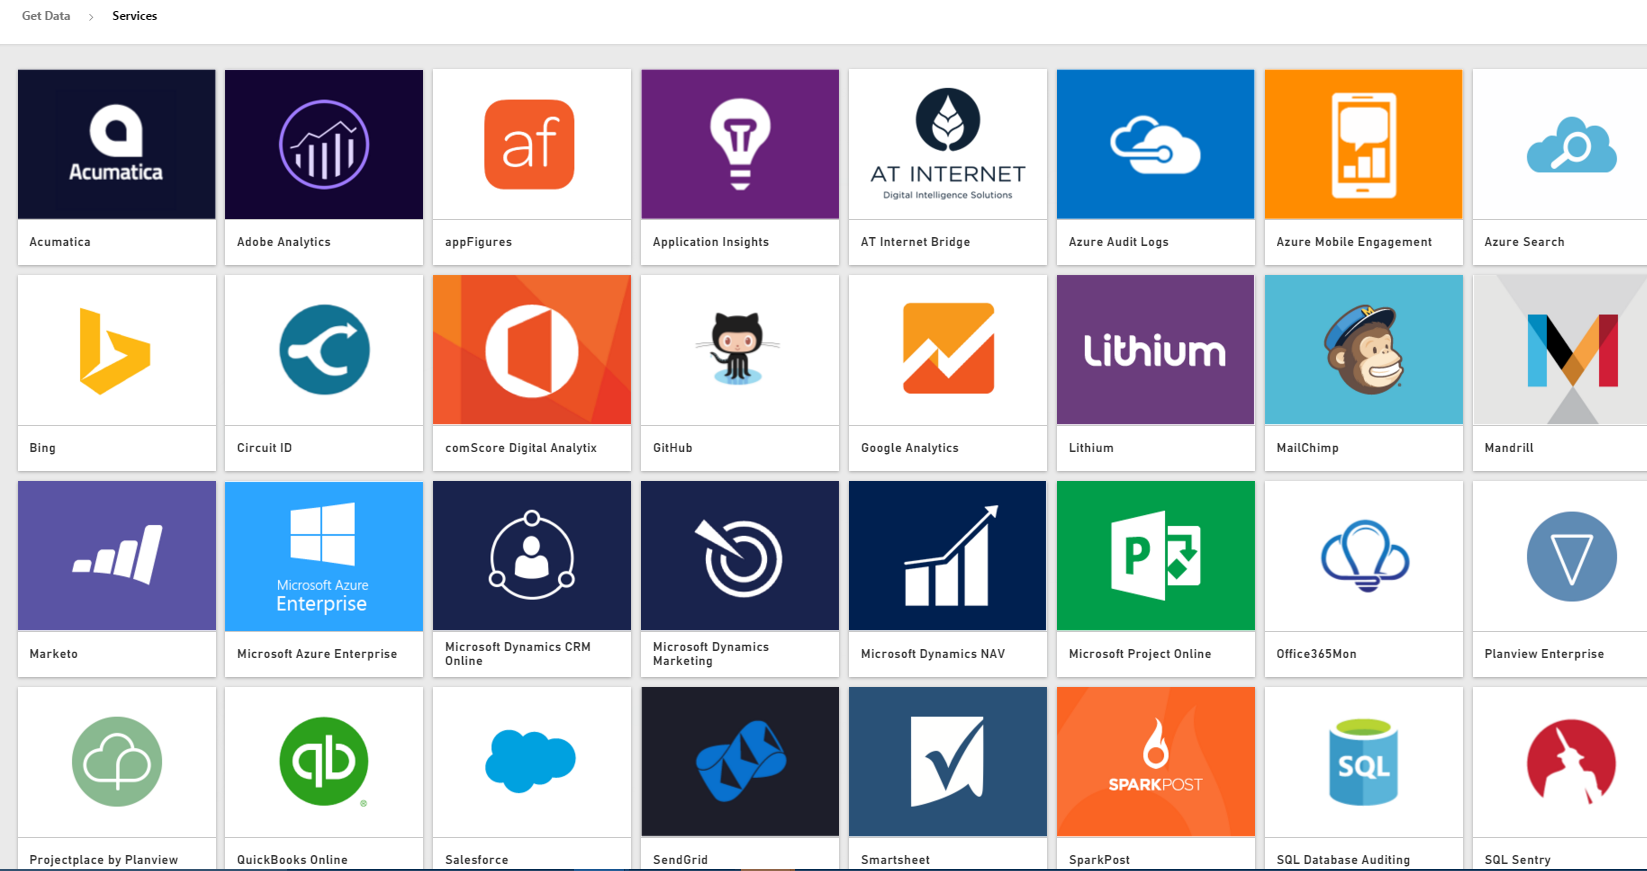
8. Content Packs
Content packs are pre-built dashboards and reports connecting to data such as Salesforce, Marketo, Google, Dynamics, MailChimp etc. All you need to do to use a content pack, is log into Power BI, go to the content pack section, click on the pack you require, and install it. You will then be prompted to enter credentials to your data, and in SECONDS it will build pre-configured and very cool looking reports and dashboards. You get to see your data visually through Power BI right away, and can immediately see trends and unlock the data!
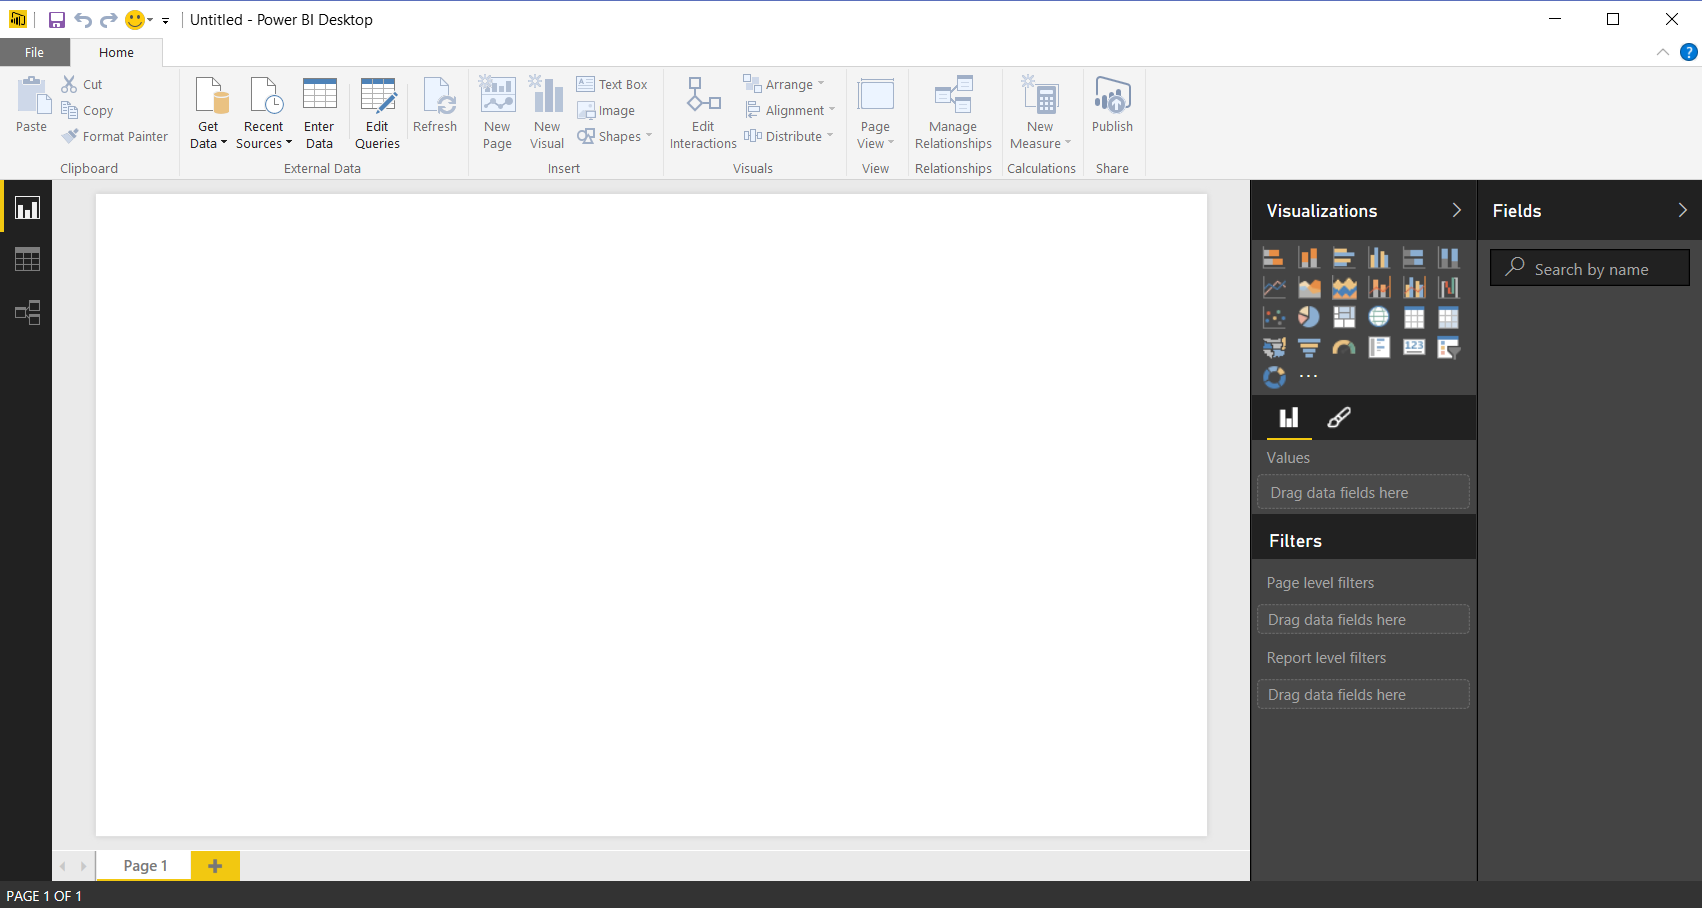
9. Power BI Desktop to build reports
Power BI Desktop is a free download from Microsoft. Install it on your computer and you will be able to connect to data sources and build reports. With the desktop, you get out of the box features to manipulate your data, such as transposing data, changing data types, filtering, choosing columns, etc. You can also use Power Query Formula Language (M).
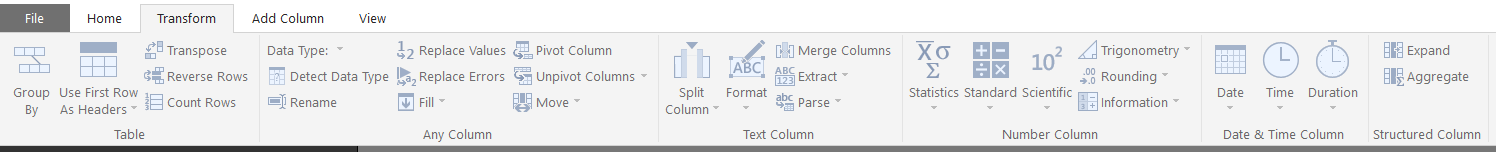
Then, when your data is in the right format, you can use Data Analysis Expressions (DAX) to build measures, calculated columns etc. You have one powerful tool to really get deep into the different data sources you are pulling together.
Also, reports can be created in Excel using the Power addins – Power Query, Power Pivot, Power View and Power Map. Use your existing Excel knowledge and experience to build and publish reports to Power BI.
10. Pull data from many different sources and see it all together in one place
Power BI has the capability to pull data from a large number of data sources. You have power to connect data from all these different sources and build relationships between the data, then transform the data into amazing looking reports that you can view centrally and share easily. Get your data from Salesforce or CRM, your ERP system such as Oracle or Dynamics, connect to a website and pull down table data directly from the HTML! Then join it all together and create highly interactive reports that you can present to your board!
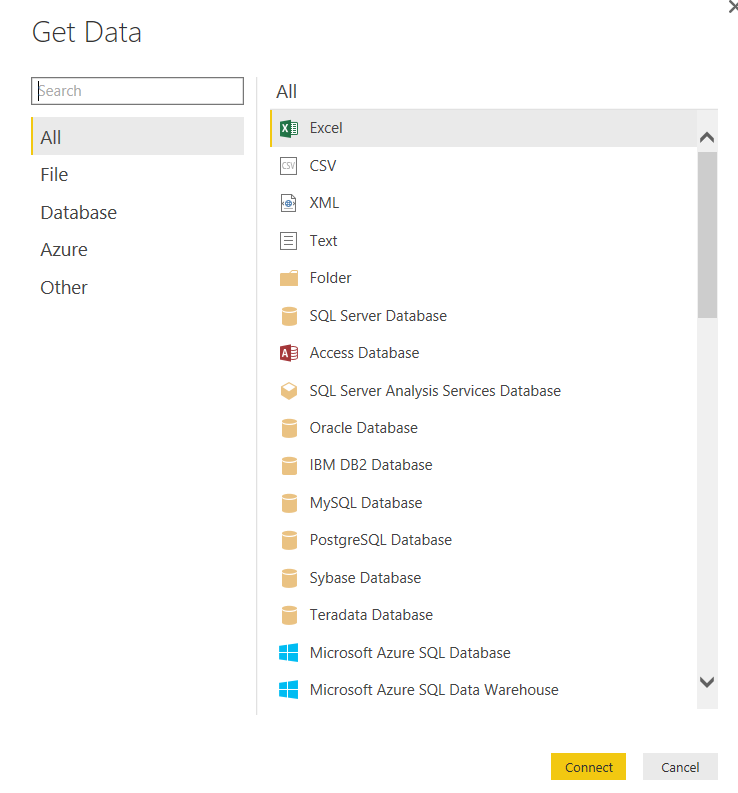
Examples of data sources currently supported include:
- File sources such as:
- Excel
- CSV
- XML
- Text
- Folder
- Databases such as:
- SQL Server Database
- Access Database
- SQL Server Analysis Services Database
- Oracle Database
- IBM DB2 Database
- MySQL Database
- PostgreSQL Database
- Sybase Database
- Teradata Database
- SAP HANA Database (Beta)
- Azure connections such as:
- Microsoft Azure SQL Database
- Microsoft Azure SQL Data Warehouse
- Microsoft Azure Marketplace
- Microsoft Azure HDInsight
- Microsoft Azure Blob Storage
- Microsoft Azure Table Storage
- Azure HDInsight Spark (Beta)
- Microsoft Azure DocumentDB (Beta)
- Microsoft Azure Data Lake Store (Beta)
- Other connections such as:
- Web
- SharePoint List
- OData Feed
- Hadoop File (HDFS)
- Active Directory
- Microsoft Exchange
- Dynamics CRM Online
- Google Analytics
- Salesforce Objects
- Salesforce Reports
- ODBC
- R Script (Beta)
- appFigures (Beta)
- GitHub (Beta)
- MailChimp (Beta)
- Merketo (Beta)
- QuickBooks Online (Beta)
- Smartsheet (Beta)
- Stripe (Beta)
- SweetIQ (Beta)
- Twilio (Beta)
- ZenDesk (Beta)
- Spark (Beta)
- Blank Query
- File sources such as:
Additionally: Power BI Enhancements and the Community
Microsoft is investing a lot of manpower into Power BI. Update enhancements are being released very regularly for a Microsoft product. It seems every month I am reading about the awesome new capabilities of the latest Power BI release. Also, the Power BI website has a section where users can submit ideas to the Power BI team, and other users in the community can vote on those ideas, so the best ideas rise to the top and hopefully make it into a future release. The system works well, as a number of ideas have been rolled into the product to date.
Conclusion
So, when someone asks you what’s so good about Power BI? The best answer is something like this.
“Imagine being able to access all your data everywhere, being able to view the data in different visualizations, analyze and drill into the data, drag and drop to create new reports and dashboards that you can share, have it automatically refresh, type in questions in natural language, get out of the box reports in seconds with content packs, build reports with a tool that does a lot of the work for you, and have all this updated constantly by Microsoft and community input. Oh and it can be free.”
I’m looking forward to even more enhancements from this compelling service from Microsoft.
I AM SPENDING MORE TIME THESE DAYS CREATING YOUTUBE VIDEOS TO HELP PEOPLE LEARN THE MICROSOFT POWER PLATFORM.
IF YOU WOULD LIKE TO SEE HOW I BUILD APPS, OR FIND SOMETHING USEFUL READING MY BLOG, I WOULD REALLY APPRECIATE YOU SUBSCRIBING TO MY YOUTUBE CHANNEL.
THANK YOU, AND LET'S KEEP LEARNING TOGETHER.
CARL

Hi Carl,
I would like to know more about the visualizations created by you for the “This year sales and last year sales”.
I have a use case similar to it.
It would be helpful.
Thanks,
Amol Khor