In Power BI, we can set up drillthrough, so users can go from one report visualization to a related visualization to see more detailed information. Let’s go through an example of how to do this.
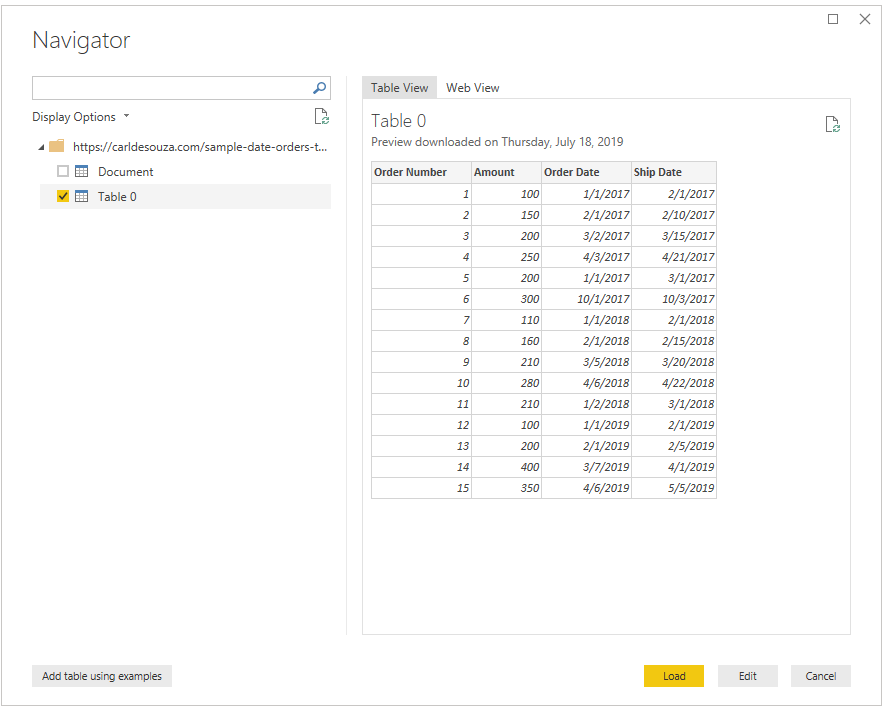
First, let’s connect to our data. We will use the sample data here. Pull it into Power BI Desktop using the Web Connector. Click Load:
Next, let’s set up the report, with the following steps:
- Create a date table, e.g. using CALENDAR or CALENDARAUTO, and add columns for Year, Month, Year Month, Year Month Sort etc.
- Set up any sorting of the date fields.
- Mark the date table as a Date Table.
- Create a relationship between the Dates date and the Orders Date.
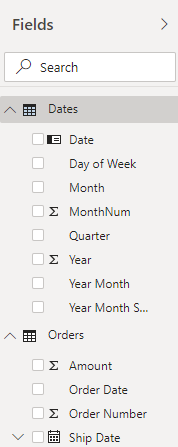
Now, my queries look like:
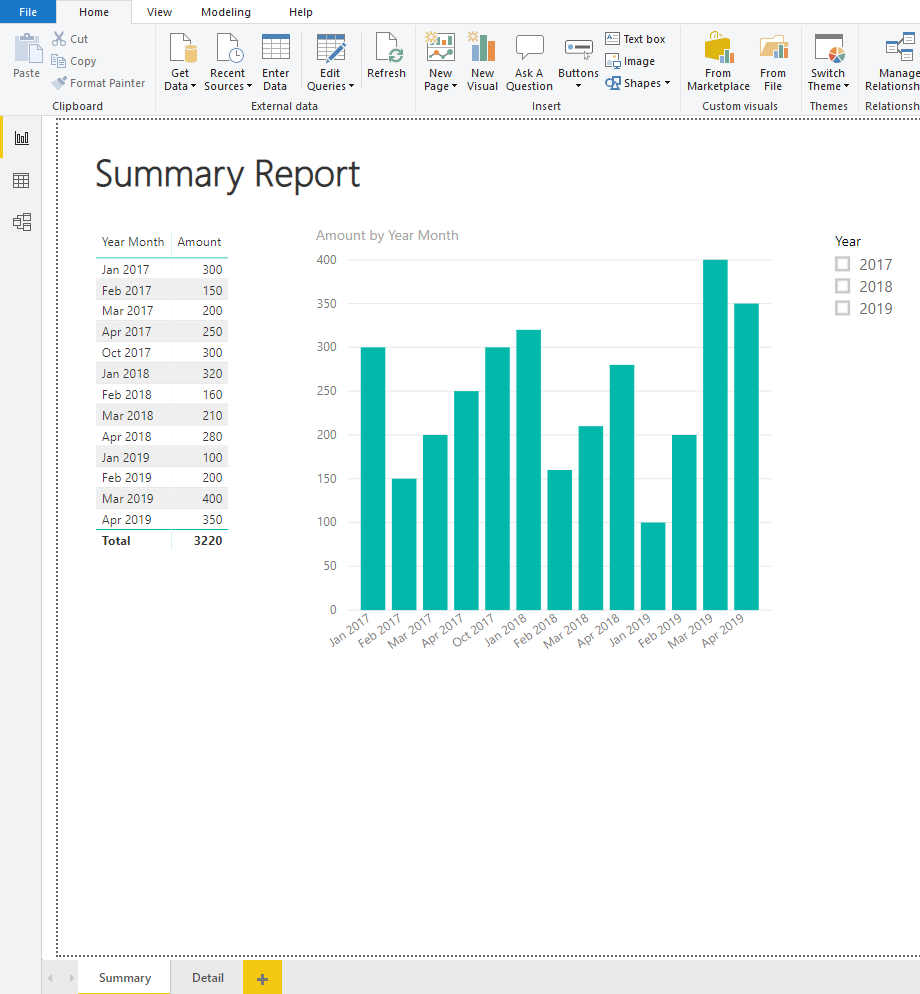
Let’s add some visualizations to the report. We will display a table with Year-Month and Amount, a Clustered Column Chart with the same data, and a Year slicer. We will do this on Page 1 of the report, which we will rename to Summary. Note the Detail is Page 2, which we will do next:
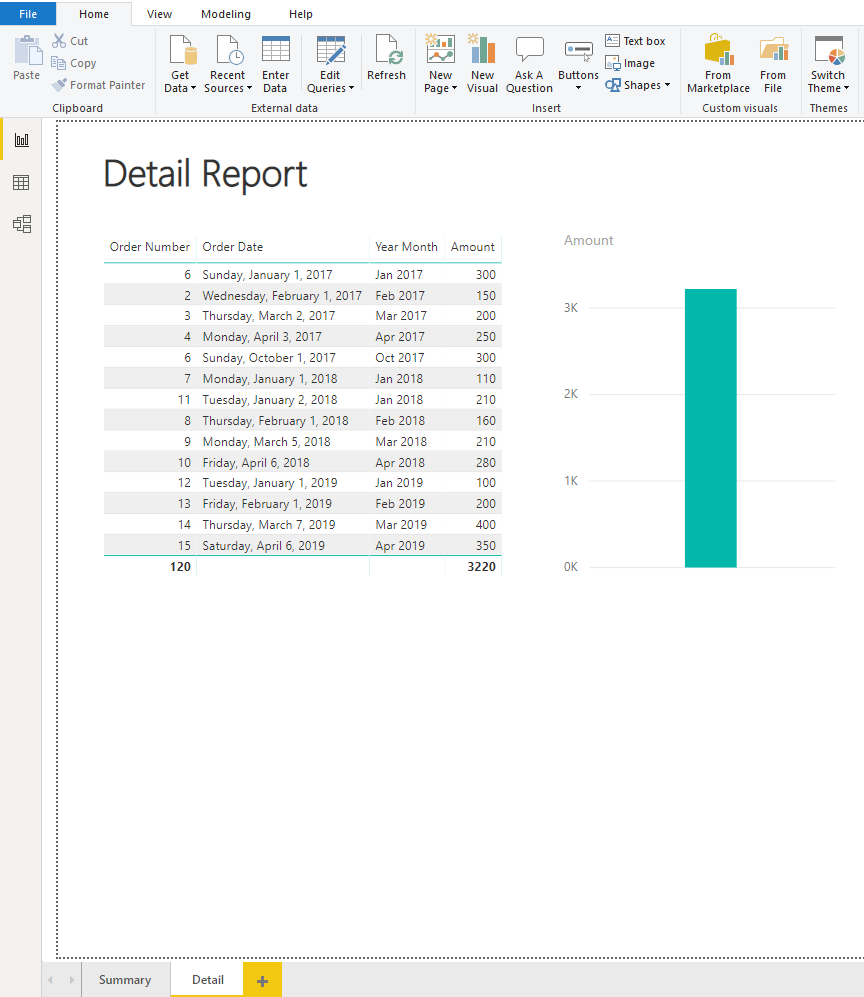
Now in the Detail tab, we will add a table with the fields Order Number, Order Date, Year-Month and Amount. We will also add an Amount column chart:
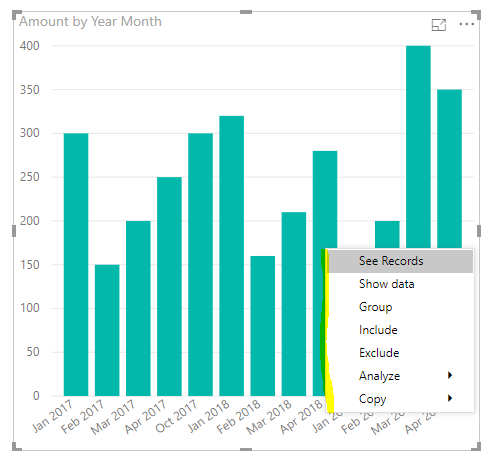
Now, back on the Summary tab, if we right-click on a bar in the chart, we get options including See Records, Show Data, etc. We do not have an option for Drillthrough:
Let’s link the Summary and Detail report tabs by configuring drillthrough.
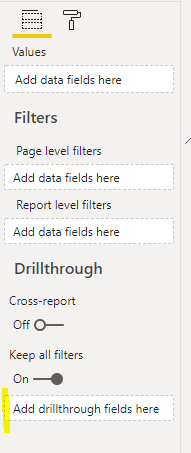
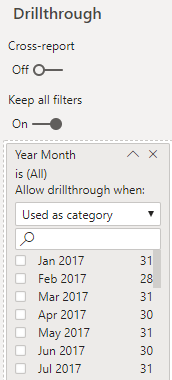
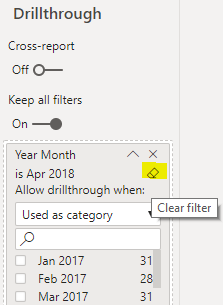
On the Detail tab, drag the Year-Month column into the field filters:
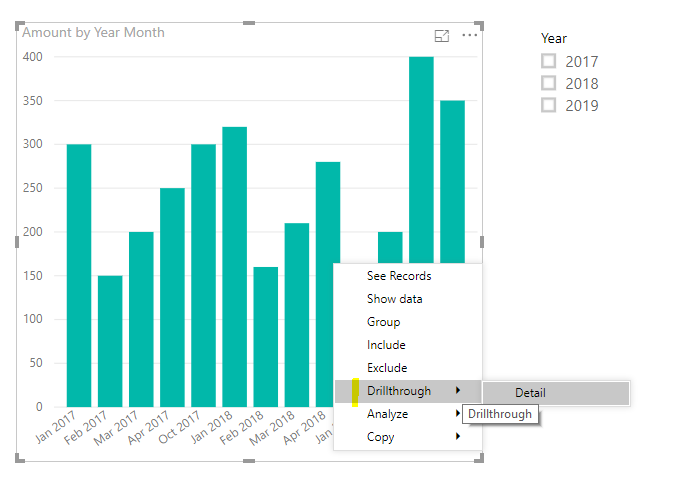
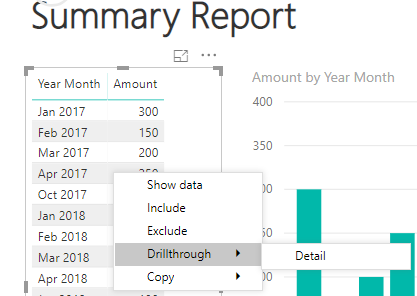
Our report is now ready for drillthrough. Go to the Summary and right-click a column. We can see the Drillthrough option is available, and it points to our Detail tab:
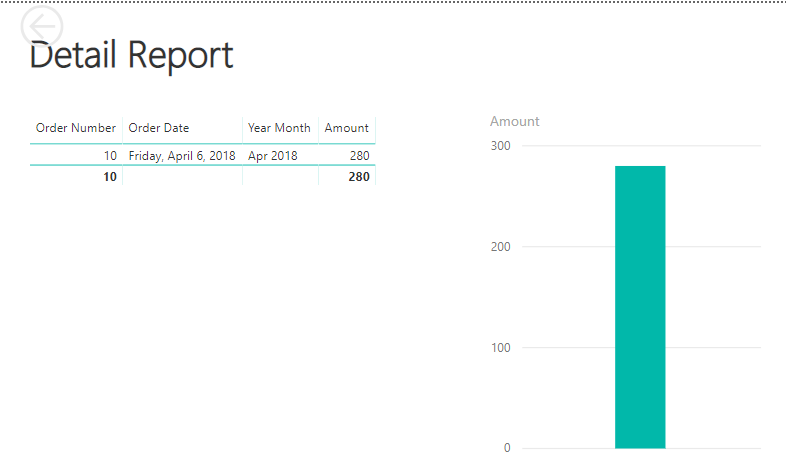
On clicking on the Detail option here, it takes us to the Detail tab, with the filtered data:
To clear the filter, click Clear Filter:
Note we can use the same drillthrough in the table:
I AM SPENDING MORE TIME THESE DAYS CREATING YOUTUBE VIDEOS TO HELP PEOPLE LEARN THE MICROSOFT POWER PLATFORM.
IF YOU WOULD LIKE TO SEE HOW I BUILD APPS, OR FIND SOMETHING USEFUL READING MY BLOG, I WOULD REALLY APPRECIATE YOU SUBSCRIBING TO MY YOUTUBE CHANNEL.
THANK YOU, AND LET'S KEEP LEARNING TOGETHER.
CARL
