In this post, we will take a look at the Power Virtual Agent analytics available that can help you track the success of your bot.
To view analytics, go to your bot in the PVA maker at https://web.powerva.microsoft.com/ and select Analytics, and you should land on the Summary tab:
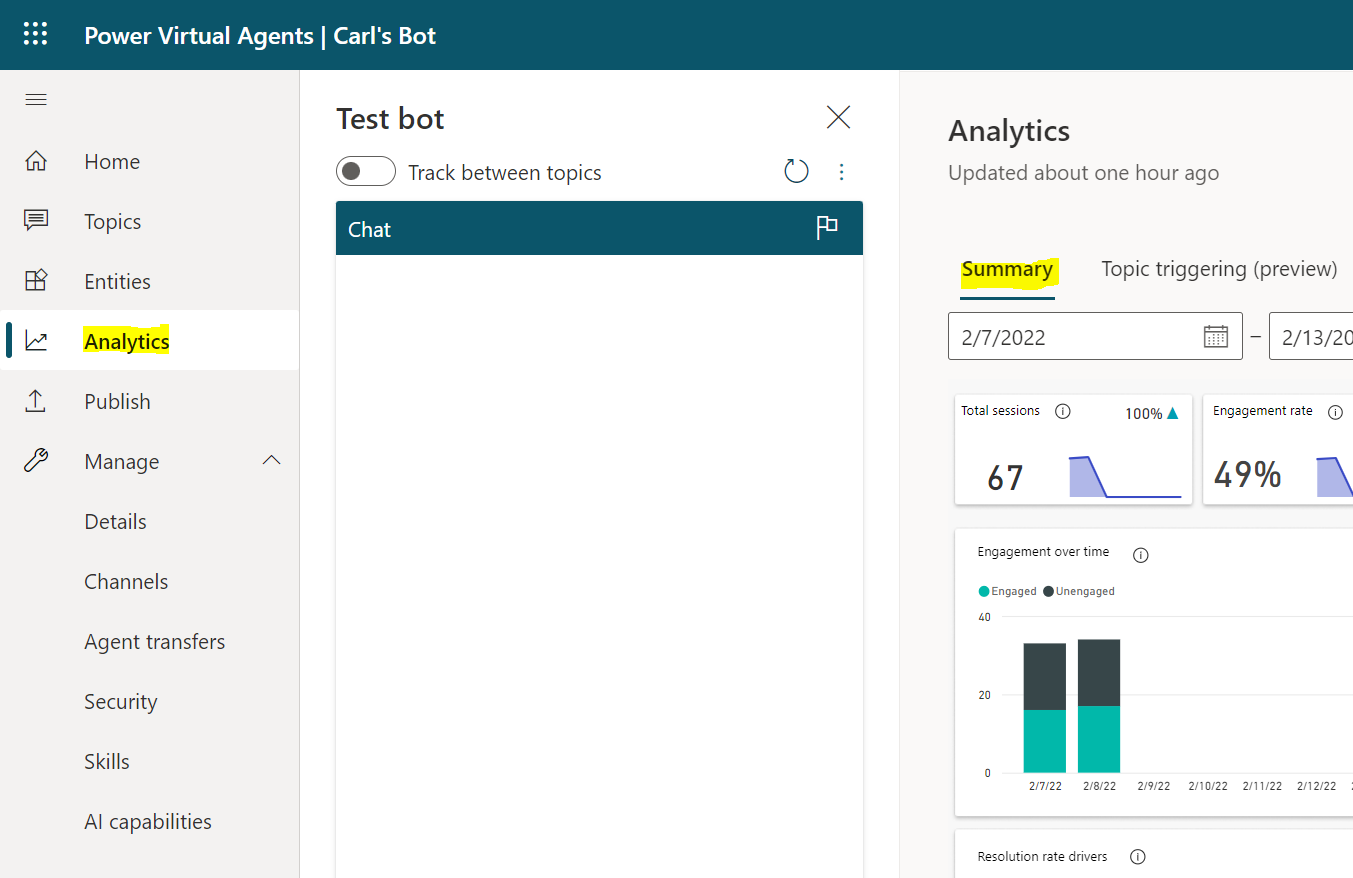
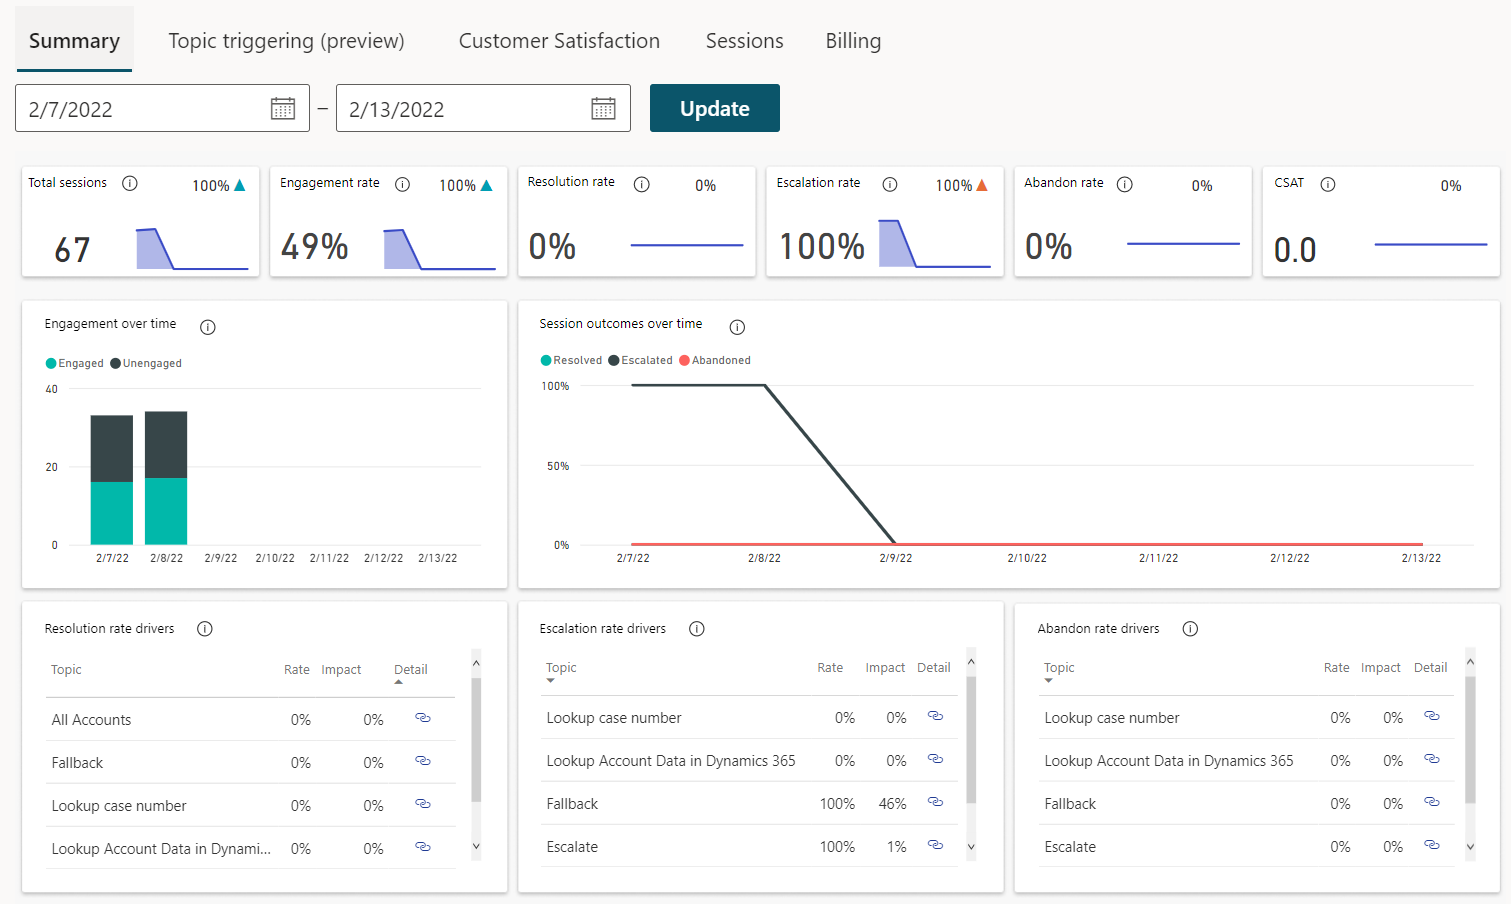
An embedded Power BI report will load, and we can see several analytics are available to help you with your bot:
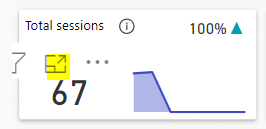
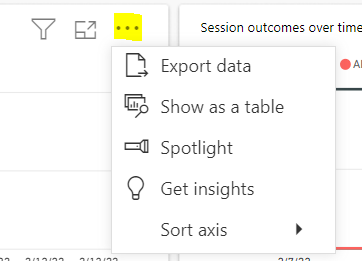
The report works like you would expect a Power BI report to work, with the ability to pop out tiles, view filters, export data, click on data to filter other data, etc:
Let’s look at each of the tiles.
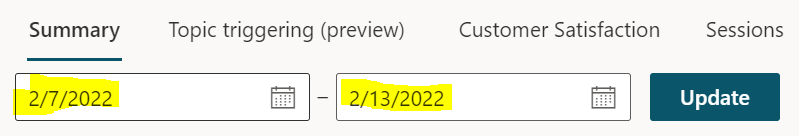
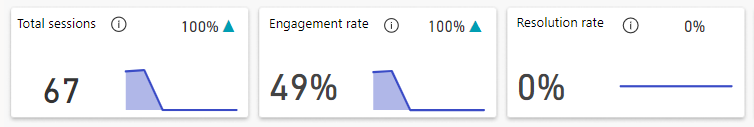
Total Sessions shows the total sessions for the bot. Note this is within the time period specified:
Engagement Rate is a percentage of the “engaged sessions” – “a user-created topic (as opposed to a system topic) is triggered, or the session ends in escalation”.
Resolution Rate is where the user says “Yes” to the end of conversation survey “did that answer your question?”.
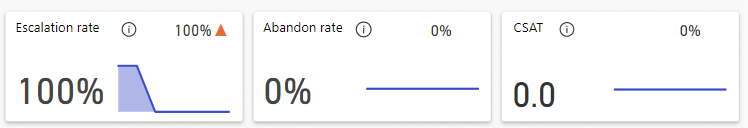
Escalation Rate – percentage escalated to an agent.
Abandoned Rate – percentage that was not resolved or escalated.
CSAT – Average Customer Satisfaction Score from end of chat survey.
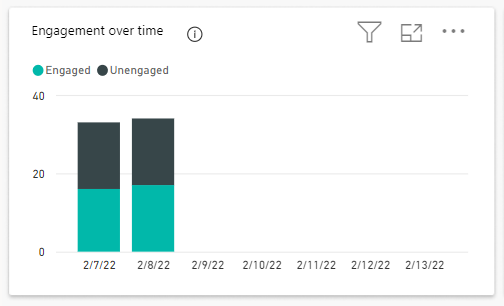
Engagement over Time – engaged vs unengaged sessions over time.
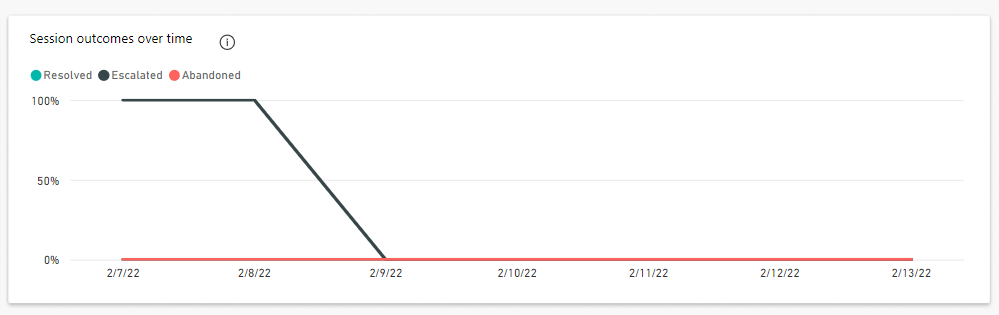
Session Outcomes over Time – Shows Resolved vs Escalated vs Abandoned over the time period.
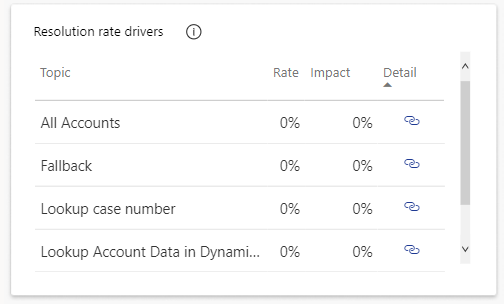
Resolution Rate Drivers – shows the topic and the rate (percentage resolved) and impact (overall resolution rate including the topic minus the overall resolution rate excluding the topic).
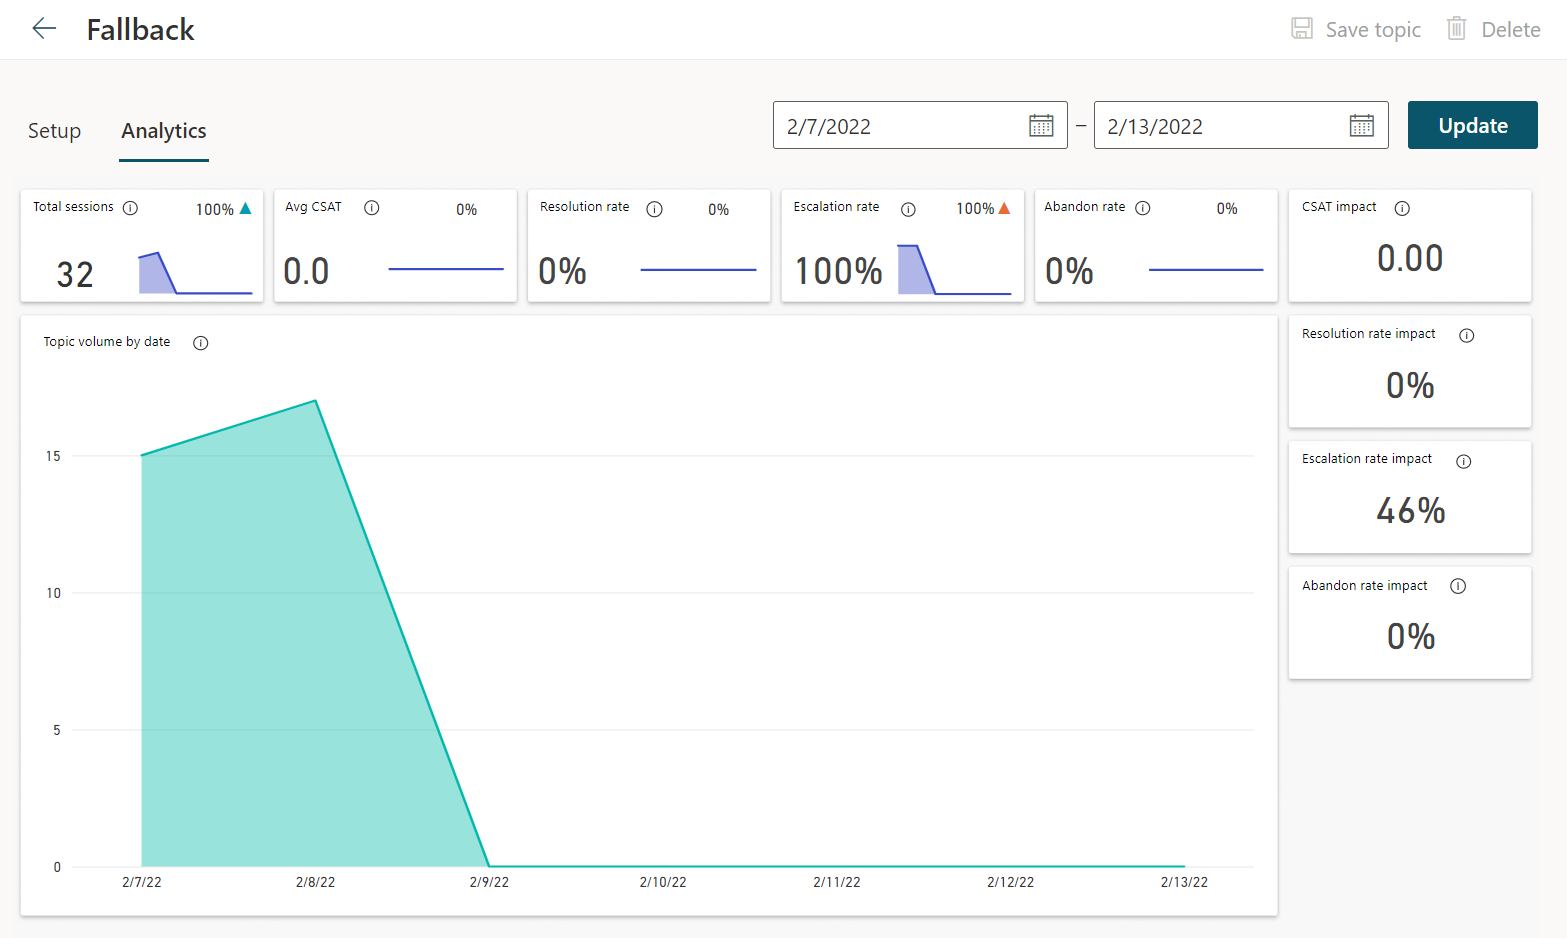
Clicking on the detail link takes you to more details.
Let’s look at the Fallback details from above:
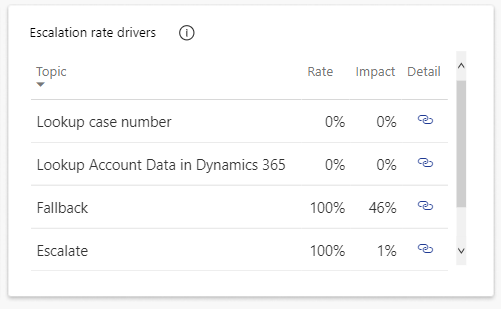
Escalation Rate Drivers – As above, but for escalations.
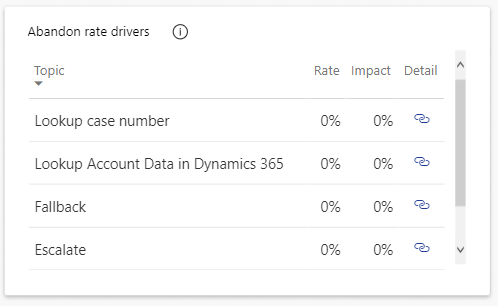
Abandon Rate Drivers – as above, for abandoned chats.
Very useful information for helping make your bot better. For more details, check out the Microsoft documentation here.
I AM SPENDING MORE TIME THESE DAYS CREATING YOUTUBE VIDEOS TO HELP PEOPLE LEARN THE MICROSOFT POWER PLATFORM.
IF YOU WOULD LIKE TO SEE HOW I BUILD APPS, OR FIND SOMETHING USEFUL READING MY BLOG, I WOULD REALLY APPRECIATE YOU SUBSCRIBING TO MY YOUTUBE CHANNEL.
THANK YOU, AND LET'S KEEP LEARNING TOGETHER.
CARL
