In this post, we will look at how to create dashboards in the Azure portal so we can monitor the performance of app services. This is useful to ensure your apps are running smoothly and you can deal with any performance issues if they were to occur.
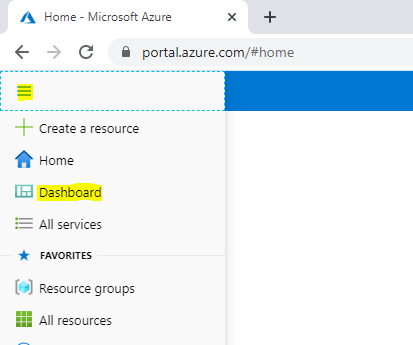
First, let’s log into the Azure portal at https://portal.azure.com and in the top left click on Dashboard:
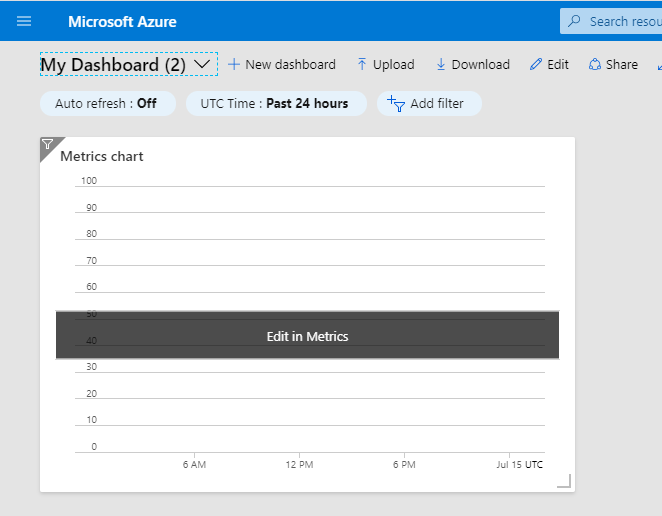
We now see a tile below. Click Edit in Metrics:
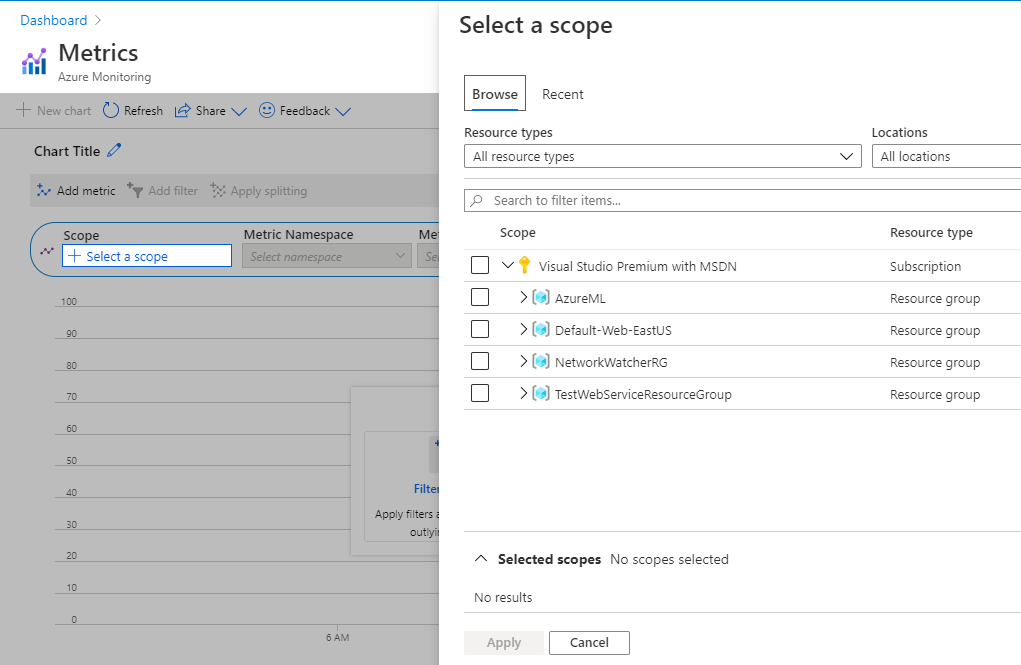
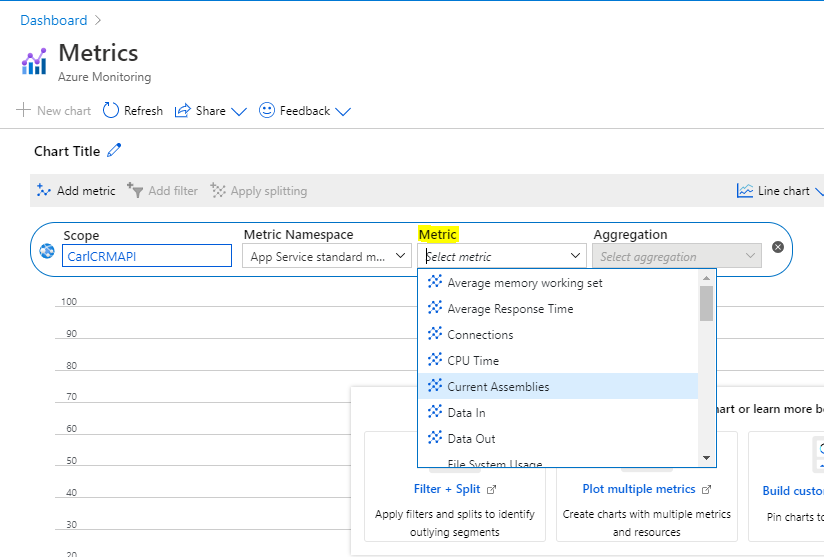
We now get the ability to select the metrics for our tile. Select the scope:
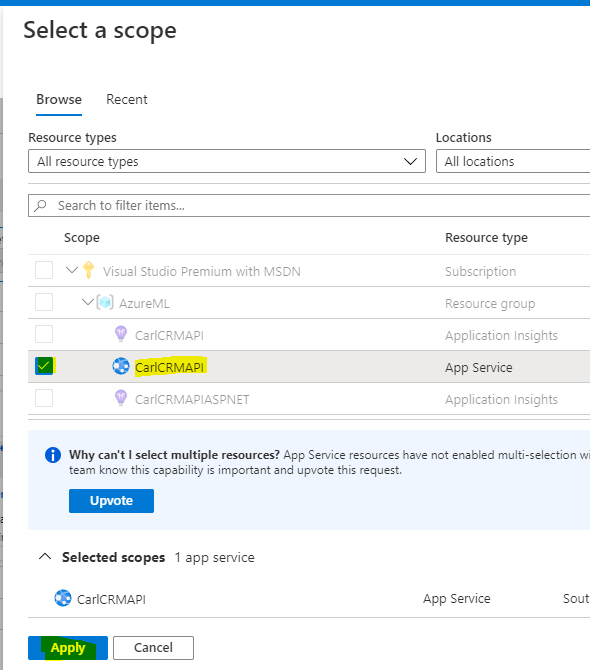
We will select an App Service and click Apply:
We now get to choose the metric:
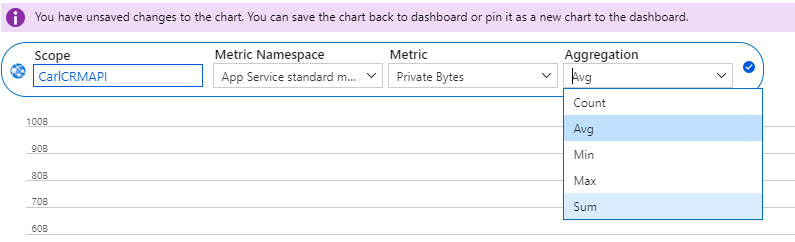
We will select Private Bytes. And then the aggregation. We will select count :
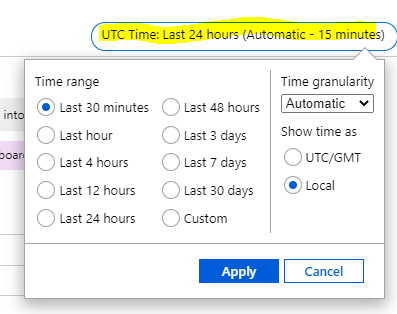
Select to change the time period for the metric as well:
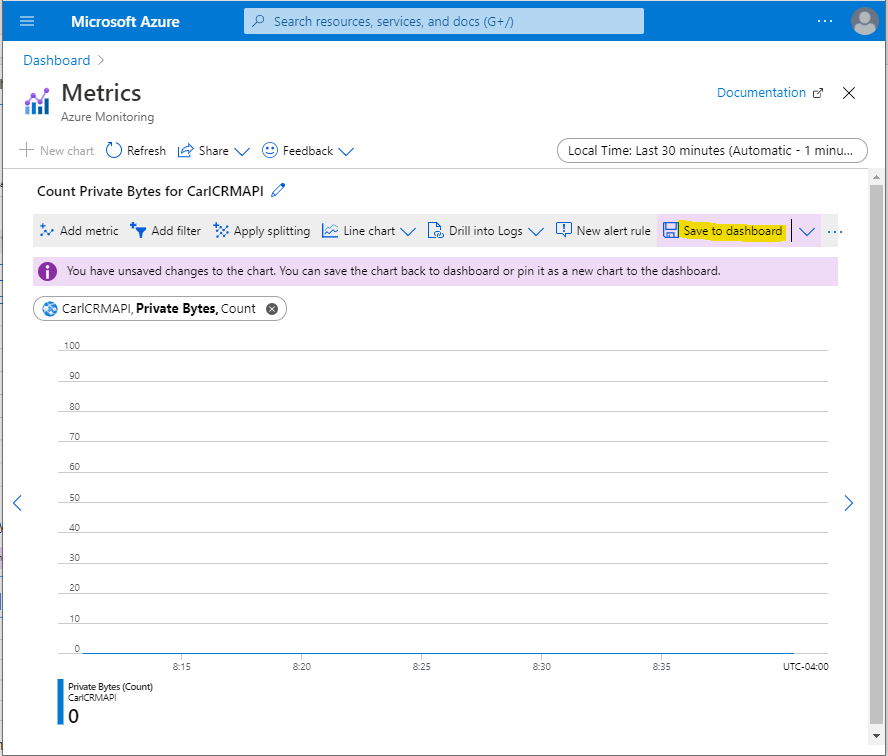
It should look something like below. Click Save to dashboard:
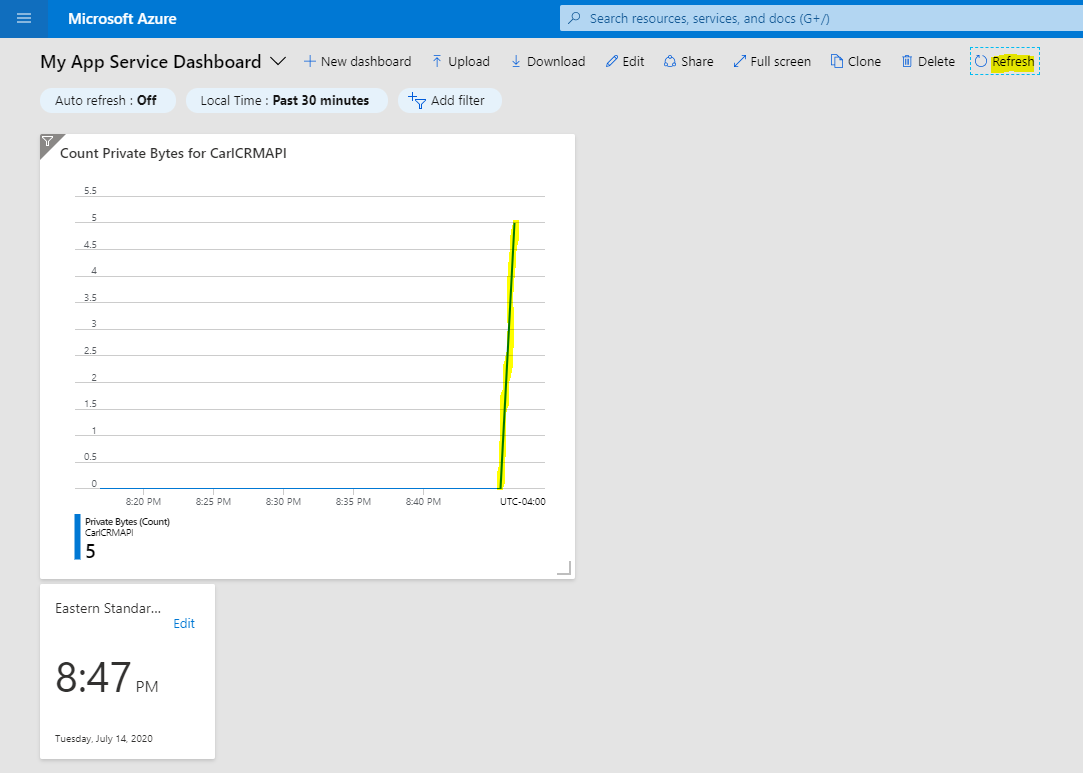
Our dashboard now looks like:
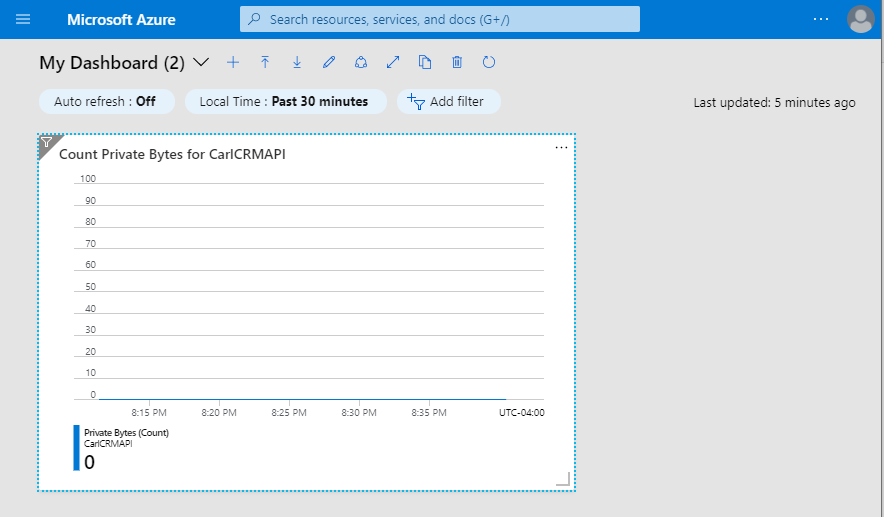
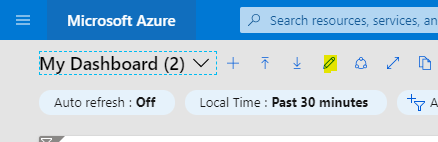
Click Edit:
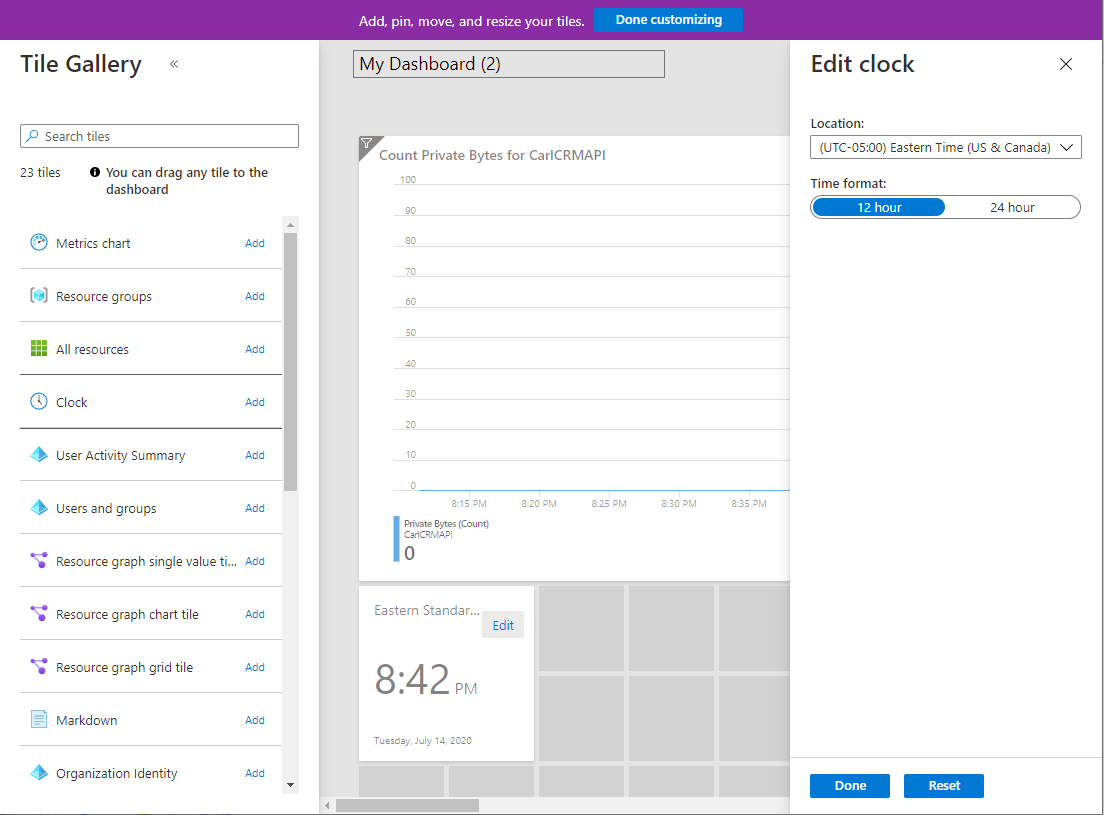
Here we can add other tiles to the dashboard. Let’s add a clock. We can also resize tiles:
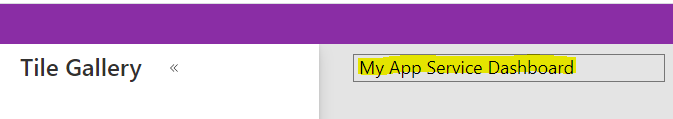
And rename the dashboard:
Now let’s send some requests through to the resource we are monitoring:
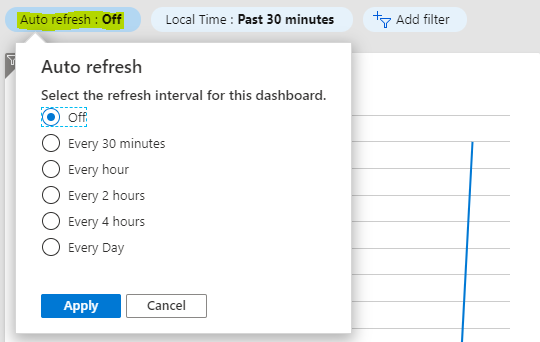
You can also set the dashboard to auto-refresh:
I AM SPENDING MORE TIME THESE DAYS CREATING YOUTUBE VIDEOS TO HELP PEOPLE LEARN THE MICROSOFT POWER PLATFORM.
IF YOU WOULD LIKE TO SEE HOW I BUILD APPS, OR FIND SOMETHING USEFUL READING MY BLOG, I WOULD REALLY APPRECIATE YOU SUBSCRIBING TO MY YOUTUBE CHANNEL.
THANK YOU, AND LET'S KEEP LEARNING TOGETHER.
CARL
