Microsoft has made available a tutorial to learn Azure ML by using data from the Titanic. With the data, we can work out whether a person is more likely to have survived the disaster or not.
Here we will go through the example. In Part 1 of this post, we will extract, transform and load the data into Azure ML.
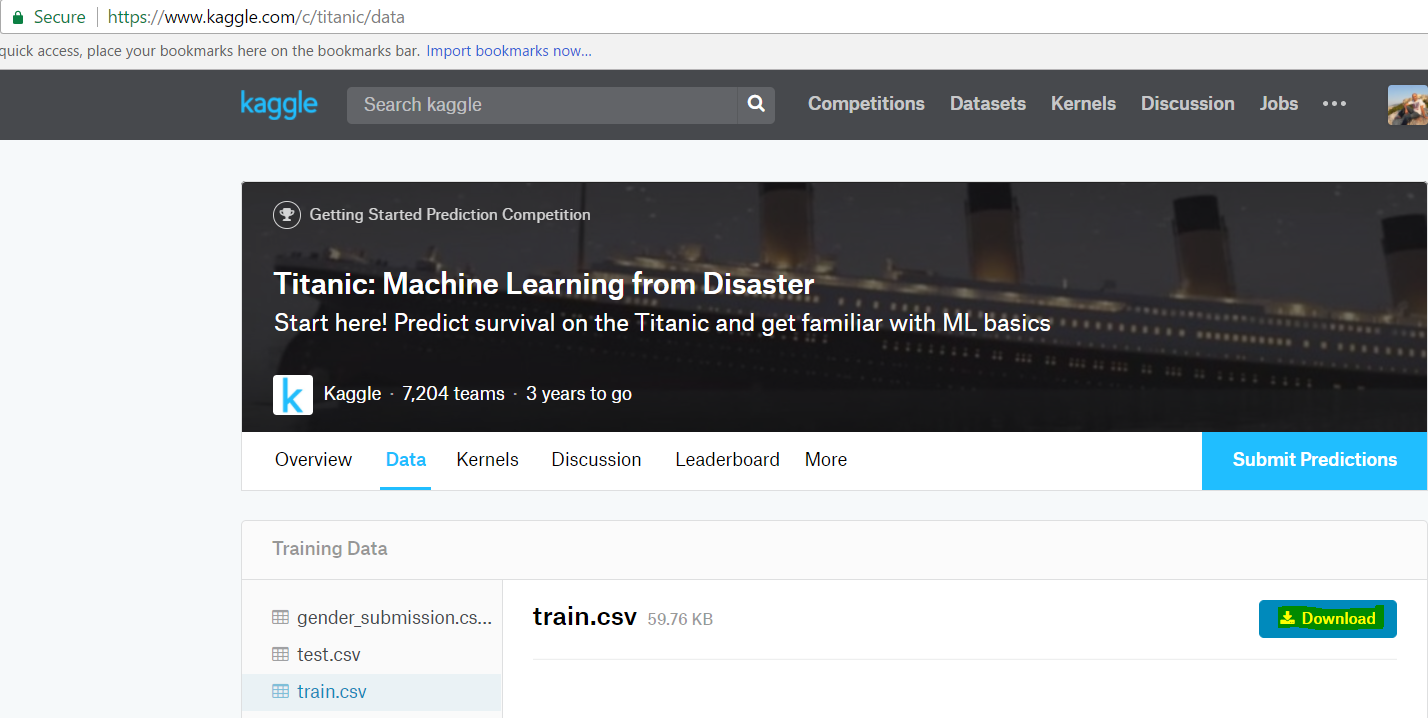
First, download the sample data. The data is stored at: https://www.kaggle.com/c/titanic/data. There are 2 files – train.csv and test.csv. The train.csv file is used to train your data, and the test.csv used to test it. Select Download:
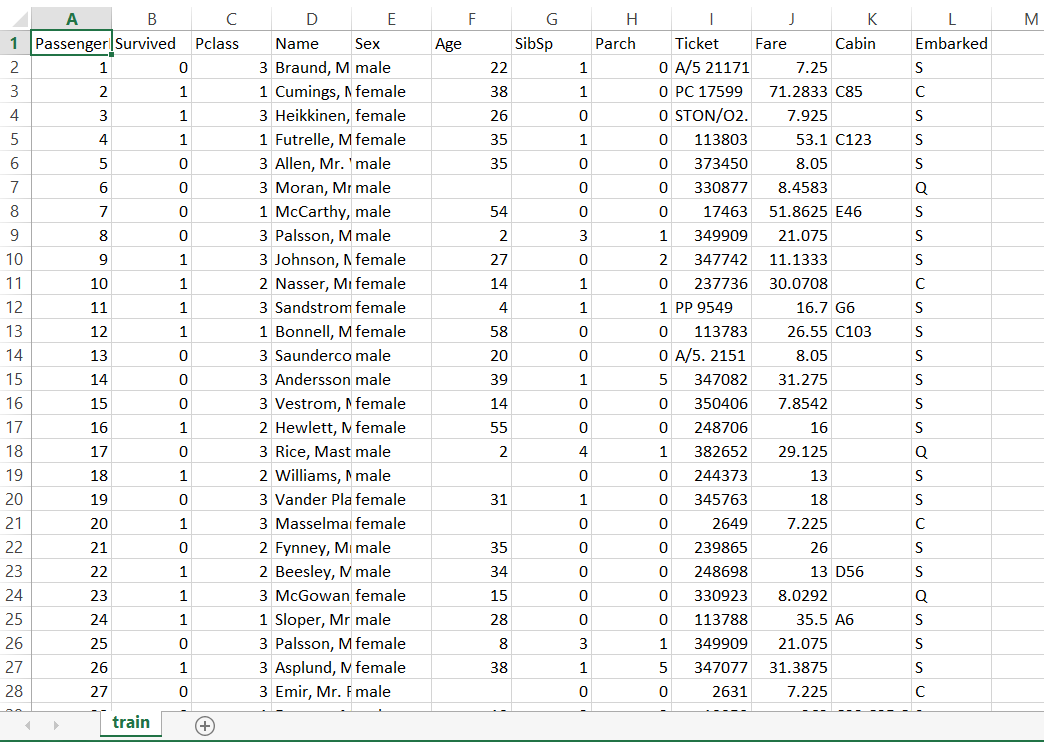
Opening the train.csv file, you can see it contains information such as whether the person survived, their gender, age, pclass (the class of the room) etc.
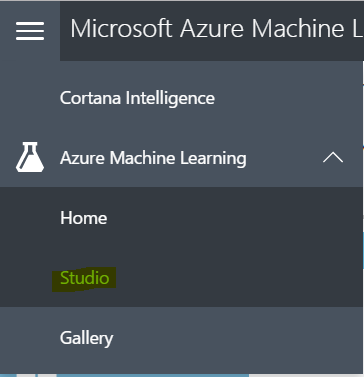
Log into https://studio.azureml.net/ and go to the studio:
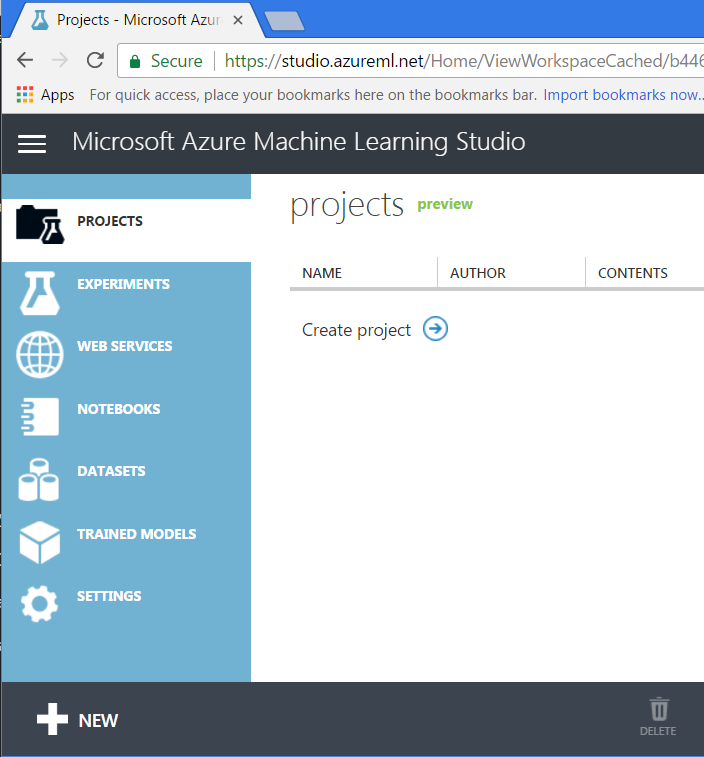
You should see something like this. Select New from the bottom right:
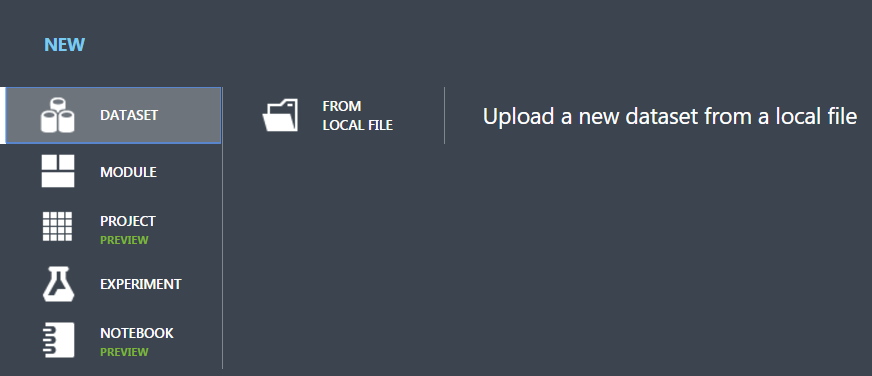
Select dataset->from local file:
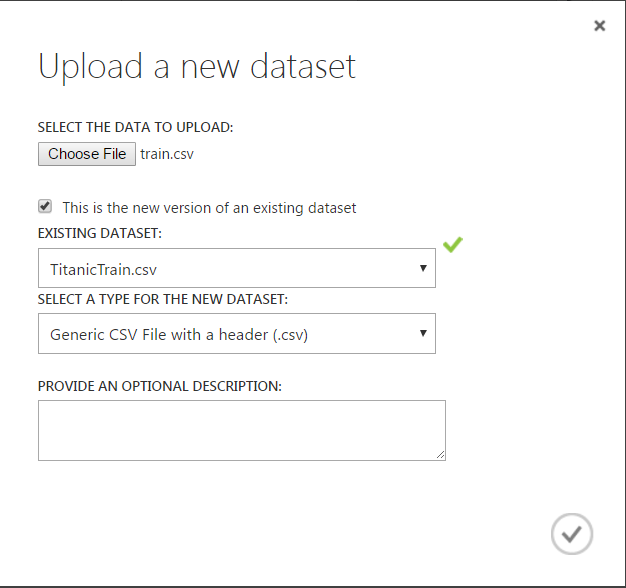
Select the train.csv file. In my case, Azure picks up that the file was previously loaded:
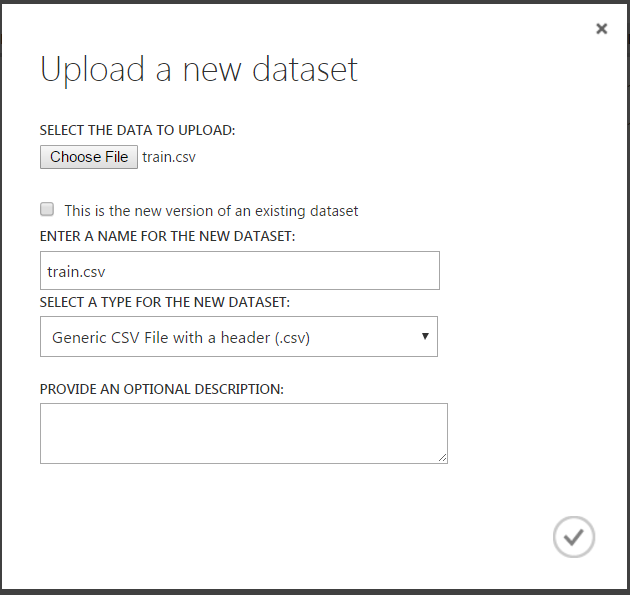
If this was a new dataset, you would see below:
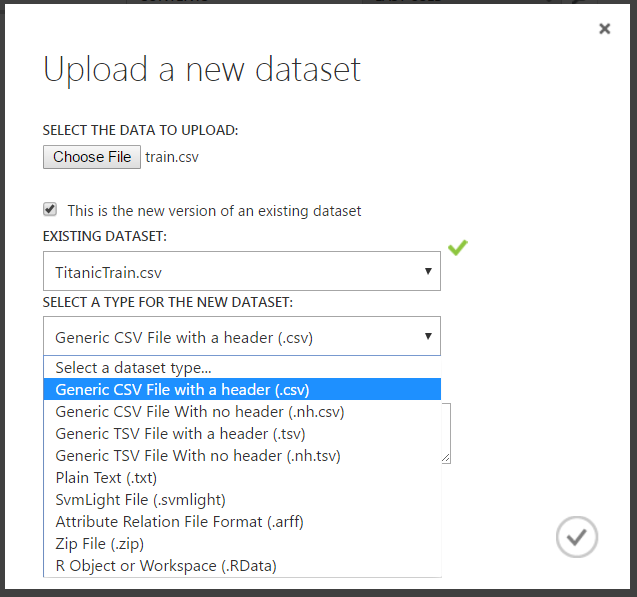
Note the different options for file types:
Click the checkbox to save. You will see the dataset upload:

Now we can create a new experiment. Click on the New button again in the bottom left and select Blank Experiment:
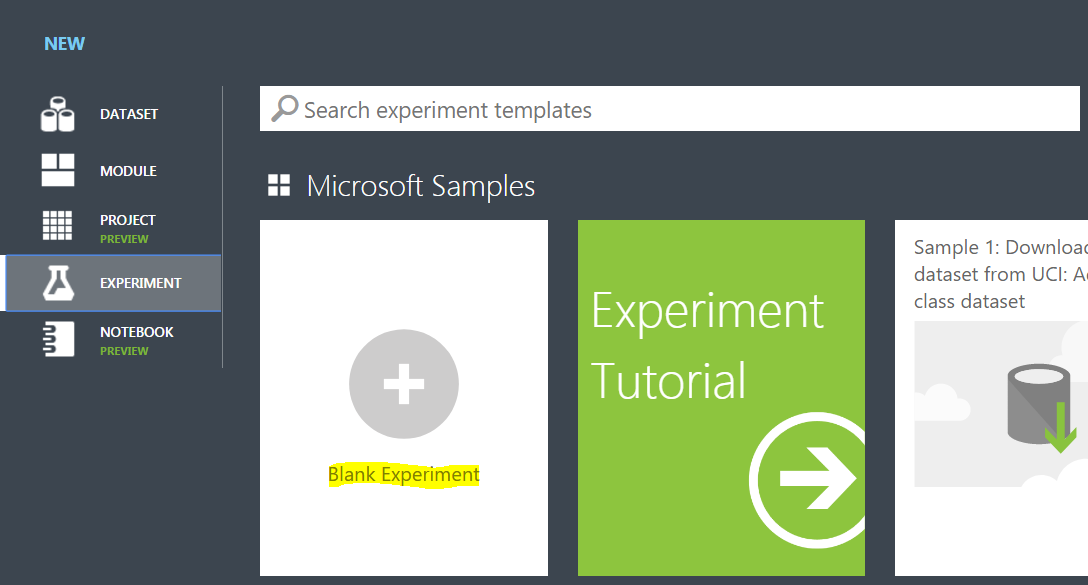
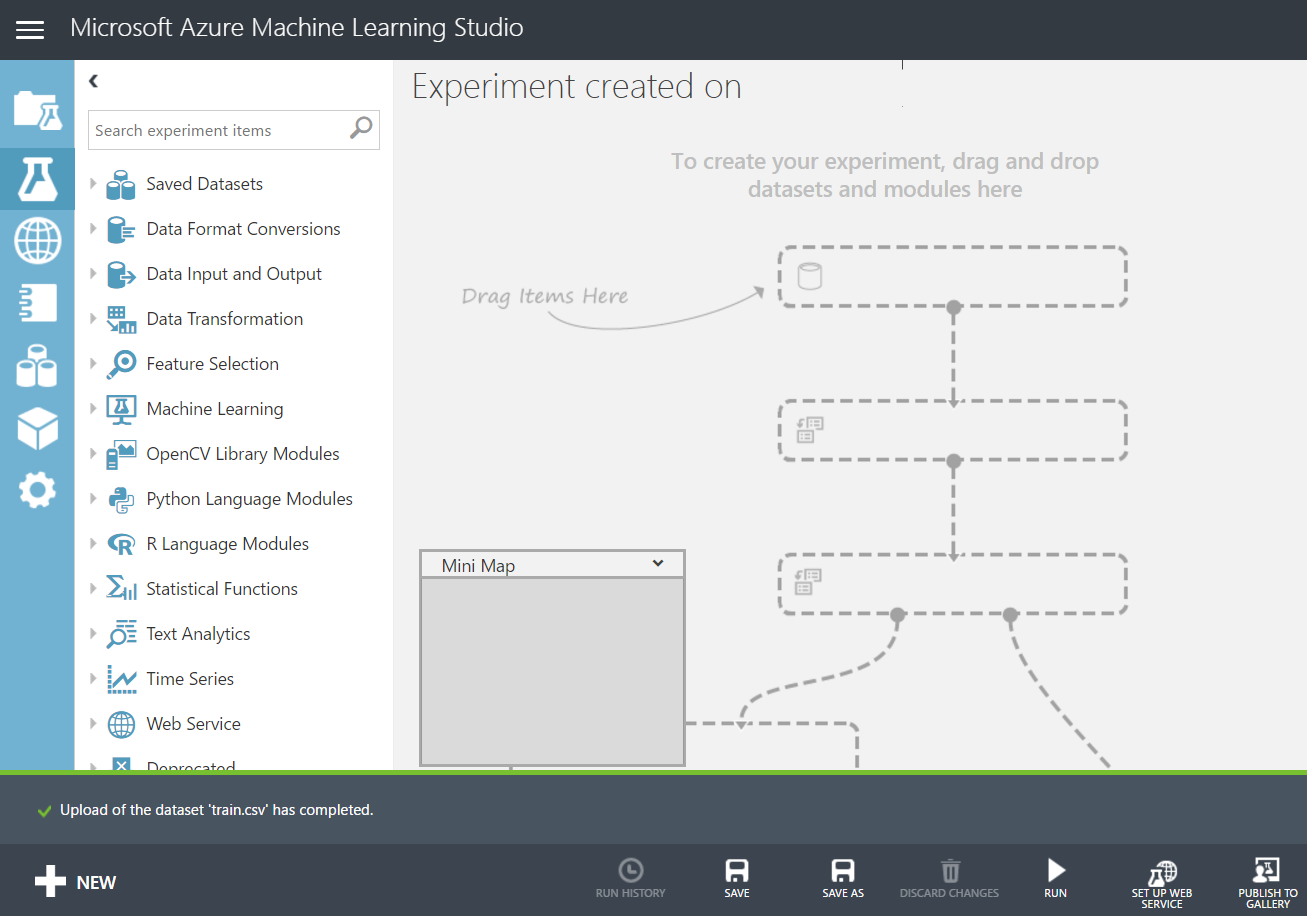
Give the experiment a name:

Expand Saved Datasets and you will see train.csv under My Datasets:
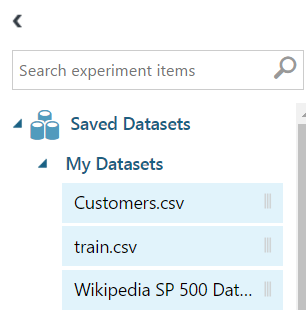
Drag the file into the workspace:

You can preview the data by right clicking and selecting Visualize:
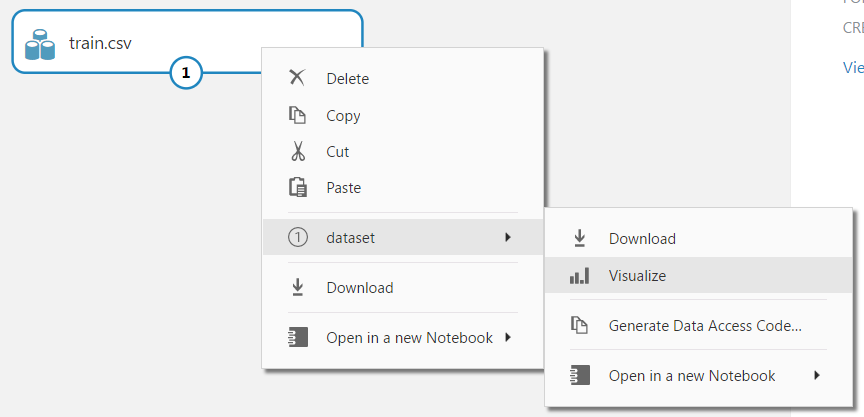
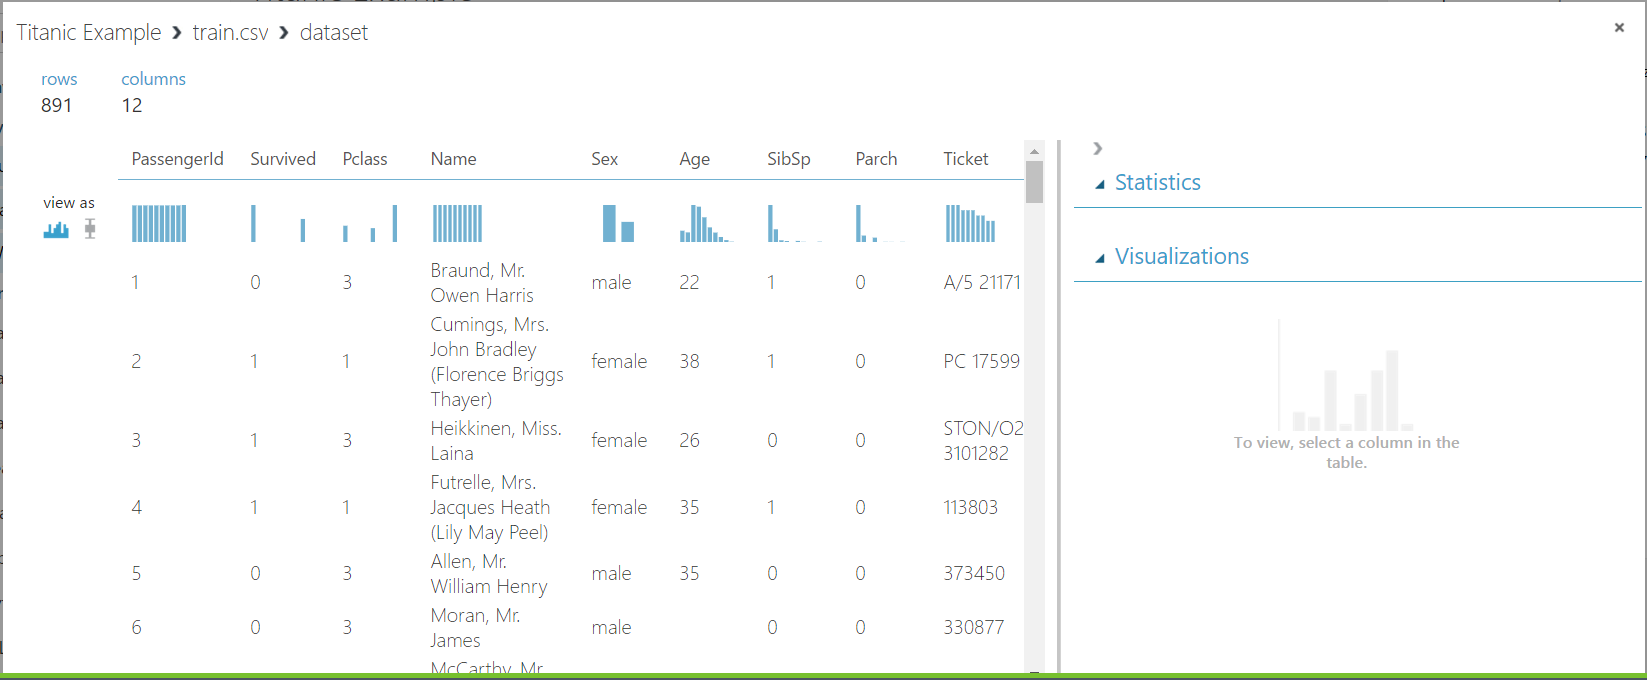
Selecting a column will provide more details such as median, min, max etc:

We also see the histograms at the top:

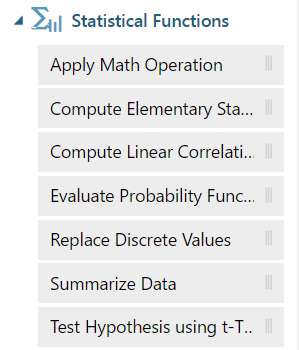
Expand Statistical Functions. We see Summarize Data:
Drag this onto the workspace and link it to train.csv:
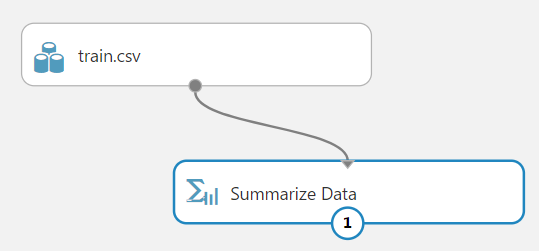
At the bottom of the screen, select Run:

Once complete, you will see a checkbox:
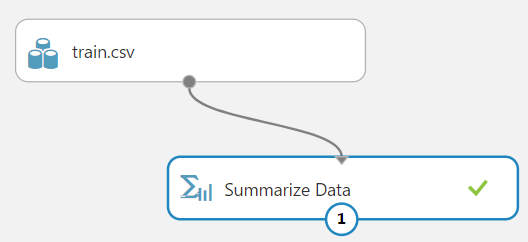
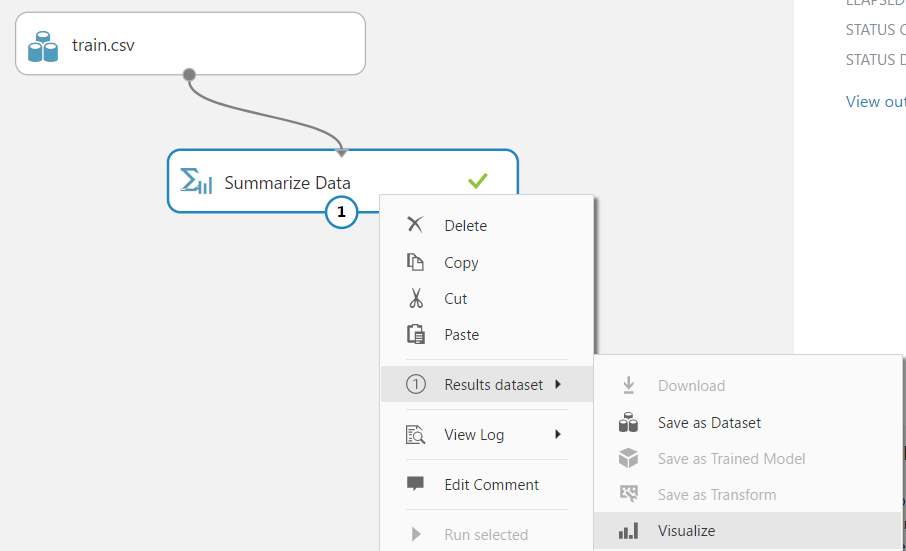
Right click, and select Visualize from Results:
This is giving us more information about our data:
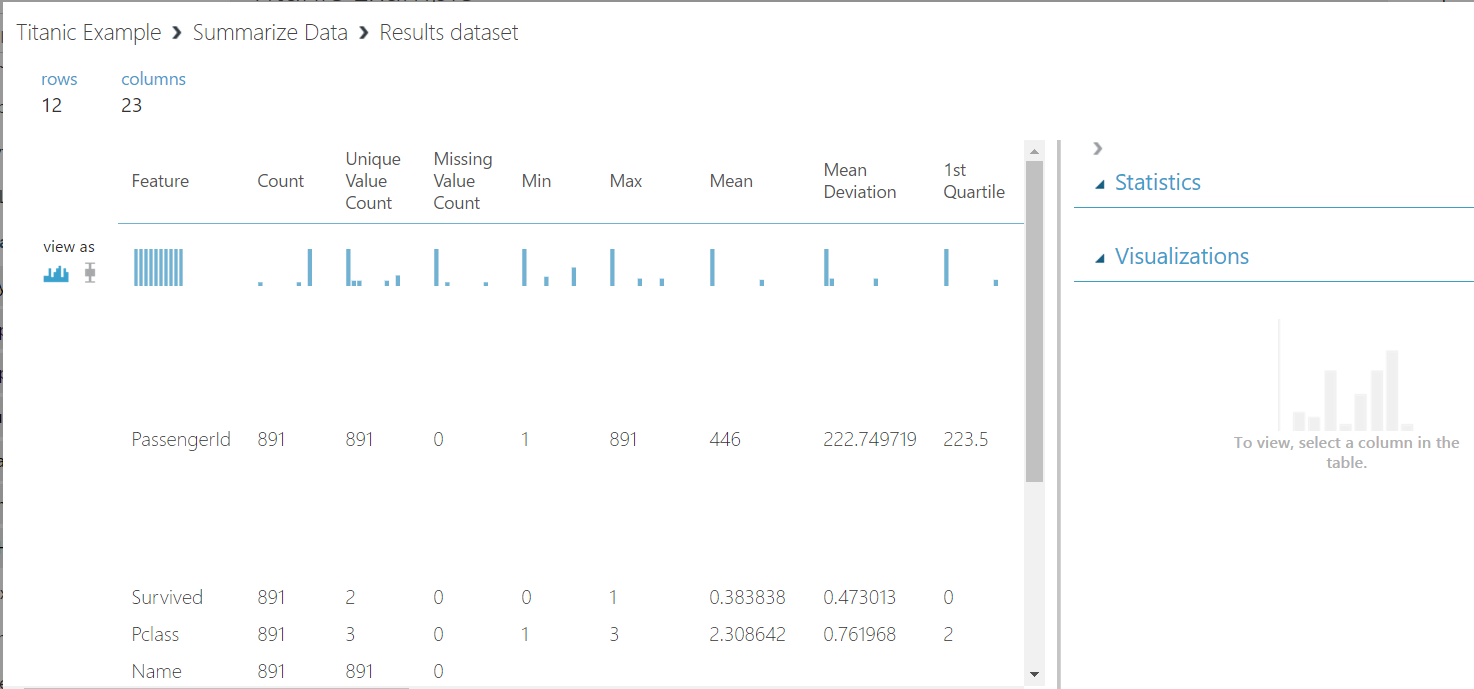
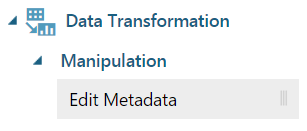
We can see that Passenger Id is a numeric value, whereas for Azure ML it should be categorical. To fix this, find Edit Metadata:
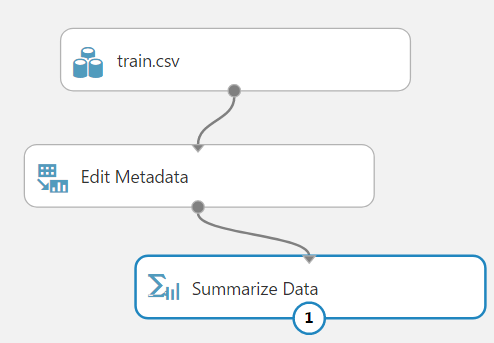
Drag this onto the workspace and connect it (remove the other connection):
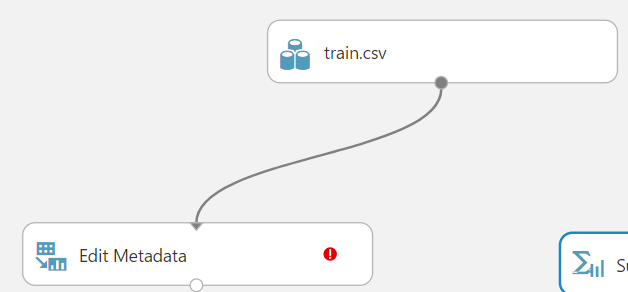
Launch the column selector so we can change the columns:

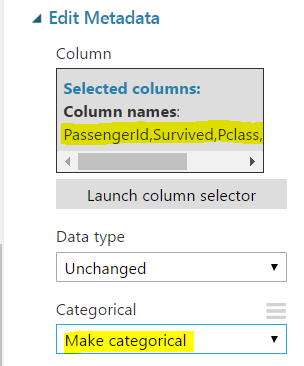
Here we can select which columns we want to change (these will all be categorical). Click OK:

Set these columns to categorical:
Now, we will link back in our Summarize Data:
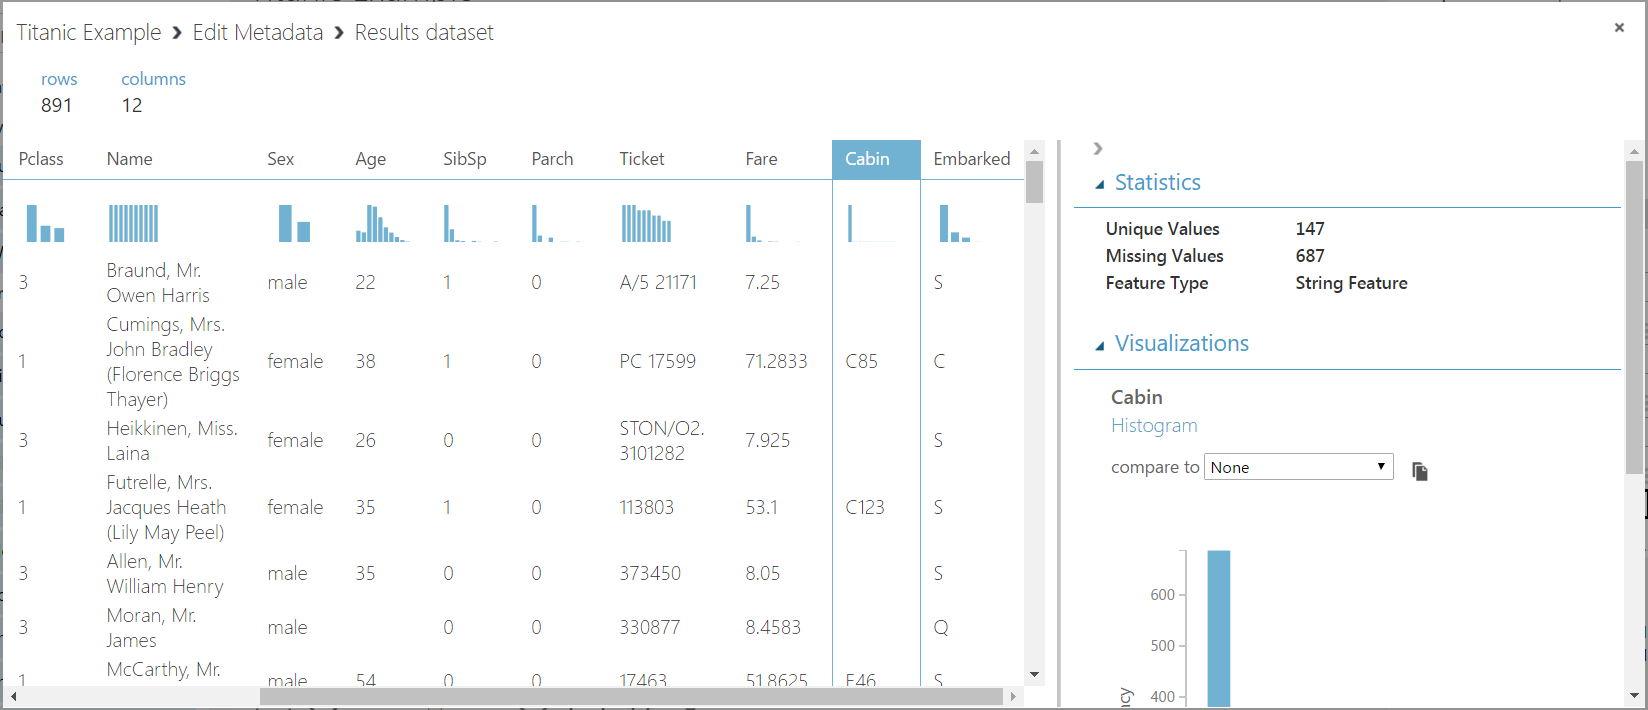
Viewing metadata, we can see the columns are now categorical:

And in Summarize Data:
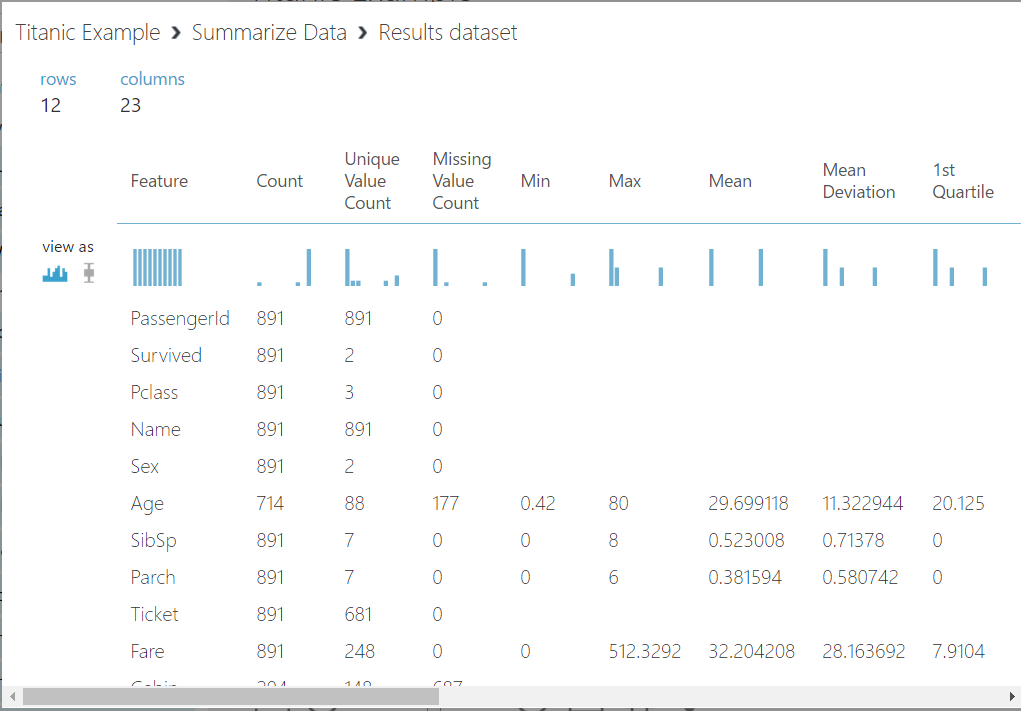
We can now determine which columns we need and which ones we don’t, and also which ones we need to scrub. Select each column to view if there are missing values or not. You can see Cabin has 687 missing values. This column may not be important to us in terms of what we are testing in our model, so we can potentially drop this column.
Find Clean Missing Data:
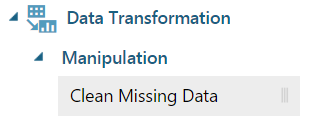
Drag this onto the canvas. Note the options available:
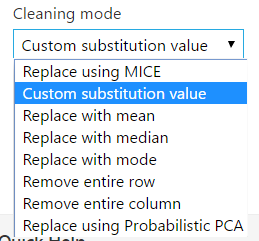
In the column selector, we can select all columns except of type string. We can then get the median value as a substitute:

To remove columns, Select Columns in Dataset:
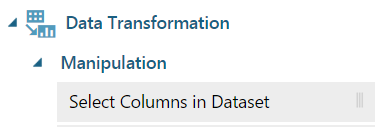
Link and select the columns you do want in the dataset:

Connect the nodes again, and view the results. We now have no missing values except for the Embarked column. Here what we can do is just remove these 2 rows and they won’t affect the outcome.

To do this, drag another Clean Missing Values. Select the Embarked column and chose Remove Entire Row:
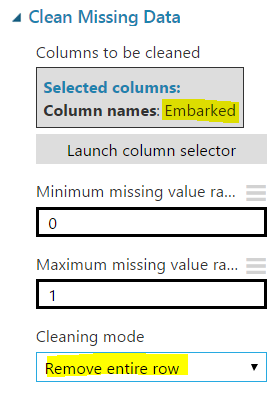
Connect and rerun. You will now see we have less rows and no missing values:

The data is now ready. In the next post I will show how to build the model in Azure ML.
I AM SPENDING MORE TIME THESE DAYS CREATING YOUTUBE VIDEOS TO HELP PEOPLE LEARN THE MICROSOFT POWER PLATFORM.
IF YOU WOULD LIKE TO SEE HOW I BUILD APPS, OR FIND SOMETHING USEFUL READING MY BLOG, I WOULD REALLY APPRECIATE YOU SUBSCRIBING TO MY YOUTUBE CHANNEL.
THANK YOU, AND LET'S KEEP LEARNING TOGETHER.
CARL


