Power BI, Microsoft’s cloud based business intelligence service, is a must-have component for companies running any of the products in the Microsoft Dynamics suite, whether it is CRM, AX, GP, NAV or Project Madeira. As a modern intelligence tool, it enables companies to rapidly get insight into their data and interactively find trends to make informed business decisions. Without BI, companies lack visibility and may be running with the wrong roadmap.
Businesses already have basic reporting into their data, such as what last month’s sales were, who are the best sales people, which regions are the most profitable. However, business Intelligence is far more than just running reports each month.
![]()
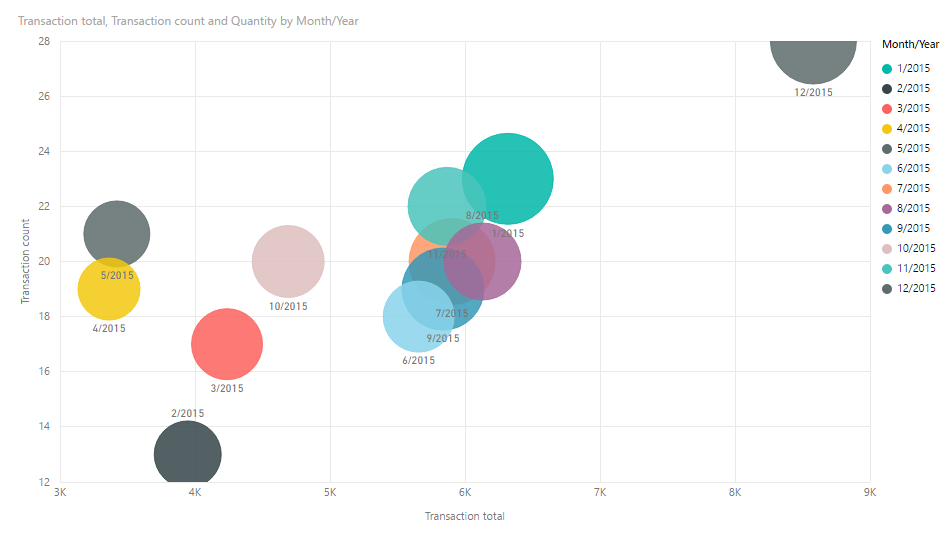
Figure: Power BI Dynamics Interactive Chart
Business Intelligence is about finding trends in your data that you didn’t know existed, and then being able to act on those trends – that’s the real competitive advantage. It’s about being able to ask questions of your data, to analyze data and interactively add additional filters and slicers, to view your own KPIs and to see dashboards on demand such as this one below showing Dynamics CRM data.
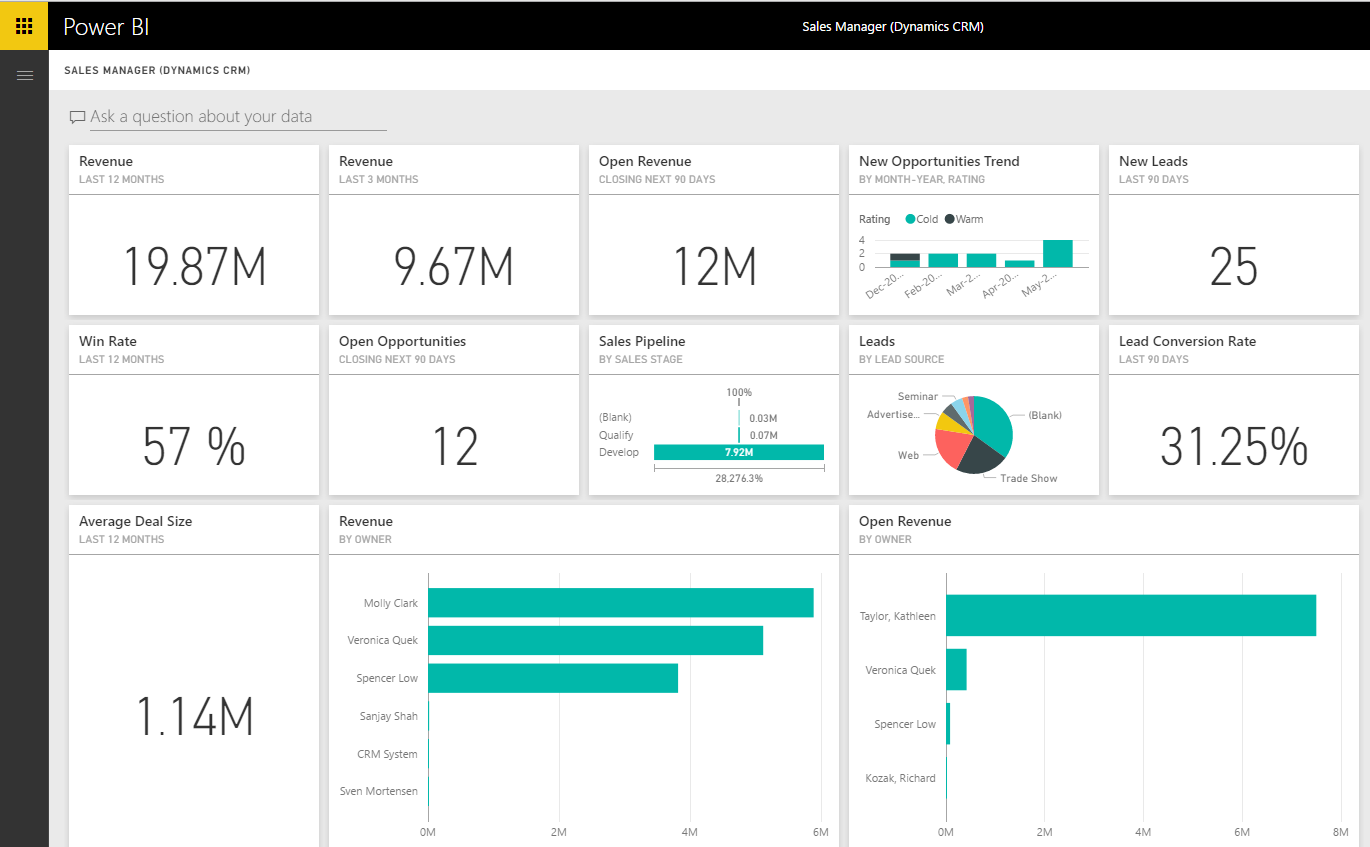
Figure: Power BI Dynamics CRM Sales Manager Dashboard
Connecting Power BI to your Microsoft Dynamics is simple. There are several publicly available content packs that get you started right away. Content Packs are pre-built reports and dashboards that you connect to. You can install them in seconds, and see your data in beautiful and meaningful reports generated automatically in minutes. Microsoft describes it accurately as 5 seconds to sign up, 5 minutes to wow.
To connect to a content pack, in Power BI click on the arrow at the bottom left of the site to be directed to the Get Data screen:
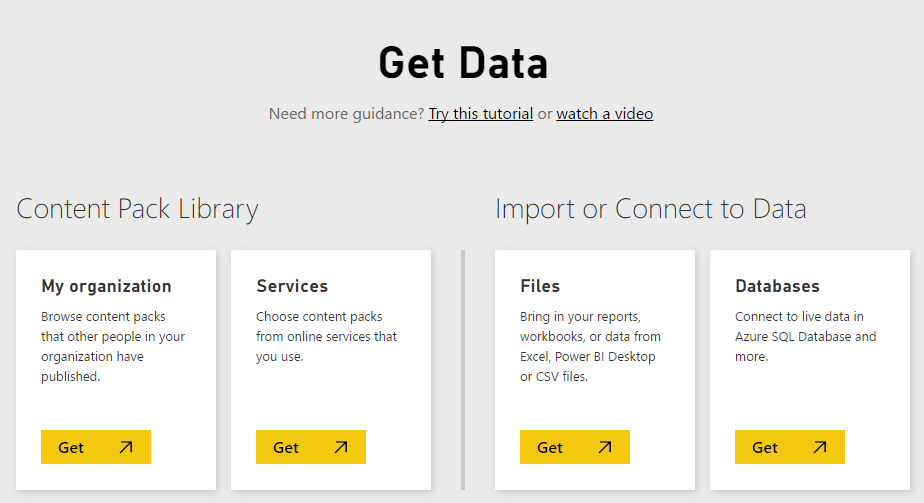
Figure: Power BI Get Data
Select “Get” under Services and it will take you to the content pack screen. You can see below there are several content packs available, from Microsoft as well as other vendors including SalesForce, Marketo, ZenDesk and many more.
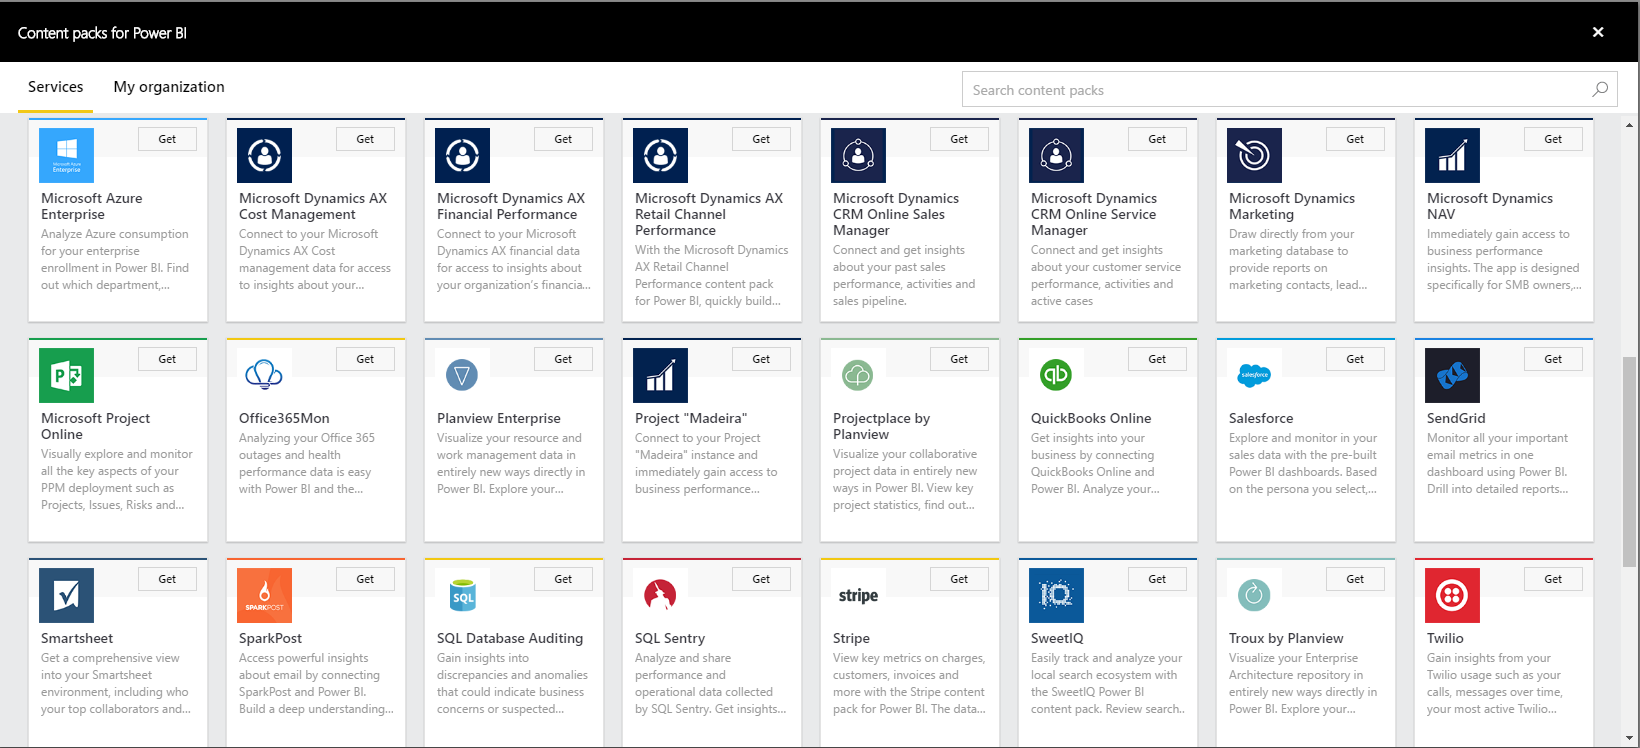
Figure: Power BI Content Packs
Microsoft has released several Dynamics content packs already, including:
- Microsoft Dynamics AX
- Cost Management
- Financial Performance
- Retail Channel Performance
- Microsoft Dynamics CRM Online
- Sales Manager
- Service Manager
- Microsoft Dynamics Marketing
- Microsoft Dynamics NAV
- Project “Madeira”
An example of what a content pack looks like after connecting is this Dynamics AX Cost Management content pack below. The content pack consists of one dashboard with multiple reports, each report made up of several interactive charts:
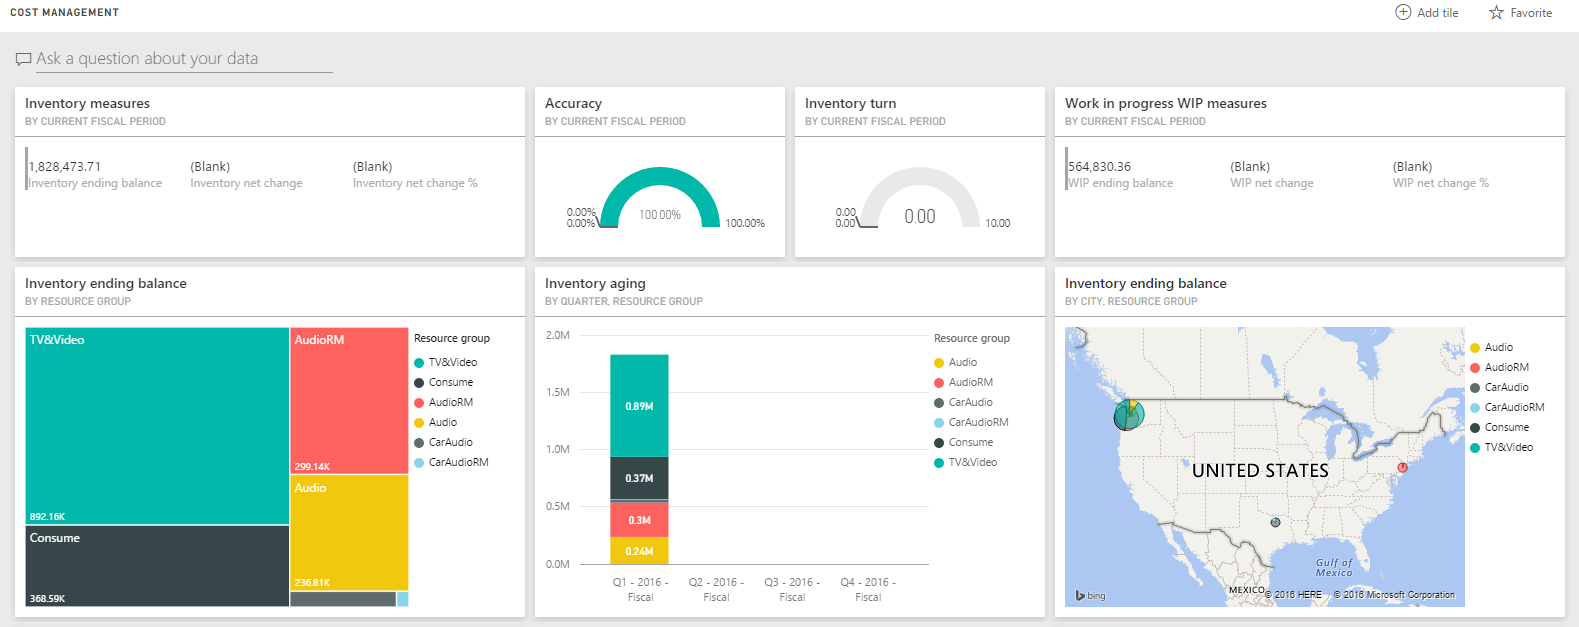
Figure: Dynamics AX Cost Management Dashboard
Select a report and see how the additional reports are organized like excel spreadsheet tabs.
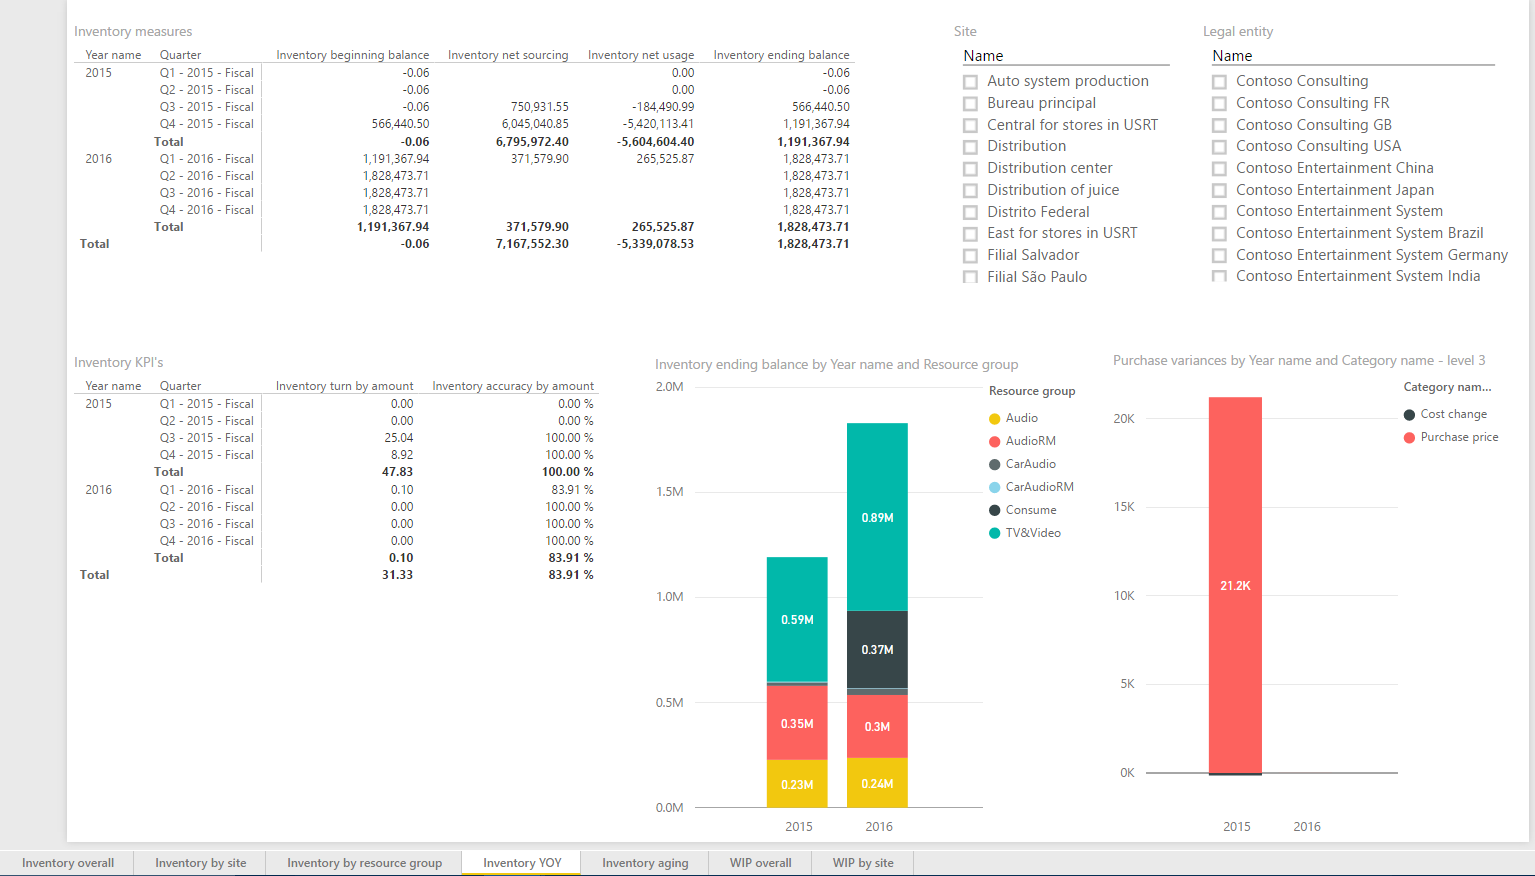
Figure: Dynamics AX Cost Management Report with Charts
Note that these packs will only work with certain versions of Dynamics software. I’m often asked if Microsoft will build content packs for earlier versions of Dynamics software, and when Microsoft will be building content packs for Dynamics GP. The short answer is: Microsoft is releasing Power BI service updates every week, and given everything they are investing into Power BI, it’s possible that they will be building more and more content packs for the Dynamics product range. Microsoft has also made it a little easier to make this possible with the support of OData in Dynamics GP 2016 (a technically easy way to get to your data).
Regardless of what content packs Microsoft has pre-built, you can connect to your Dynamics data and build your own reports right away. In fact, many organizations will take this approach over (or in addition to) content packs as they will have their own unique analysis needs and have custom data objects they will want to analyze.
Connecting to your Dynamics data to build reports and dashboards for an end user is easy for a Power BI developer. From the Power BI Desktop tool, you select your method to connect to the data. For Dynamics, this generally means connecting via OData or directly to SQL Server. Once you supply your credentials, Power BI will pull down the available data, which means your entities and tables, e.g. Customers, Vendors, Items, etc. You can select which ones you would like to use in your reports and dashboards based on your analysis needs. Getting to your Dynamics data is easy from a technical perspective – Microsoft did a great job of doing the heavy lifting. A developer, power user or consulting team can then build your Power BI reports, depending on the complexity of your requirements.
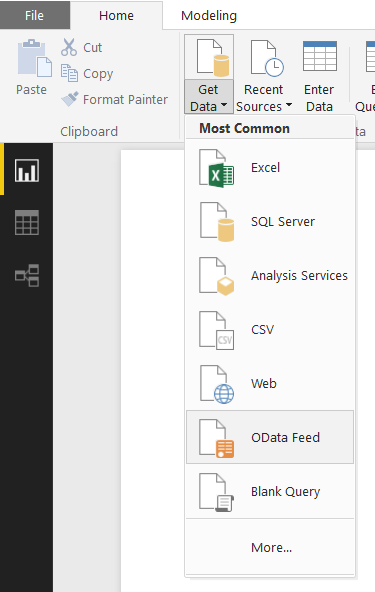
Figure: Power BI Desktop Get Data
Once your reports are built, you upload them to powerbi.com where they can be shared with users in your company to view and interact with.
Customizing reports that have been uploaded is very straight forward. You can see below I am taking the pre-built “Inventory YOY” report from the Dynamics AX Cost Management content pack I mentioned earlier and filtering where the Site is “Distribution”. The chart redraws itself interactively.
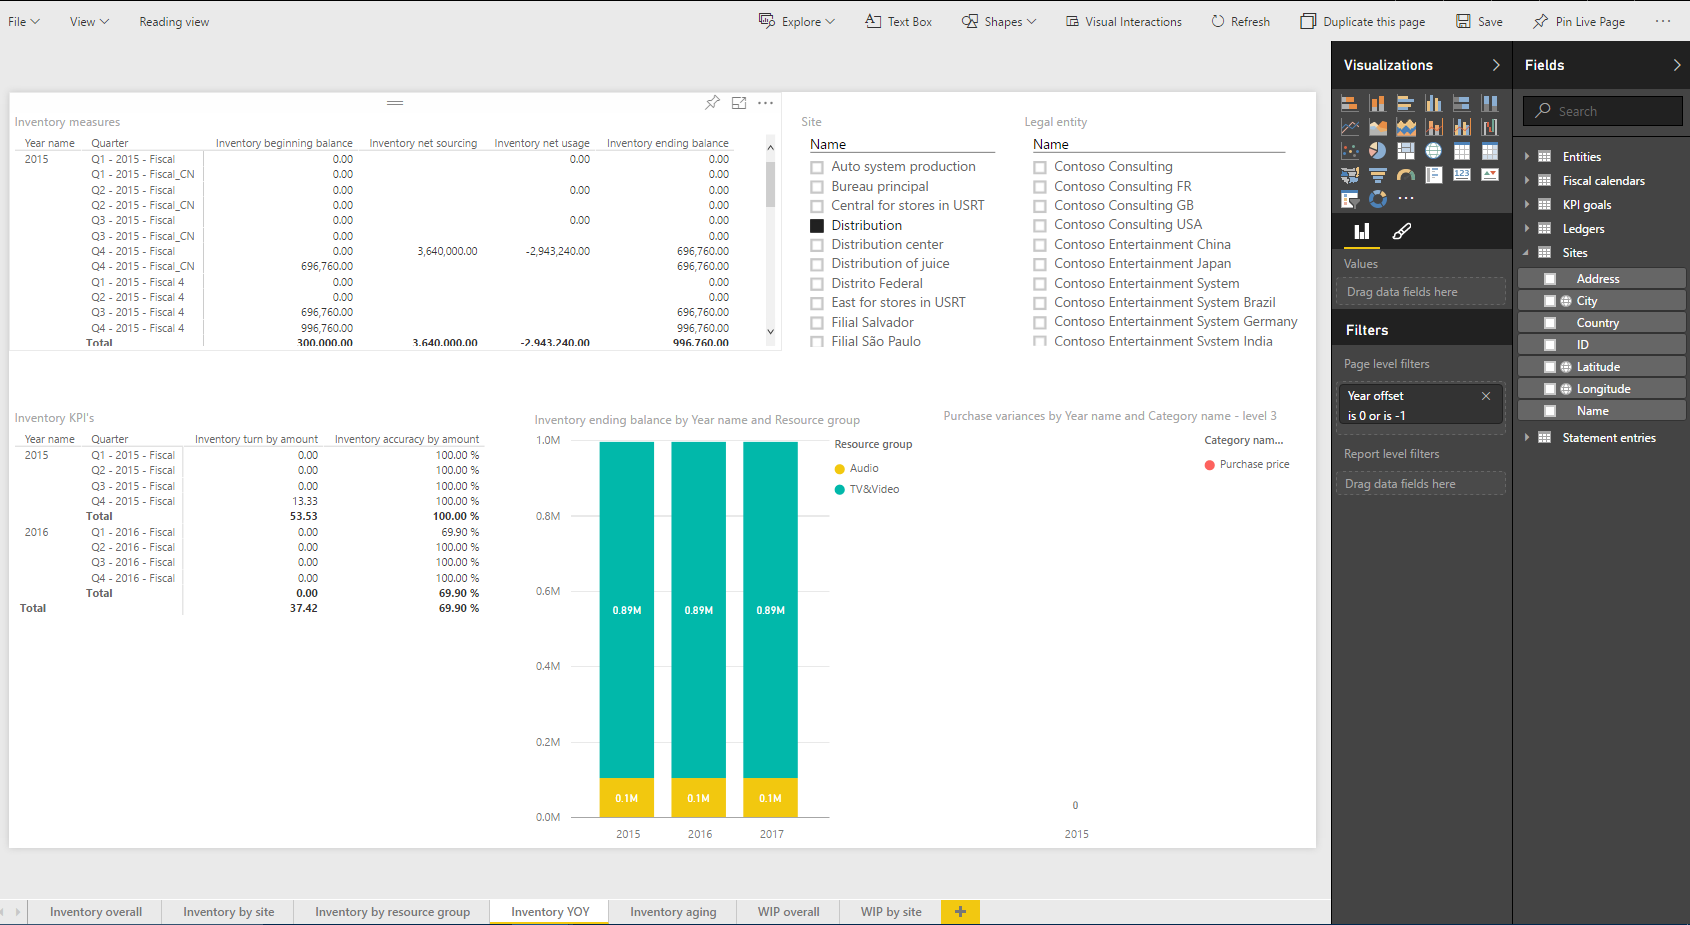
Figure: Editing a report
I may want to further customize this by changing the column chart to a pie chart, and adding a map of where the sites are located. It is simply a matter of click, drag and drop to do this:
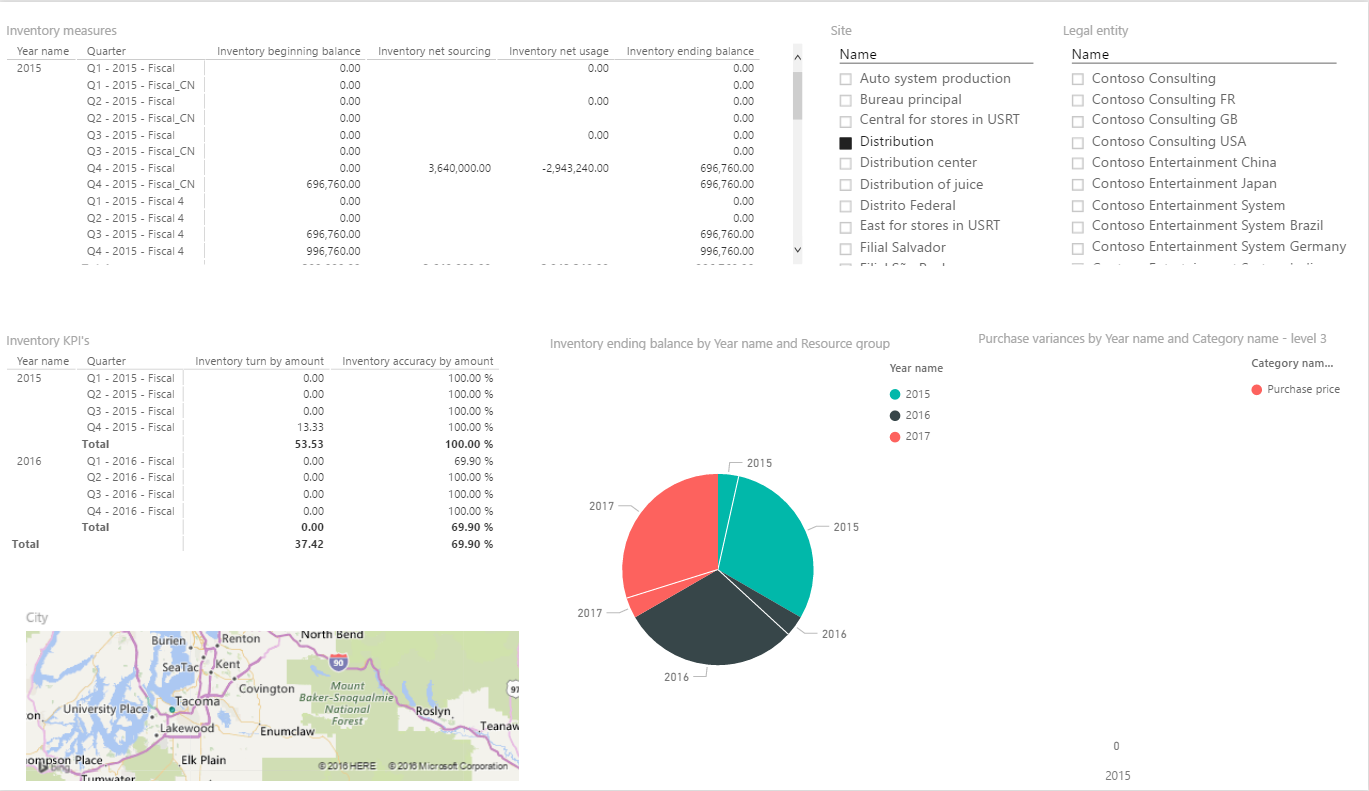
Figure: Adding to a report
I can then save this report and update my dashboard if I like.
One feature I love about Power BI is “Quick Insights”. This is a built in feature that applies algorithms to your data and pulls out trends and outliers. For example, your sales people might be closing deals in specific locations at a certain time of day, a trend you wouldn’t know existed.
To get Quick Insights, go to your data set and select View Insights. The Quick Insights engine will quickly run through your data and generate several charts itself.
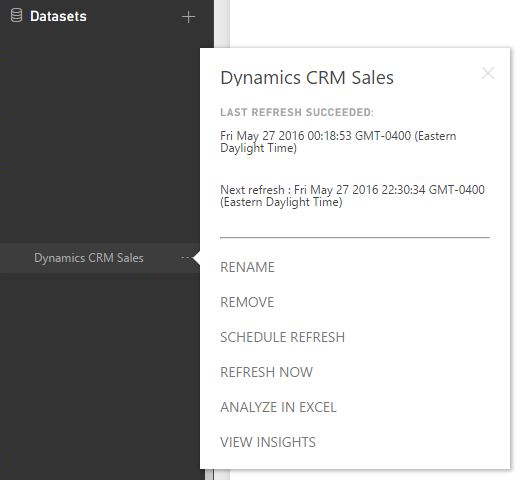
Figure: Generate Quick Insights
You can see below Quick Insights has generated a chart showing Opportunity Count by Potential Customer. “General Mills” has a noticeably higher Opportunity Count, so this company may want to focus their efforts around this potential customer. Also on the Won Revenue by Owner, Molly Clark has higher Won Revenue, so we may want to give her the more important accounts:

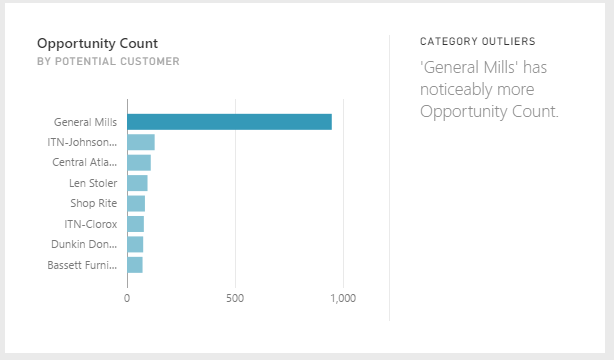
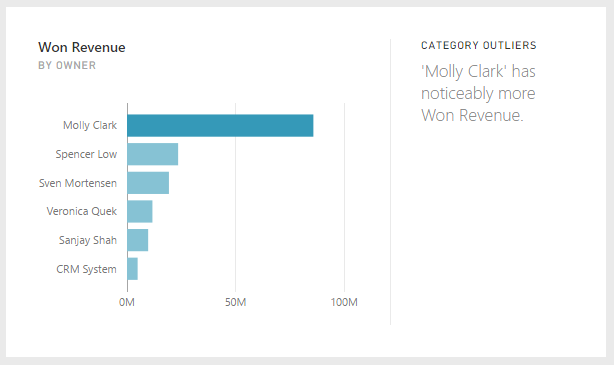
Figure: Quick Insights from Dynamics data
Quick Insights is a powerful tool that enables you to view data without needing to ask questions. It’s like having Malcolm Gladwell write a book of Outliers on your data. Once your Quick Insights are generated, you can pin them to any dashboard so each day when you log in you will see the chart updated with the latest information. It’s pretty nice.
Your data is also available to Power BI’s Q&A feature, which means you can ask your data questions in a natural language without needing a developer. Imagine asking your Dynamics data questions right in a web browser and getting answers right away. It’s powerful (jokes aside, you see where Power BI gets its name). To ask questions, go to your dashboard and you will see in the top left “Ask a question about your data”:
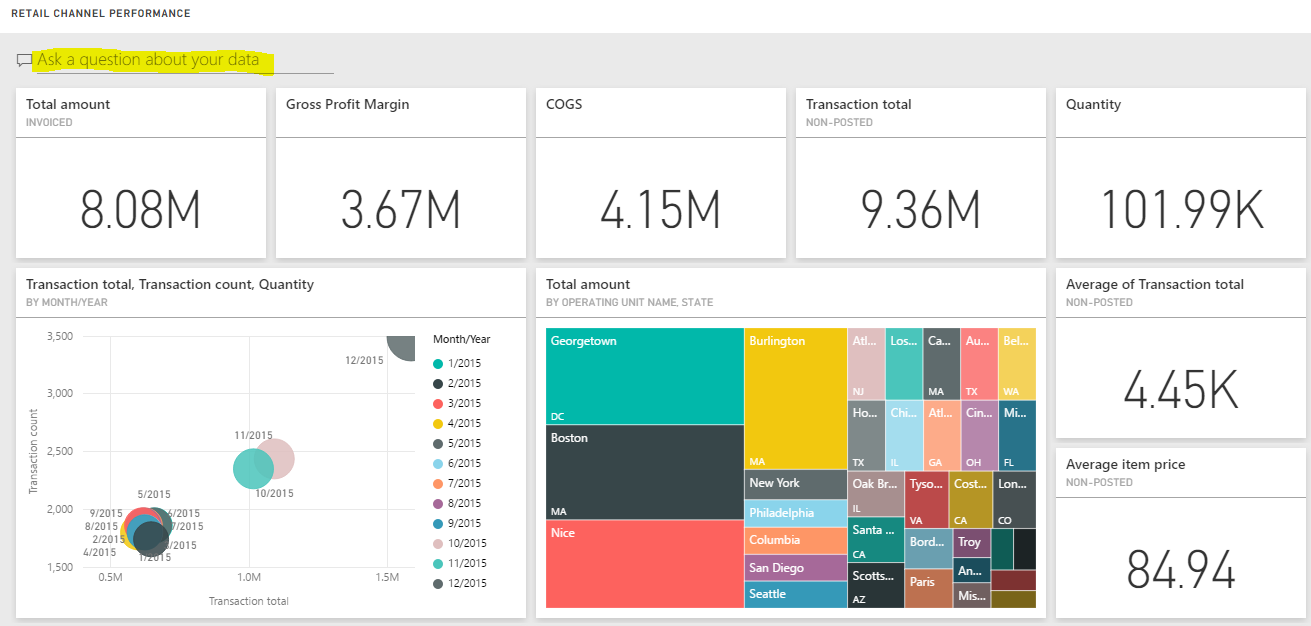
Figure: Power BI Q&A
Let’s say you are a CFO and you want to know your total amount of invoiced transactions. You can simply type in “what is the total amount” and get an answer:
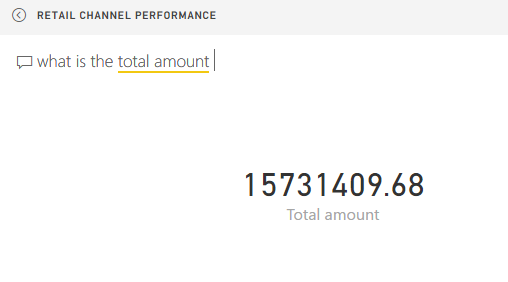
Figure: Q&A Results
You can take it a step further and filter the results, e.g. let’s add by state for 2015:
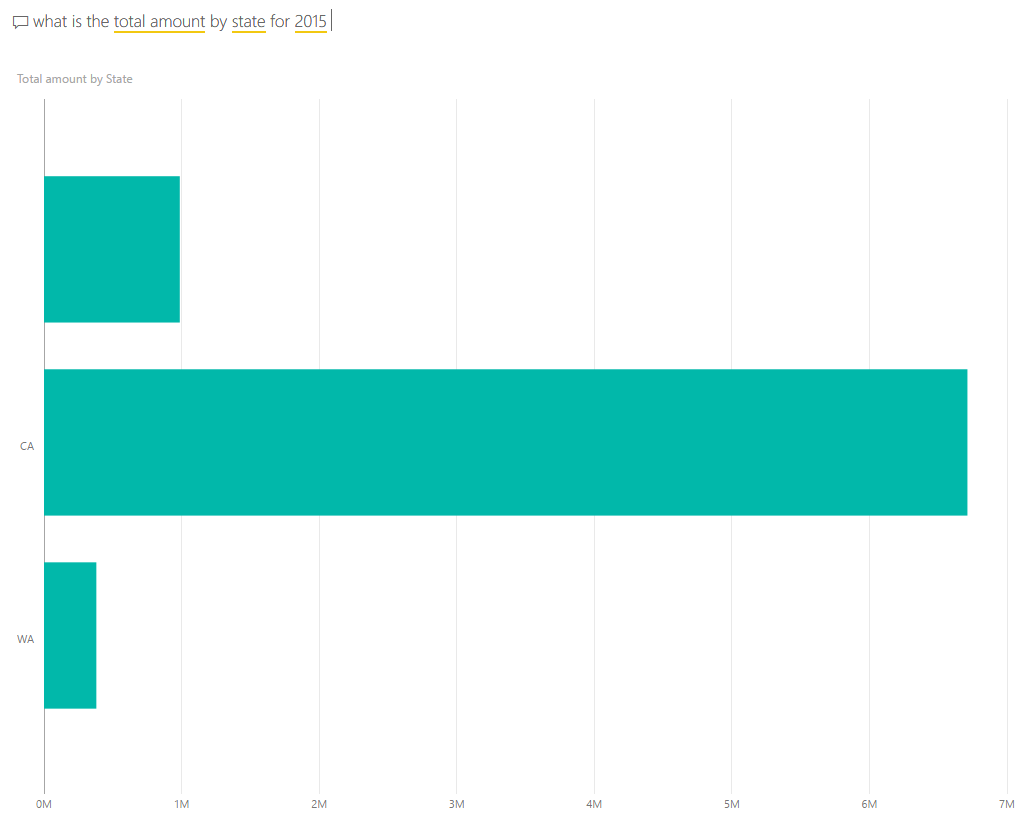
Figure: Q&A Chart
We can see Californian transactions are pretty high. How about viewing this on a map? Just ask the question:
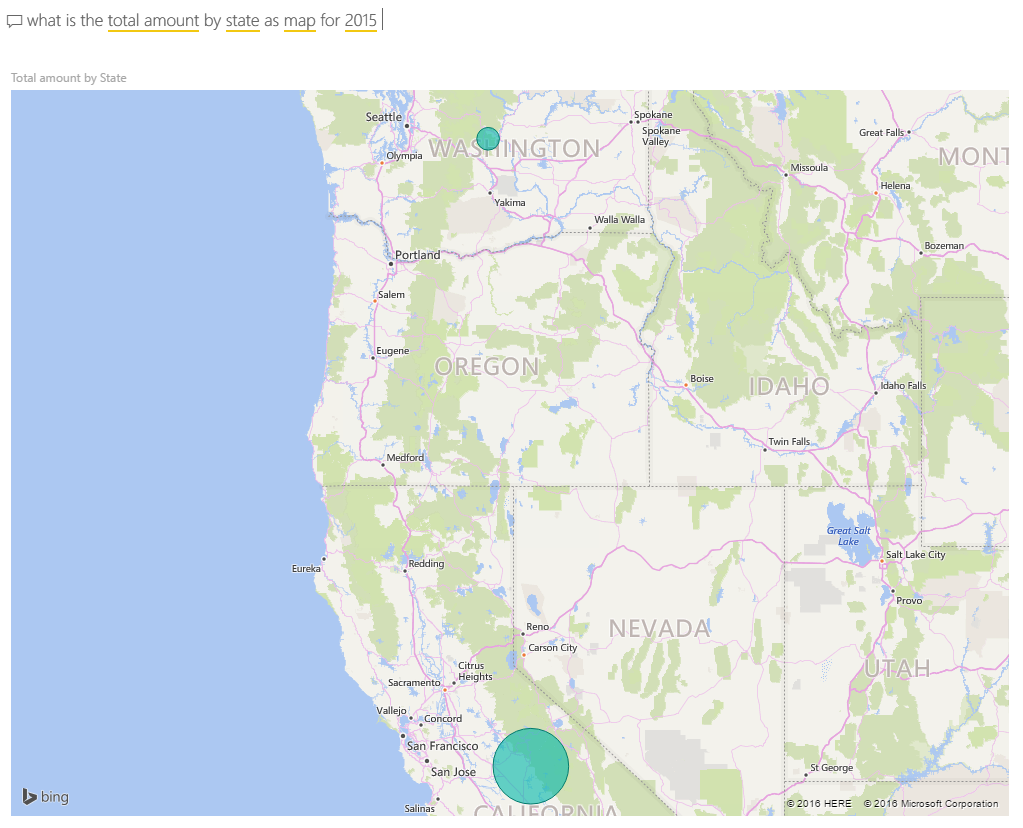
Figure: Q&A Map
I like this report, so I’m going to pin it to my dashboard so I can see it whenever I like with the most up to date information:

Figure: Pin Q&A
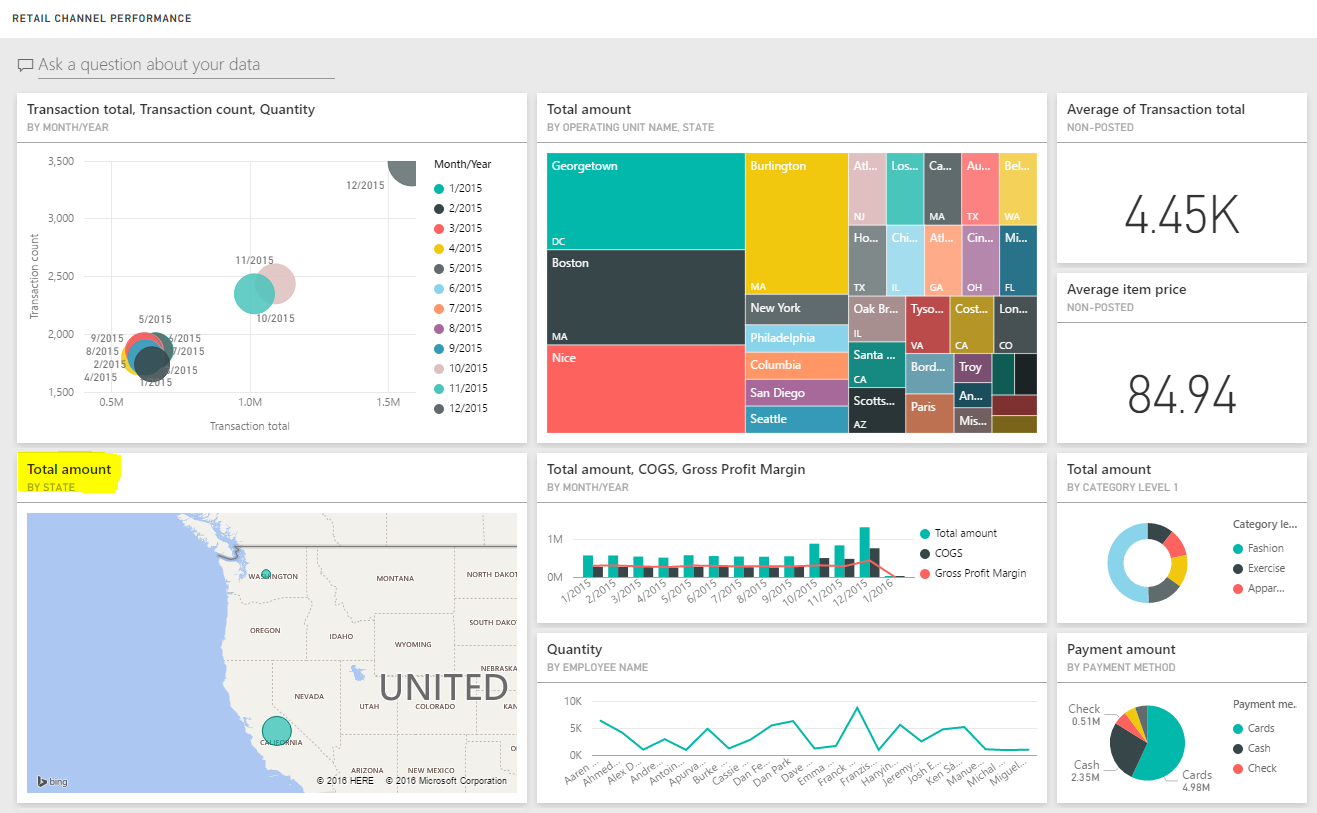
Figure: New chart pinned to dashboard
Additionally, it’s not just about Dynamics. If you are a company like so many others I have seen that keep data in many different data sources, e.g. spreadsheets, different financial systems, POS, WMS, HRM etc, Power BI can connect to the data and join it to your Dynamics reports and dashboards. So you can see, for example, items that are being sold in your Dynamics ERP and how the stock looks in your WMS. It’s pretty cool.
Lastly, Microsoft is integrating Power BI directly into its Dynamics applications. From within Dynamics AX and GP, you can view Power BI reports – no need to open Power BI in a browser if you don’t want to – it’s right there in the application. For example, see below how Power BI is running with the new “Dynamics AX 7” on the right hand side. You can easily have it run within Dynamics CRM as well.
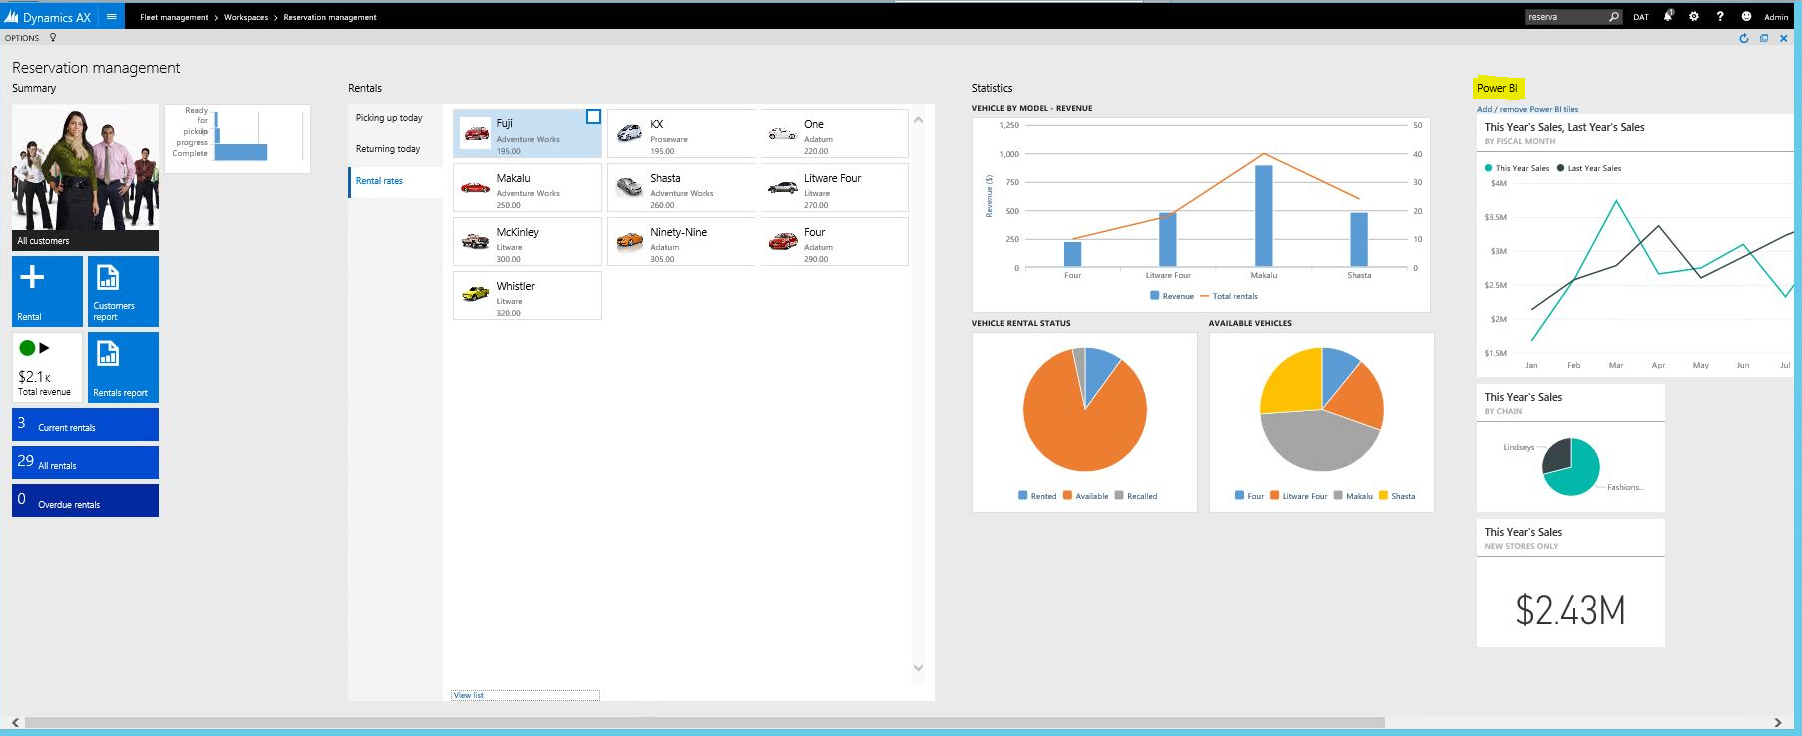
Figure: Dynamics AX 7 with embedded Power BI
In conclusion, Power BI and Microsoft Dynamics go very well together, and in my opinion are an essential pair. I’m looking forward to getting more of my Dynamics clients onto Power BI so they can benefit from its full power.
I AM SPENDING MORE TIME THESE DAYS CREATING YOUTUBE VIDEOS TO HELP PEOPLE LEARN THE MICROSOFT POWER PLATFORM.
IF YOU WOULD LIKE TO SEE HOW I BUILD APPS, OR FIND SOMETHING USEFUL READING MY BLOG, I WOULD REALLY APPRECIATE YOU SUBSCRIBING TO MY YOUTUBE CHANNEL.
THANK YOU, AND LET'S KEEP LEARNING TOGETHER.
CARL


